Data Mining of Meteorological-related Attributes from Smartphone
Data
LUIZFERNANDOAFRABRITO1
MARCELOKEESEALBERTINI2
UFU - Universidade Federal de Uberlândia FACOM - Faculdade de Computação
P.O. Box 593 - Campus Santa Mônica 38408-100 - Uberlândia (MG)- Brazil
Abstract. This paper presents studies on using data mining techniques with data collected from mobile devices in order to verify the viability of usage on rainfall alert systems. In our study, we have employed smartphones to gather meteorological-related data from telecommunication technologies, such as Global System for Mobile Communications (GSM) and Global Positioning System (GPS). In order to evaluate the capability of monitoring rain with data from smartphones, we used a simplified rainfall simulator to conduct studies in controlled scenarios. We used classification algorithms such ask-Nearest Neigh-bors, Support Vector Machine and Decision Tree to identify rainfall types (no rain, light rain and heavy rain). The classification results were promising and showed area under ROC curve of0.95with thek -Nearest Neighbors algorithm and0.80with Support Vector Machine. Additionally we have conducted preliminary and promising experiments in a real world scenario, which motivates further research on data collection, preprocessing and specialized classification for alarm systems.
Keywords:data mining, rainfall, smartphones, signal strength
(Received July 23th, 2016 / Accepted September 30th, 2016)
1 Introduction
Alert systems for weather events are of great econom-ical and social relevance. These systems monitor the current rain level in order to detect catastrophic events. High levels of precipitation can cause problems such as floods and landslides, which, in turn, can cause deaths and other losses. However, high levels of precipitation can be predicted to minimize such losses.
Current monitoring technologies include weather radars [7, 12], satellite imaging [5] and networks of lo-cal sensors [21].
Nowadays, alternative technologies are being stud-ied for increasing accuracy and reducing costs [19]. The usage of smartphones to form mobile sensor net-works has created opportunities to gather atmospheric data. These devices have considerable capabilities to
process and store local data. They can also come with specialized sensors to monitor attributes such as tem-perature and atmospheric pressure [25]. Also, these de-vices bring benefits, such as lower cost and higher spa-tial coverage due to the technology popularization.
model with 90% accuracy for temporal accumulation within30minutes.
In this paper, we have studied the viability of us-ing smartphone data to monitor and provide alerts for weather changes. For this purpose, we have obtained and analyzed signal attenuation of mobile devices from two types of wireless transmissions, GSM towers and GPS satellites. In our analysis we applied off-the-shelf data mining techniques to classify types of rain accord-ing to their intensity.
This paper is organized as follows: first we de-scribe related works; then we introduce our methodol-ogy and experiments; and, afterwards, we draw conclu-sions based on our results.
2 Related Work
In [18], the authors conducted experiments evaluating the influence of weather events on high performance wireless networks. Two stations gathered data such as temperature, wind chill, humidity, rainfall, snowstorm, dew point, atmospheric pressure, wind speed and wind direction in order to monitor the communication among stations. They observed the attributes that most affect the quality of networks are rainfalls and snowstorms. Rainfalls caused a loss of 4dBm of signal and snow-storms14 dBm. Other attributes can affect indirectly the signal quality. For example, the wind speed can change the antenna direction which decreases the sig-nal strength at specific places. Temperature and humid-ity can also affect indirectly the qualhumid-ity by damaging the equipments or by distorting electromagnetic waves. Fong [6] studied the attenuation of signal strength using wireless networks in external environments. In their study, the rainfall level was the most important at-tribute that conat-tributed to signal attenuation. Fong et al. noted that the greater the rain volume, greater will be the signal attenuation.
Messer [13] used rain gauges and climatic radars to monitor rainfall events. The data gathered were used to estimate the parameters of the power law equation given by:A=aRb, whereAis the signal attenuation in dB/km,Ris the rainfall rate along the communication link in mm/h and;aandbare the estimated parameters. The results using the power-law equation were com-pared to data from meteorological radars and rain gauges. In his studies, Messer noted that his results were more similar to data from rain gauges than mete-orological radars. This may have happened because, in some places, meteorological radars can generate errors due to factors such as topographic barriers, mountains and urban regions. Messer also noted that in higher fre-quencies than10GHz, rainfalls have greater influence
in these networks.
As future work, Messer suggested the usage of mo-bile devices to monitor rainfalls. Also, he mentioned that cell-phone networks used in his studies, ranging from1GHz to2GHz, are weakly sensitive to the rain-fall due to the low operation frequency. In Brazil, cell-phone networks operate at frequencies varying from
800MHz to3GHz, which can be considered low fre-quencies as well. However, as stated by Messer, some techniques, such as Kalman Filter, can be employed to improve the monitoring results.
In [22], the authors noted that the power law equa-tion underestimates rainfall levels, especially for those with high rain rate. In [15], wet antennas showed great impact in estimations. According to [2], with frequen-cies higher than35 GHz the power law equation be-comes linear and acts independently of the raindrop size in order to estimate the attenuation. However, in frequencies lower than9 GHz, the raindrop size con-tributes with more than20%to the errors in estimation. Using a more complex equation, [27] studied sources of uncertainties related to climatic events in order to predict rainfall intensity using data from mi-crowave links. Their model also considered sources such as: instrument imperfection, base attenuation and quantization. With this model, the authors were able to predict rain rate with accuracy of90%. They noted that the size of raindrops is directly proportional to the spatial variability of the rainfall.
In [19], the authors used the temperature of smart-phone batteries to measure the environmental temper-ature using a heat transfer model. A smartphone ap-plication [17] was developed to collect temperatures of smartphone battery. The authors collected data from eight major cities to verify their model against data from meteorological stations. Their model considers three heat sources: the smartphone, the user body and the en-vironment. The final equation of their study is:
¯
Te,j,dA,day =mj( ¯Tp,j,dA,day−T0) +T0+j,d, (1)
where T¯e,j,dA,day is the daily averaged environment
temperature, T¯p,j,dA,day the daily averaged smartphone battery in a givenAarea for a day period,T0is a
con-stant to balance the temperatures,mj is the estimated
parameter andj,dis a random disturbance whered
determina-tion equals to0.85. They also observed errors in esti-mations due to internal environments, which can have equipments that manipulate the local temperature such as air conditioners.
In [11] the authors informed in their studies great potential of using smartphones to predict the climatic state. They listed some useful features such as special-ized sensors and high coverage due to the technology popularization. Some devices are equipped with sen-sors that are capable of monitoring data such as temper-ature, humidity and atmospheric pressure.
Recent studies showed that atmospheric pressure can be useful to estimate atmospheric models [24, 10]. Fortunately, atmospheric pressure does not change in internal environments or behind physical obstacles that can proportionate measurement errors. However, smartphone sensors have accuracy and resolution rela-tive error of approximately0.2hPa and absolute error of2.6hPa. Mobile applications such as [20, 17] already make use of atmospheric pressure sensors for this pur-pose.
In [16], the authors present a new approach to gather meteorological data. They used smartphones to create a context map based on crowdsourcing using a smart-phone application to collect data such as: atmospheric pressure, temperature, relative humidity and luminosity. Early results showed high correlation between temper-ature and atmospheric pressure. They also conducted a survey via questionnaires about the influence of me-teorological events on people’s life. Based on answers provided in this survey, they observed that the most af-fected aspects in people’s life were the way they dress, mood and means of transportation. The variables that best explains these aspects are temperature, wind and relative humidity.
In this paper, differently to papers reviewed in this section, we propose to identify the current state of rain using the attenuation caused on wireless communica-tions available in smartphones. We used data from two wireless communication technologies: GSM which, in Brazil, operates at radio frequency ranging from 800
Mhz to 3 Ghz and GPS which operates at microwave frequencies. In order to build the model we propose to employ data mining techniques since it has shown liter-ature good results when high amount of data is available [23, 9, 26].
3 Data Mining Techniques
As previously discussed, rainfalls can jeopardize wire-less networks by attenuating its signal strength [1]. In this paper, our goal was to collect and analyze data from mobile networks, regarding its signal attenuation, in
or-der to detect the current rain state. For this purpose, we used data mining techniques to extract information from the collected data. More specifically, we used the following classification techniques to identify classes of rain (light rain or heavy rain): J48, k-Nearest Neigh-bors (k-NN), Multilayer Perceptron (MLP) and Support Vector Machine (SVM).
J48 is an algorithm that generates a decision tree as model. To build a decision tree, the algorithm selects an attribute and a threshold that best split the instances among predetermined classes. For example, consid-ering a tree represented by {if (GSM signal strength < −90) then decide {Yes}; else if (nSat< 6 ) then decideYes} else decide {No}}, if an instance has sig-nal strength less than−90dBm it will be classified as raining (Yes), otherwise we need to use the number of satellites that the smartphone is communicating with. In the next step, if the number of satellites is less than
6, the instance will be classified as raining (Yes) and, otherwise, as not raining (No). To select which attribute and threshold value, the algorithm uses information the-ory concepts such as information gain, which measures the attribute capacity to split instances among predeter-mined classes [14]. This algorithm is fast and easy to explain the reasoning of classifications.
k-NN algorithm uses spatial distribution among in-stances for comparison. To classify a new instance, the algorithm selects the nearestkneighbors using an op-timized structure and attributes the majority class to it. This kind of algorithm is called lazy, what means it does not build an explicit model to classify new instances.
Multi-layer perceptron (MLP) is inspired by natural neural networks. Artificial neurons, called perceptrons, receive and process stimuli from others via dendrites, and send signals to other neurons via axons.
A perceptron receivesninput values, which are or-ganized as an input vector~x = (1, x1, . . . , xn), and
combines withw~ = (wb, w1, . . . , wn), wherewb is a
bias weight and applies an activation functiono(~x·w~)∈ Rto produce an output. The activation function can be non-linear if a sigmoido(~x·w~) = 1+e1−~x·w~ or similar function is used. Perceptrons can be organized in a hi-erarchical network, known as Multi-layer perceptron, to form non-linear models to represent complex decisions surfaces.
mis-classifications in the next iteration. The algorithm ter-minates when the observed error is lower than a accept-able level.
SVM algorithm uses concepts related tok-NN and MLP [4]. It searches for similarity among strategi-cally chosen instances, named support vectors. It also uses non-linear activation functions, called kernel func-tions, to decrease error rate in the classification process. Unlikek-NN algorithm, SVM chooses as support vec-tors the instances that best describe the frontiers among classes.
SVM describes the frontier used to classified in-stances between two classes by weighting support vec-tors for positive or negative class. Often, a quadratic op-timization technique algorithm is employed to find the best support vectors which minimize the risk of making wrong classifications.
The region between the two groups of support vec-tors, positives and negatives, is called margin. Its dis-tance is measured by ||w2~|| wherew~ is as a function of attribute valuesxifrom instances, andbthe margin
off-set.
The margin is the distance between the two groups of support vectors, positives and negatives, measured by ||w2||, is the widest possible in order to minimize the risk of misclassifications. It is defined byw, which can be written as, for each instancei, a function of at-tribute values xi, known class yi, a b the margin
off-set to be found, and a kernel functionk(·,·), such that, yi(k(w, ~~ xi)≥1, which represents the margin borders.
To classify new instances the algorithm uses the chosen kernel, which can be a linear dot-product or non-linear functions such as polynomial,w~andb. When the kernel is non-linear, SVM split non-linearly distributed instances as well as complex MLP models.
4 Methodology and Results
As shown in previous sections, there are many studies about monitoring meteorological events by using wire-less networks. In most studies, these networks operated at frequencies higher than10GHz [18, 6, 13, 27].
In this paper, we used data from GSM and GPS net-works of smartphones to verify the viability of design-ing alert systems for meteorological events. We chose GSM towers because its widespread use.
In order to collect the data using a smartphone, a mobile application was developed to gather the follow-ing attributes: GSM signal strength; geolocation accu-racy, which is based on GSM towers and GPS satellites; number of available GPS satellites; average and stan-dard deviation of the signal strength of available satel-lites.
We used a simplified rainfall simulator in order to produce artificial rain and collect data in different sit-uations. It consists of a tripod that supports a hose jet pointing down. The nozzle has several kinds of output which we used to represent distinct types of rainfall. A small net suspended a smartphone at middle of the tri-pod and under the hose jet. This simulator was useful for isolating factors that can influence the values of col-lected data and, thus, the data mining results.
Additionally to the data collected with our artificial simulator we have also performed an experiment with data collected from a real rain. In the following subsec-tions we describe our tests and experiments in order to produce a classifier to identify types of rain. We used the following algorithms based on 10-fold cross vali-dation strategy and default Weka [8] parametrization: J48,k-NN withk= 5, MLP and SVM with radial basis function kernel. In our result we used the pairedt-test to compare SVM with other algorithms. This test compare two models in each iteration to determine whether the second model has statistically significant improvement or degradation when looking at a measurement variable.
4.1 Experiments with Artificial Rain
In this experiment, our goal was to verify if data col-lected from smartphones under artificial rain can be used to identify the following types of rain: no rain, light rain and heavy rain. We conducted this experi-ment based on a response surface methodology with a full factorial design [3].
The full factorial method is an experimentation de-sign that considers factors which may influence the out-come variable. For our experiments the outout-come vari-able is the type of rain. This method also allows to in-vestigate the interaction among factors and its impor-tance in the model. For this experiment, we considered three factors for data collection.
using a protective cover. For each configuration, we collected data during5minutes, totaling6855instances for all configurations.
The data gathered was used in two different anysis. For this, we built models using classification al-gorithms in order to verify their capacity to identify the different scenarios composed by the combination of factors.
In the first analysis, we built models to identify only the values of the factor we are more interested in, the amount of water produced by the rainfall simulator. In other words, there were only three possible cases for identification: heavy rain, light rain and no rain. In the second analysis, we wanted to identify all the possible combination using the three factors. With this analysis, we verified if the data gathered could be modeled to predict the other two factors too.
4.2 Results of Artificial Rain Experiments
In the first analysis, we had three classes to be iden-tified: no rain, light rain and heavy rain. As seen in Table 1, J48 achieved the best results. It obtained recall rate of 0.86, which indicates the fraction of instances correctly classified according to each class, and Kappa coefficient of0.79, which represents agreement among results obtained by cross-validation folds. Area un-der ROC curve ofk-NN and J48 were approximately
0.96, which may suggest these techniques overfitted data. However, SVM with radial basis function ker-nel obtained area under ROC curve of0.86which indi-cates a non-overfitted and reasonable classification per-formance.
The confusion matrix from SVM classifier is show in Table 2, where the correct class is indicated on rows and predicted class on columns. We observed the classes most correctly predicted were “heavy rain”. This class also had the least false positive rate, which means there were less false alarms in case of heavy rain. We consider this a relevant fact because heavy rain is the most important scenario for an alarm system.
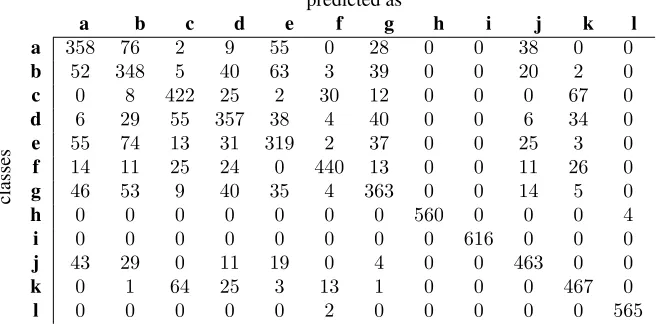
In the second analysis, we considered each combi-nation of factors as a class, which resulted in12classes. As seen in Table 3, SVM performance slightly im-proved the area under ROC curve to0.85, even though the recall rate slightly decreased to0.72.
The confusion matrix from SVM classifier, regard-ing this analysis, is shown in Table 4. We observed most errors are found in classes corresponding to no rain and light rain while for the most important class, heavy rain, fewer errors are found. We attribute these errors due to a non-proportional interference of rainfall to our mea-surements which is most distinguishable for heavy rain.
Note that we collected data for scenarios in a random-ized order which excludes the possibility of correlated or sequential errors in the classification process.
4.3 Experiment with Real Rain
In this experiment, our goal was to verify if data col-lected under real rainfalls can be used to identify the following types: no rain and rain. We tried to iden-tify only these two types due to limited amount of data collected. The collection was made during two consec-utive days, in which periods of no rain and light rain occurred, totaling1195instances for classification.
Differently to the previous experiment we also col-lected data from smartphone sensors, such as relative humidity and atmospheric pressure. Additionally we recorded the user’s location as either indoors or out-doors, which was provided manually by our user.
4.4 Results of Real Rain Experiment
As shown in Table 6, when using data from mobile networks and sensors, SVM classifier does not model properly the data gathered properly with area under ROC curve of0.59. However, algorithms such J48,k -NN and MLP achieved good results. Specifically, J48 achieved0.99of area under ROC curve,0.97of Kappa coefficient and0.99of recall rate.
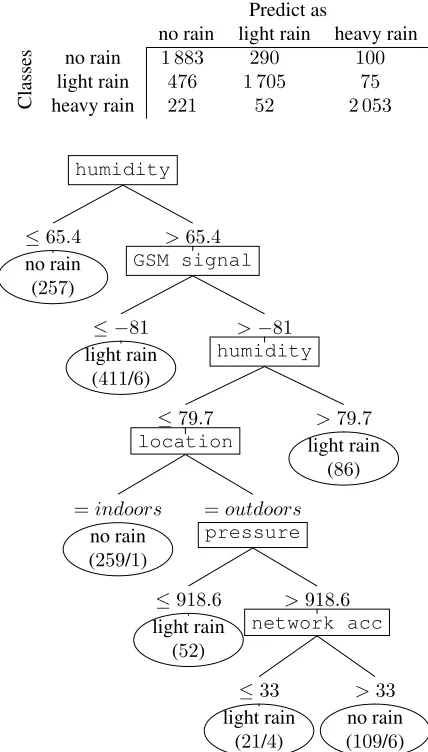
Figure 1 illustrates a decision tree generated by the J48 algorithm with minimum of15instances per leaf. This tree has13nodes, which indicates non-overfitting of data, and a reasonable data representation.
Considering the decision tree model in Figure 1, when the relative humidity is lower than65%it is not raining. In the same way, if relative humidity is higher than79.5%, the tree suggests it is raining. Here we can observe this model will not predict correctly in sce-narios in which users are indoors and using equipments that interfere with the humidity, such as air condition-ers.
Otherwise, when the relative humidity of air is not too low nor too high, the tree checks the signal strength of connected GSM network.
If the signal strength of GSM network is too poor (signal level<−81), the tree infers it is raining. Other-wise, we need to know if user is located indoors. This is reasonable because, when indoors, the signal can be more attenuated due to physical barriers. If the quality of network is good and user is located indoors we can say it’s not raining.
Table 1:Comparison of SVM to other algorithms regarding3-classes scenario. The3possible cases for classification were: no rain, light rain and heavy rain.
Measure SVM J48 5-NN MLP
Kappa coefficient 0.73±0.02 0.79±0.02◦ 0.76±0.02◦ 0.53±0.04• Recall rate 0.82±0.01 0.86±0.01◦ 0.84±0.02◦ 0.69±0.03• Area under ROC 0.87±0.01 0.97±0.01◦ 0.95±0.01◦ 0.84±0.01•
◦,•statistically significant improvement or degradation ±denotes standard deviation
Table 2: Confusion matrix regarding3-classes scenario and SVM model. The most correctly classified label is “heavy rain”.
Predict as
no rain light rain heavy rain
Classes
no rain 1 883 290 100
light rain 476 1 705 75
heavy rain 221 52 2 053
humidity
>65.4 GSM signal
>−81 humidity
>79.7
light rain (86) ≤79.7
location
=outdoors pressure
>918.6 network acc
>33
no rain (109/6) ≤33
light rain (21/4) ≤918.6
light rain (52)
=indoors no rain (259/1) ≤ −81
light rain (411/6) ≤65.4
no rain (257)
Figure 1: Decision tree generated by the algorithm J48 to identify rainfalls using the signal strength of smartphones to GSM towers, mobile sensors, user’s location and accuracy for finding user’s geopo-sition via triangulation of available terrestrial networks. Numbers at the bottom of every leaf denotes the amount of instances correctly and incorrectly classified.
This is due to the association of low atmospheric pres-sure on surface level with weather events such high cir-culation of air masses and precipitations.
In the last decision branch, if atmospheric pressure is higher than918.5, the model evaluates the accuracy (in meters) for finding user’s geoposition via triangula-tion of available terrestrial networks. If accuracy of ter-restrial networks is less than33then it is raining, and, otherwise, not raining. It is important to note that the last attribute seems less relevant because it only sep-arates21 instances labeled as “light rain” of 140 re-mained instances at this branch.
5 Conclusion
By using data mining techniques, this paper studied the viability of using smartphone data to identify rainfall types. According to our results, we observed the possi-bility to identify the rainfall between three types: heavy rain, light rain and no rain. SVM achieved reasonable classification performance on artificial rain experiments reaching up to0.80of area under the ROC curve. We observed the classes most correctly predicted were no rain and heavy rain, the most important scenarios for an alarm system. Most of the errors in classification process are for light rain intensity. We attribute these errors due to a non-proportional interference of rainfall to our measurements which is most distinguishable for heavy rain scenarios. For real rain identification, J48 algorithm built a model with small number of nodes and high interpretability using additional data such as smartphone sensors and user’s location. Even achiev-ing a non-overfitted model, J48 achieved0.99of area under ROC curve with statistical significance improve-ment over the other algorithms employed.
exam-Table 3: Comparison of SVM to other algorithms regarding12-classes scenario. All the12possible cases for identification are detailed in Table 5
Measure SVM J48 5-NN MLP
Kappa coefficient 0.75±0.02 0.79±0.02◦ 0.74±0.02 0.60±0.02• Recall rate 0.77±0.01 0.81±0.01◦ 0.76±0.02 0.64±0.02• Area under ROC 0.87±0.01 0.98±0.00◦ 0.97±0.01◦ 0.93±0.01◦
◦,•statistically significant improvement or degradation ±denotes standard deviation
Table 4:Confusion matrix regarding12-classes scenario and SVM model. We can still observe that the most correctly classified labels are those that have Factor 1 equals to no rain or heavy rain. All the12possible cases for identification are detailed in Table 5.
predicted as
a b c d e f g h i j k l
classes
a 358 76 2 9 55 0 28 0 0 38 0 0
b 52 348 5 40 63 3 39 0 0 20 2 0
c 0 8 422 25 2 30 12 0 0 0 67 0
d 6 29 55 357 38 4 40 0 0 6 34 0
e 55 74 13 31 319 2 37 0 0 25 3 0 f 14 11 25 24 0 440 13 0 0 11 26 0
g 46 53 9 40 35 4 363 0 0 14 5 0
h 0 0 0 0 0 0 0 560 0 0 0 4
i 0 0 0 0 0 0 0 0 616 0 0 0
j 43 29 0 11 19 0 4 0 0 463 0 0
k 0 1 64 25 3 13 1 0 0 0 467 0
l 0 0 0 0 0 2 0 0 0 0 0 565
Table 5:Combinations of factors regarding the12-classes classifica-tion experiment. Each letter represents the label used by the classifi-cation algorithms for each scenario in which we collected data using our simplified rainfall simulator.
Letter Factor 1 Factor 2 Factor 3
a no rain 40cm with cover
b no rain 80cm without cover
c no rain 40cm without cover
d no rain 80cm with cover
e light rain 80cm with cover
f light rain 40cm without cover
g light rain 80cm without cover
h light rain 40cm with cover
i heavy rain 40cm with cover
j heavy rain 80cm without cover
k heavy rain 80cm with cover
l heavy rain 40cm without cover
ple, real raindrops attenuate the signal throughout the path from smartphone to the telecommunication tower. Also, the usage of data from smartphone sensors and user’s current location helped to identify real rainfalls since this additional data proportionated relevant infor-mation to characterize the problem.
Table 6:Comparison of SVM to other algorithms to classify real rainfalls. The2possible classes were: no rain and light rain.
Measure SVM J48 5-NN MLP
Kappa coefficient 0.20±0.04 0.97±0.03◦ 0.85±0.05◦ 0.98±0.02◦ Recall rate 0.62±0.02 0.98±0.01◦ 0.92±0.03◦ 0.99±0.01◦ Area under ROC 0.59±0.02 0.99±0.01◦ 0.98±0.01◦ 1.00±0.01◦
◦,•statistically significant improvement or degradation ±standard deviation
References
[1] Arruda, B. A. Estudo comparativo das tec-nicas para calculo de atenuacao devido a chuva. Master’s thesis, Federal Univer-sity of Uberlandia, Brazil, 2008. http: //www.bdtd.ufu.br/tde_arquivos/ 11/TDE-2009-02-11T151730Z-1353/
Publico/Benedito.pdf.
[2] Atlas, D. and Ulbrich, C. W. Path- and area-integrated rainfall measurement by microwave at-tenuation in the 1–3 cm band. Journal of Applied Meteorology, 16(12):1322–1331, Dec. 1977.
[3] Box, G. E. and Wilson, K. On the experimental attainment of optimum conditions. Journal of the Royal Statistical Society. Series B (Methodologi-cal), 13(1):1–45, 1951.
[4] Chang, C.-C. and Lin, C.-J. LIBSVM: A library for support vector machines. ACM Transactions on Intelligent Systems and Technology (TIST), 2(3):1–27, Apr. 2011.
[5] Ebert, E. E., Janowiak, J. E., and Kidd, C. Com-parison of near-real-time precipitation estimates from satellite observations and numerical models.
Bulletin of the American Meteorological Society, 88(1):47–64, Jan. 2007.
[6] Fong, B., Rapajic, P. B., Hong, G. Y., and Fong, A. C. M. Factors causing uncertainties in outdoor wireless wearable communications. IEEE Perva-sive Computing, 2(2):16–20, Apr. 2003.
[7] Griffith, C. G., Woodley, W. L., Grube, P. G., Martin, D. W., Stout, J., and Sikdar, D. N. Rain estimation from geosynchronous satellite imagery—visible and infrared studies. Monthly Weather Review, 106(8):1153–1171, Aut. 1978.
[8] Hall, M., Frank, E., Holmes, G., Pfahringer, B., Reutemann, P., and Witten, I. H. The WEKA data
mining software: An update. SIGKDD Explor. Newsl., 11(1):10–18, Nov. 2009.
[9] Kohavi, R. Scaling up the accuracy of naive-bayes classifiers: A decision-tree hybrid. InKDD, vol-ume 96, pages 202–207. Citeseer, 1996.
[10] Madaus, L. E., Hakim, G. J., and Mass, C. F. Util-ity of dense pressure observations for improving mesoscale analyses and forecasts.Monthly. Weat-hear Review, 142(7):2398–2413, Jul. 2014.
[11] Mass, C. F. and Madaus, L. E. Surface pres-sure observations from smartphones: A potential revolution for high-resolution weather prediction?
Bulletin of the American Meteorological Society, 95(9):1343–1349, Sep. 2014.
[12] Meischner, P., editor. Weather radar: principles and advanced applications. Springer Berlin Hei-delberg, 2004.
[13] Messer, H. Rainfall monitoring using cellular net-works [in the spotlight]. IEEE Signal Processing Magazine, 24(3):144–142, May 2007.
[14] Michalski, R. S., Carbonell, J. G., and Mitchell, T. M., editors. Machine learning: An artificial in-telligence approach. Springer Science and Busi-ness Media, 1983.
[15] Minda, H. and Nakamura, K. High temporal reso-lution path-average rain gauge with 50-GHz band microwave. Journal of Atmospheric and Oceanic Technology, 22(2):165–179, Feb. 2005.
[16] Niforatos, E., Campos, P., Vourvopoulos, A., Do-ria, A., and Langheinrich, M. Atmos: a hybrid crowdsourcing approach to weather estimation. In
[17] OpenSignal. Opensignal: 3G and 4G LTE cell
coverage map. http://opensignal.com,
2014. [Online; accessed 16-November-2014].
[18] Otero, J., Yalamanchili, P., and Braun, H.-W. High performance wireless networking and weather.
High Performance Wireless Research and Educa-tion Network, 2001.
[19] Overeem, A., Robinson, J. C. R., Leijnse, H., Steeneveld, G. J., Horn, B. K. P., and Uijlen-hoet, R. Crowdsourcing urban air temperatures from smartphone battery temperatures. Geophys-ical Research Letters, 40(15):4081–4085, Aug. 2013.
[20] pressureNet. The weather’s future. http:// pressurenet.io/, 2014. [Online; accessed 16-November-2014].
[21] Ramirez, M. C. V., de Campos Velho, H. F., and Ferreira, N. J. Artificial neural network technique for rainfall forecasting applied to the Sao Paulo region. Journal of Hydrology, 301(1-4):146–162, Jan. 2005.
[22] Rincon, R. F. and Lang, R. H. Microwave link dual-wavelength measurements of path-average attenuation for the estimation of drop size distri-butions and rainfall. IEEE Transactions - Geo-science and Remote Sensing, 40(4):760–770, Apr. 2002.
[23] Schuldt, C., Laptev, I., and Caputo, B. Recog-nizing human actions: a local svm approach. In
Pattern Recognition, 2004. ICPR 2004. Proceed-ings of the 17th International Conference on, vol-ume 3, pages 32–36. IEEE, 2004.
[24] Wheatley, D. M. and Stensrud, D. J. The im-pact of assimilating surface pressure observations on severe weather events in a WRF mesoscale ensemble system. Monthly Weather Review, 138(5):1673–1694, May 2010.
[25] Yi, W.-J., Jia, W., and Saniie, J. Mobile sen-sor data collector using Android smartphone. In
2012 IEEE 55th International Midwest Sympo-sium on Circuits and Systems (MWSCAS), pages 956–959. Institute of Electrical & Electronics En-gineers (IEEE), Aug. 2012.
[26] Zhang, M.-L. and Zhou, Z.-H. Ml-knn: A lazy learning approach to multi-label learning.Pattern recognition, 40(7):2038–2048, 2007.