Vol. 3, Issue 6(June. 2013), ||V1 || PP 09-13
A Simulation Study of Developing (BREERA) Using Energy
Threshold
Prof. Dr. Saad Talib Hasson; Alyaa .A. Al-monaa’em Al-najar
College of Sciences, University of Babylon, IRAQ,Abstract: - Wireless Sensor Networks (WSNs) consist of several sensor nodes that connected together by wireless channels. Sensor nodes have limited battery power and in most applications it is not possible to replace the battery so, many researchers defined different routing algorithms to save energy for each sensor and then for whole network. This paper modified the Based Random Energy-Efficient Routing Algorithm (BREERA) of WSNs due to their major drawbacks in this routing algorithm. One important drawback is the loosing of the more active sensing nodes. We suggested the process of using energy threshold to increase the sensor node lifetime. The Net Logosimulator was used to design WSN with routing algorithm BREERA. Net Logo is multi agent programming language to simulate different phenomena. We chose Net Logo to design our system because it can assisted the process of building the required model, in addition to its other useful features such as: possibility to perform the ready-made model by any user, many interface options, possibility to make control on any agent individually, possibility to make control on the speed of running any model by speed slider and many more other features. This paper will make comparison between the performance of BREERA before and after modification under many terms: average received messages, average lost messages, average PDF, average LBF, average throughput, average dead nodes and average total energy.
Keywords—WSNs, PDF, LBF.
I. INTRODUCTION
Wireless Sensor Networks (WSNs) are hundreds or thousands sensors nodes witch deployment manually or randomly according to the nature of the application. WSNs used in many applications such as: medical, military, environmental sensing and security [1]. Usually each Sensor node limited rams capacity, battery power and bandwidth. There are five basic components for each sensor node: controller, transceiver, external memory, power source and sensor [2].
II. CLUSTERING
Clustering is the process of organizing unordered objects in groups called clusters. Each cluster consists of two components: cluster head and members. Clustering make any system very easy to identify and approach [3].
III. RELATED WORKS
Sucec, J. at 2002 designed a clustering algorithm based on the degree of the node to select the cluster head node called Highest-degree Algorithm (HD). Node degree means: the number of neighbouring nodes, hence the node with maximum degree become cluster-head and other neighbours become members [4].
Toh. c. k, at 2002 Designed clustering algorithm based on the identifier number of the node called Lowest Identifier Algorithm ( LID). This algorithm selected the node with lowest ID to become a cluster head and broadcast to neighbouring nodes to become its members [5].
M. Chatterjee at 2001 designed Weighted clustering Algorithm (WCA), this algorithm depended on four factors for each node to select the cluster head. The four factors are the difference degree, distance summation to all its neighbours, mobility and the accumulative time. Node with minimum weight selected as a cluster head node. The coefficient used in weights calculation are w1=0.7, w2= 0.2, w3= 0.05, w4 = 0.05. The sum of these co-efficient is equal to 1. The weight for each node can be calculated according to certain given formula [6].
Tzung-Pei Hong at 2010 Improved Weighted Clustering Algorithm (IWCA) because he observed WSNs consume power more than MANETs. He supposed to add fifth weights to the WCA to make it more suitable to implement with WSNs. The resulted Weights values are, w1=0.5, w2= 0.1, w3=0.05, w4= 0.05 and w5= 0.3 [7].
and it is send their messages to the next cluster head .The cluster head will make the farther member from it as a next cluster head. All clusters heads connected with each others. Each node in the network need to know who its cluster head and needn’t to know any information about their neighbors like the previous algorithms that mentioned previously. Number of Cluster-heads between the sink and the node from where new message is generated are called number of Hops. Threshold is the upper limit for the number of hops before the message dies. Threshold is save energy of whole network.Packet Delivery Fraction (PDF) is the Ratio between number of messages received and number of messages sent towards the sink. When the PDF value become nearest to 1 that’s refers to better performance for the routing algorithm [2].
IV. PROPOSEDWORK
Scenario of BREERA makes more active nodes lost rapidly from the network. We suggested using threshold energy value. This method determines what battery energy of the node that cannot play role in cluster-head. Threshold energy method avoiding the focus on some active nodes and consume all their energy and gave the chance for other active node which have larger energy to play as a cluster-head node.
V. Using energy threshold
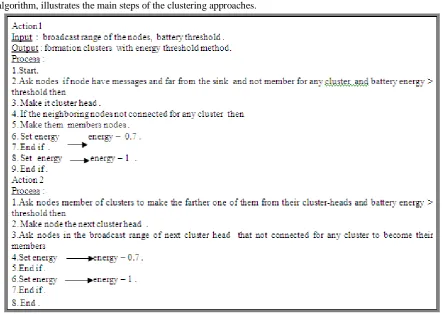
This method determines what battery energy of the node which cannot play as a cluster head node. The procedure of clustering the BREERA was changed to apply using energy threshold idea. The following algorithm, illustrates the main steps of the clustering approaches.
Fig. 1 shows the simulation program for the BREERA protocol with energy threshold method by using the Net Logo simulator:
Fig. 1: Net Logo display clustering of 500 sensor nodes with energy threshold method. Input monitor of
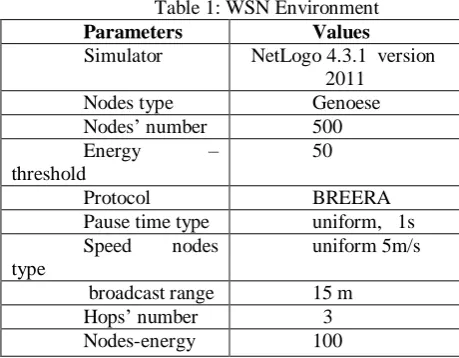
Table 1: WSN Environment
Parameters Values
Simulator NetLogo 4.3.1 version 2011
Nodes type Genoese Nodes’ number 500 Energy –
threshold
50
Protocol BREERA Pause time type uniform, 1s Speed nodes
type
uniform 5m/s
broadcast range 15 m Hops’ number 3 Nodes-energy 100
Table 2; summarizes the simulation results of running the simulation program 30 times with original BREERA and 30 times with our suggested method (using energy threshold). Each row in the table 2 represents the average after using both original BREER and the case of using energy threshold.
Table 2: Simulation Results
The results in the table 2 are graphed in the following figures to show the relationship between the network metrics and their effects on the network behavior. Fig. 2 shows the average received messages of two cases for REERA. 75 80 85 90 95
BREERTA with energy threashould
original BREERA Average Received Messages
Fig. 2: Average received messages of BREERA before and after using energy threshold method.
Fig. 2 shows that the average received messages with using energy threshold are higher than the received messages with the original BREERA. Fig. 3 shows that the average lost messages of BREERA for the two cases.
BREERA Average Received Message s Averag e Lost Message s Avera ge Dead Nodes Average Total Energy
Average PDF Average
LBF Average Throughput BREERA With Energy Threshold
89.73 10.26 1.2 48070.2 7 0.8 9 0.00326443 7 12.78 Original BREERA
82.03 17.96 1.1 46977.9 1
0.82 0.00371680 3
Fig. 3: Average lost messages of BREERA before and after using energy threshold method. Fig. 3 shows the original BREERA gives higher average lost messages than average lost messages with using the energy threshold. Fig. 4 shows the average PDF of BREERA for the two cases.
Fig. 4: Average PDF of BREERA before and after using energy threshold method.
Fig. 4 shows that the average PDF was improved with using the energy threshold method and its value approaches to 1. Fig. 5 shows the Average dead nodes of BREERA for two cases.
Fig. 5: Average dead nodes of BREERA before and after using energy threshold method.
Fig. 5 shows that the average dead nodes with original BREERA are higher than the average dead nodes of BREERA with using energy Threshold method. Fig. 6 shows average throughput of BREERA for the two cases.
0 5 10 15
BREERTA with energy threashould
original BREERA
A
ve
rag
e
Th
ro
u
gh
p
u
t
Fig. 6: Average throughput of BREERA before and after using energy threshold method.
Fig. 6 shows that the average throughput of BREERA with using energy threshold method is higher than average throughput of original BREERA. Fig. 7 shows average LBF of BRERA for the two cases.
Fig. 7: Average LBF of BREERA before and after using energy threshold method.
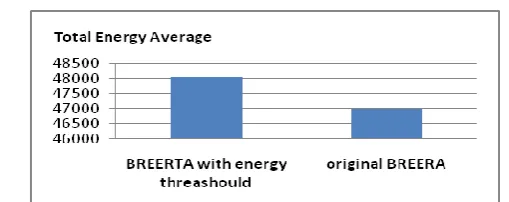
Fig. 7 shows that the average LBF of BREERA with using energy threshold method is being higher than the average LBF of original BREERA. Fig. 8 shows the average total energy threshold of BREERA for the same two cases.
0.003 0.0035 0.004
BREERTA with energy threashould
Fig. 8: Average total energy of BREEA before and after using energy threshold method
Fig. 8 shows that the average total energy of BREERA with using energy threshold method is higher than the average total energy of original BREERA.
VI. CONCLUSION
The simulation results from this study show that the Based Random Energy-Efficient Routing Algorithm (BREERA) performance will improved by using threshold of battery energy of the cluster-head node. Improved BREERA performance falls only in average LBF because it depends on the number of cluster-heads that best fits the size the network and if the number of cluster-heads according to the BREERA is being randomly. If the network designer wants to get the highest average LBF, he must increase the threshold value.
REFRENCES
[1]. Muhammad Tabassum Tahir, “ Performance Evaluation of Biased Clustering Technique and Random Algorithm For
Wireless Sensor Networks “, A dissertation submitted to the school engineering – Liverpool John Moors University in fulfillment of MSC project, 2011 .
[2]. Amhmed. A. Bhih, “Performance Evaluation of Energy Efficient Routing Protocols for Wireless Sensor Networks
WSNs “, A dissertation submitted to school engineering –Liverpool John Moors University in Fulfillment of MSC project, 2011.
[3]. Jing Wu, Guo-chang Gu, and Guo-zhao Hou, ” A clustering Considering on a Hierarchical Topology’s tability for
Ad Hoc Networks “, First International Workshop on Education Technology and Computer sscience, 2009.
[4]. Sucec.J. and Marsic.I, “Clustering overhead for hierarchical routing in mobile ad hoc networks“,IEEE proceeding,
2002.
[5]. Toh.c.k and Chai K Toh , ” Ad hoc Mobile Wireless Networks protocols and Systems “, New Jersey :Prentice Hall
PTR, 2002 .
[6]. M.Chatterjee, S.K. Das and D. Tugut, WCA : “ A Weighted Clustering Algorithm for mobile ad hoc networks,
Cluster Computing “, vol.5, no. 2, pp.193-204, 2002 .
[7]. Tzung-Pei Hong and Cheng-His Wu, ” An Improved Weighted Clustering Algorithm for Detection of Application