Towards a methodology for publishing Linked Open
Statistical Data
Irene Petrou, Marios Meimaris, George Papastefanatos
Institute for the Management of Information Systems, Research Centre “ATHENA”, Artemidos 6 & Epidavrou, Marousi 15125, Greece, {irene.p, m.meimaris, gpapas}@imis.athena-innovation.gr
Abstract: The number of open government initiatives and directives around the globe with focused interest on publishing large amounts of data on the Web as “open” is increasing rapidly in the recent years. Opening up data aims for citizens, scientists and organizations to easily access, discover and exploit the data, and consequently to benefit from them. As a result, there is an emerging need to integrate and represent data in transparent and reusable ways, with a high degree of interoperability which will further facilitate the discovery of new connections and insights by linking data coming from diverse sources. Statistical data published either by government bodies or by national statistical authorities are used for policy and decision making purposes, as they present important socioeconomic indicators. In this paper, we present a generic methodology describing the basic steps and overall model to publish statistical data coming from tabular data sources or relational databases in the form of Linked Open Data.
Keywords: Statistical data, Data Cube Vocabulary, Tabular data, Linked Data, Open Data
Acknowledgement: This research is co-financed by the European Union (European Regional Development Fund - ERDF) and Greek national funds through the Operational Program "Competitiveness and Entrepreneurship" (OPCE ΙΙ) of the National Strategic Reference Framework (NSRF) - Research Funding Program: KRIPIS.
1.
Introduction
The number of open government initiatives and directives around the globe with focused interest on publishing large amounts of data on the Web as “open”has increased rapidly in recent years. A remarkable example is the Open Government Partnership1 launched in 2011 with 8 founding countries, growing to 64 countries participating today. In the same year, datacatalogs.org2 was launched, which currently holds an inclusive list of 390 open data catalogs around the world. Opening up data enables citizens, scientists and organizations to easily access, discover and exploit the data, and consequently to benefit from them, in line with governments providing transparency, accountability and empowerment to citizens, while reducing incidences of corruption. Public sector information (PSI) is comprised of a comprehensive range of digital information produced, collected and processed by public bodies and includes data ranging from geospatial information, such as digital maps, meteorological and public transportation, to legal, financial and statistical data (Petrou, Papastefanatos & Dalamagas, 2013). In this paper, we focus our interest on the publication of open statistical data. Statistical data, often published by government bodies and/or national statistical authorities, provide insights and socioeconomic indicators that are often used for policy and decision making purposes, thus enabling a better understanding of both the qualitative and quantitative characteristics of societies, as well as quantifying the results and social
1
http://www.opengovpartnership.org/
2
impact of such decisions. Eurostat highlights the importance and the role of statistics in policy making through the “Statistics for policymaking: Europe 2020” document in the context of its Europe 2020 strategy (Eurostat & European Commission, 2011). A most known example is the Greek crisis and the enactment of austerity measures triggered by the data published by the Hellenic Statistical Authority (EL.STAT)3 in 2009 regarding the deficit, the debt and the GDP in Greece. Similarly, decisions in the strategic management of a business may be influenced by various socioeconomic indicators, such as market trends and product sales. Scientists use large amounts of statistical data, which represent collections of observations, to examine phenomena or for other research purposes such as economic research (Salas et al., 2012). Therefore, managing, sharing, manipulating and publishing statistical data efficiently are critical aspects of society’s evolution.
In Greece, although a great number of datasets are already made available to the public, their published format is often non-machine readable (e.g. pdf) and difficult to process and query (e.g. Excel files), thus not allowing reusability and interoperability. As a result, there has been an emerging need for integration and representation in transparent and reusable ways that facilitate interoperability, collaboration and information enrichment (Lebo et al., 2011). Galiotou & Fragkou (2013) have characterized the current organization and publication of public sector data as “chaotic”, pointing out the need for providing public sector data as Linked Open Data (LOD), for achieving greater data linkage and reusability. Linked Open Data is an emerging set of directives and technologies, commonly adopted to overcome the problems encountered of publishing these large-scale distributed data. Recently, several Greek LOD initiatives emerged; an example is the work of Vafopoulos et al. (2013) where they generate, curate, interlink and distribute daily updated public spending data in Greece in LOD formats. Therefore, our current work is motivated by the following needs for publishing statistical data in LOD format:
•
Public sector accountability and transparency: Open data enables citizens to have access to PSI, thus enabling transparency and accountability in the public sector. Moreover, linked data enables the retrieval, cross-reference and validation of data published by multiple public agencies’sites.•
Interoperability and uniformity across public sector organizations: LOD provides a means for publishing PSI in a uniform and machine-readable format (RDF) with commonly agreed semantics, designed by global organizations and initiatives. This promotes better structure and understanding of available open data across different governmental agencies, as LOD help to have enhanced datasets, where cohesive information is available for the units that are common across these agencies.•
Cost efficiency through data reusability: LOD reduces costs and manages time and resources more efficiently for recollecting, maintaining and producing PSI. For example, there is no need to conduct annual statistical surveys to collect data about imports-exports of organizations when such data are already maintained by the Customs agency.•
Creation of added-value statistics, new insights for policy making procedures: Data mash ups and correlation analysis across linked datasets allows investigating and answering more complex questions, which are required in the policy making process. There is no single agency that holds all the necessary information for different public issues.•
Adoption of LOD practices and technologies in the Greek public sector: The use of LOD technologies for making statistical data available can promote the wider adoption of LOD practices in the Greek public sector. This can help public servants and policy makers understand the opportunities and benefits gained by publishing the data in LOD format.3
Currently, the majority of statistical data are offered in the form of tabular data, such as CSV files and Excel sheets (Ermilov, Auer, & Stadler, 2013). In this paper, we highlight the rising need of publishing statistical datasets in linked open data formats rather than being available only in tabular forms and files. This process is twofold; it first involves the conversion of already published datasets from tabular to RDF format, but most notably it involves the restructuring of the whole data-publishing lifecycle of statistical data towards linked open data formats.
Various vocabularies and interoperability standards have been proposed for the exchange and publishing of statistical concepts, microdata and observations, such as the SDMX (Statistical data and metadata exchange) standard, derived from an initiative sponsored by large statistics organizations, the BIS, ECB, Eurostat, IMF, OECD, UN & World Bank (2005), the SCOVO Vocabulary, proposed by Hausenblas et al. (2012) and, finally, the Data Cube Vocabulary (Cyganiak, Reynolds, Tennison, 2014). SDMX is the most widely used standard for data exchange across different statistical organizations. SCOVO (Statistical Core Vocabulary), on the other hand, has been the first vocabulary for expressing statistical data in RDF. Although it is a relatively simple and easy to use vocabulary, it lacks support of important features when it comes on publishing statistical data, such as organizing the data within a dataset into slices, or distinguishing different concepts for data attributes, dimensions and measures, or finally describing only the contents of the dataset, rather than its structure. Therefore, the authors of SCOVO highly recommend the use of Data Cube Vocabulary, an emerging vocabulary for publishing multidimensional statistical observations as LOD. The underlining model for the Data Cube Vocabulary is the multidimensional, or else cube model, comprised of three basic components: dimensions, measures and attributes. Dimensions indicate what an observation applies to; measures indicate the phenomenon being observed, such as the number of households, whereas attributes help to interpret the observed values, such as the frequency, decimals or unit of measurement. These components allow the user to define the structure of a statistical dataset, which is called the data structure definition (DSD). All together, the components and DSD, are used to define the actual measurements of the statistical datasets, or else called, the observations. It is important to note, that the Data Cube Vocabulary is built upon other vocabularies, mainly, SDMX and SKOS4, to successfully describe statistical concepts; classifications, hierarchies or code lists (Cyganiak et al., 2014; Petrou et al., 2013).
Regarding related tools and applications, there have been various attempts that facilitate the conversion of tabular data to LOD, such as Tabels5, RDF Refine6, and Triplify and they can be potentially used for converting multidimensional data to LOD. However, most of them assume that the user is familiar with semantic technologies and vocabularies. They require prior knowledge of the data cube concepts and how these are mapped to the statistical measures and variables that the user wishes to publish as LOD. In this way, most of them do not offer an intuitive and practical way for the statistician to convert already published datasets in tabular format as LOD.
In this work, we aim at providing a step-by-step guide to the user, in order to encourage publishing statistical data to LOD without prior knowledge or skills. Focusing on statistical, multi-dimensional data, the user will be provided with a methodology to recognize the necessary components from the datasets which are required in the conversion process. The methodology may be applied and used with any combination of tools that support publishing data as LOD and are more appropriate to each user, such as the LOD2 Statistical Workbench7. Also, the methodology is closely related, though adjusted for statistical and multi-dimensional data, with other life cycle models suggested for publishing linked government data on the Web (Auer et al.,
4
http://www.w3.org/2009/08/skos-reference/skos.html
5
http://idi.fundacionctic.org/tabels/
6
http://refine.deri.ie/
7
2012; Hyland & Wood, 2011; Villazón-Terrazas, Vilches-Blázquez, Corcho, & Gómez-Pérez, 2011). We further aim at highlighting parts of the publishing process that could be improved or automated to reduce the effort required by the user, as most of the available mechanisms, tools and practices are generic.
The rest of the paper is structured as follows: In Section 2 we present a generic methodology for publishing statistical datasets as LOD. In Section 3 we present a use case evaluation scenario to test our methodology. Section 4 describes a list of common problems faced during publishing, increasing the complexity of the process. Finally, in Section 5 the paper concludes, highlighting some future work.
2.
Methodology
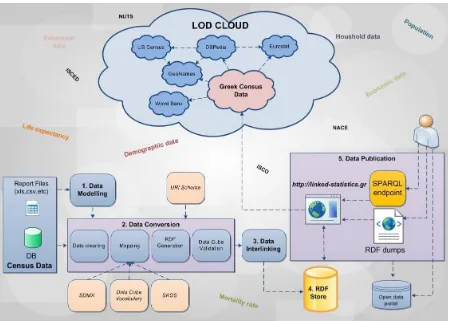
Our goal is to present a generic methodology describing the basic steps and overall model to publish statistical data coming from tabular data sources or relational databases as RDF Linked Open Data. The methodology builds on top of existing publishing tools, statistical vocabularies and LOD storage technologies to ease the process of publishing statistical data. It follows the Best Practices for Publishing Linked Data, a W3C Working Group Note, (Hyland, Atemezing, & Villazón-Terrazas, 2014), such as providing URI construction suggestions following URI policy rules, reuse of standard vocabularies, such as the Data Cube Vocabulary, SKOS, etc., converting data to RDF and providing access to the converted data. Figure 1 shows the overall model of the methodology. The methodology is mainly comprised of five steps.
1.1. Data Modelling
The first step involves identifying all the concepts within the dataset and modelling custom ontologies for all domain-specific concepts and indices, which are not defined by other sources. That involves extracting appropriate and useful datasets, either in CSV or .xls format from remote sites, analyzing the datasets and identifying the different concepts contained. Each concept is mapped with the corresponding concept of the multi-dimensional model, such as dimension, measure, code list, etc. The identification of common concepts that are already modeled from other sources can be referenced in this context. A typical example concerns the structure of administrative divisions in Greece: in the 2001 Census Survey the divisions were defined according to the “KAPODISTRIAS” Plan containing six hierarchy levels of divisions, whereas in 2011, restructuring according to “KALLIKRATIS”Plan resulted in eight levels. This example also reveals one of the problems discussed in Section 4, involving the changing nature of resources over time ,which needs to be addressed efficiently, maintaining the link between previous, current and future identical resources, as well as, tracking down the changed ones and how they changed (Petrou & Papastefanatos, 2014).
1.2. Data Conversion
The second step involves cleaning up the data, mapping of dataset’s concepts to the data cube elements, i.e., dimensions as qb:DimensionProperty, measures as qb:MeasureProperty or attributes as qb:AttributeProperty and furthermore to columns of the source file, the identification of the actual data (observations) as a set of qb:Observation instances, and all the dataset’s metadata. Concepts within the datasets may be mapped with existing concepts suggested and defined in the Content-Oriented Guidelines (COGs)8 by SDMX (BIS et al., 2005), which contains a set of cross-domain concepts and code lists providing compatibility and interoperability across agencies [Cyganiak et al., 2014]. The mappings are used to create the dataset’s structure, the dataset itself and the including observations, using the appropriate URI Scheme for each type of resource. A default URI minting scheme, which has been designed using URI policy rules, is an input to this step to easily map the instances of the Data Cube Vocabulary and the resources. The code lists that are used to give a value to any of the components are also defined using SKOS vocabulary. The data are then exported as RDF in an RDF compliant serialization, such as RDF/XML, and validated.
1.3. Data Interlinking
The different versions of codelists coming from the same resource are interlinked with each other using the appropriate linking property, eg skos:exactMatch for concepts. The transformed data are also linked with other resources. For example, indices are linked with datasets from the World Bank and economic activities, occupational and educational data are linked with Eurostat’s datasets via the NACE, ISCO and ISCED classifications, respectively (Petrou & Papastefanatos, 2014). Various existing tools to discover links between data coming from different Linked data sources, such as SILK Link Discovery Framework9 and RelFinder10 can then be used to enrich the data with meaningful links to external datasets or intra-dataset resources.
8
http://sdmx.org/?page_id=11
9
http://wifo5-03.informatik.uni-mannheim.de/bizer/silk/
10
1.4. Data Storage
The produced RDF data are uploaded, stored and maintained in a dedicated RDF store, such as OpenLink Virtuoso11 or Fuseki12.
1.5. Data Publication
According to the principles of Linked Data, the way to access Linked Data is via dereferencable URIs, which, when accessed, provide meaningful descriptions of the concept they represent in a variety of formats, and the data should be accessible to the public. Therefore, access to the data can be provided as RDF dumps or via SPARQL endpoints. Dereferencing of the data is achieved through the dedicated RDF store and all the data are accessible via a SPARQL endpoint service or through the faceted browsing facility, where users can search resources and navigate from one resource to another. Datasets may be further “announced” to the public, to be more discoverable, by publishing the data to international or national open data portals, such as geodata.gov.gr and data.gov.gr.
3.
Use Case Evaluation
To evaluate, improve and complete our methodology we focused on publishing census data collected during Greece’s 2011 Census Survey and provided by EL.STAT. (Petrou et al., 2013; Petrou & Papastefanatos, 2014).
Data modelling. Excel files were downloaded from the EL.STAT portal (Hellenic Statistical Authority, 2014). One sample dataset used is a dataset measuring “Resident population by sex and age groups”13
. The concepts identified are administrative divisions of Greece (consisted of three other concepts; level of the administrative division, geographical code and a description), sex, age, population and age groups. Then, the type of each concept and its mapping to the appropriate cube construct was defined as follows: geographical code, age and sex as dimensions, and the population as a measure. The age groups are the values used to define the age dimension (0-4, 5-9, etc.) They were identified as a controlled code list. Looking at the concepts of administrative division it was decided that further modelling was required, as each administrative division is comprised by three concepts, and hierarchy exists between each unit. Therefore, an administrative ontology was designed.
Table 1: Concepts and Vocabulary mapping
Prefixes
sdmx-dimension: <http://purl.org/linked-data/sdmx/2009/dimension#> sdmx-code : <http://purl.org/linked-data/sdmx/2009/code#>
codelist: <http://linked-statistics.gr/ontology/code/2011/> age: < http://linked-statistics.gr/ontology/code/2011/age/> measure: <http://linked-statistics.gr/ontology/measure/> skos: <http://www.w3.org/2004/02/skos/core#>
qb: <http://purl.org/linked-data/cube#>
11
http://virtuoso.openlinksw.com/download/
12
http://jena.apache.org/documentation/serving_data/index.html
13
Concept Vocabulary Mapping URI
Geographical code qb:DimensionProperty sdmx-dimension:refArea
Sex qb:DimensionProperty sdmx-dimension:sex
Sex code list Male
Female Total
skos:ConceptScheme skos:concept
skos:concept skos:concept
sdmx-code:sex sdmx-code:sex-M sdmx-code:sex-F sdmx-code:sex-T
Age qb:DimensionProperty sdmx-dimension:age
Age code list Age groups
skos:ConceptScheme skos:concept
codelist:age age:{age-group}
Population qb:MeasureProperty measure:population
Data conversion. Unnecessary information was removed from the input file; two columns were
removed (the level and description) as the geographical code was adequate to uniquely define the observations. The mapping between the concepts and the Data Cube Vocabulary and SDMX and the code lists with SKOS Vocabulary, and the URIs used are shown in Table 1. Given all the above modelling components (administrative ontology, dimensions, measures, code list) along with the original excel file and our URI minting scheme the dataset is converted to RDF and validated.
Data interlinking. The age groups were, then, linked with the corresponding age groups from
eurostat.linked-statistics.org. The interlinking was automatically performed based on the age group description and it was manually curated for cases that no or multiple mappings occurred.
Data Storage. For storing the extracted triples and the triples from the interlinking, we chose to use OpenLink Virtuoso, which is open source, and is responsible for dereferencing the data and has a built-in SPARQL endpoint service, as well as faceted browsing.
Data publication. Finally, machine access is provided as it is one of the best practices of publishing Linked Data. The datasets converted can be accessed at http://linked-statistics.gr in three ways: (a) download the data as RDF dumps for local processing, (b) query and browse the data using the SPARQL endpoint service and SPARQL query form, and (c) link to the data by referencing to their unique identifier (URI).
4.
Lessons Learned
In the implementation of the methodology, several technical and modelling issues may arise, increasing the complexity of the publishing process. We present below the most important aspects and discuss our insights based on our experience.
• Code List Identification and Reuse. In many cases when converting a dataset from a file retrieved on the web, there is only a partial knowledge of all possible values and hierarchies comprising the code lists referenced in the dataset. This is due to the fact that the dimensions are identified and converted on the fly based on the source file. In addition, different values may refer to the same dimension value across different files, due to abbreviation reasons, errors in the production of the source files, etc. For example, one dataset may refer to individual ages ranging from 20-40 and a second dataset may refer to ages from 20-60. Before designing or versioning of a new code list, it is necessary to check if a code list already exists and can be enriched with new values rather than create a new one.
• Conversion: Automatic conversion of datasets may be problematic as there is lack of uniformity in the structure of the input source files. The structural heterogeneity of the tables within the input files makes it harder to cover all the possible formats available. Headers may be repeated within the datasets. Other similar problems of tabular data are mentioned in Ermilov et al., 2013. Moreover, components, and specifically dimensions, may be nested in one another, increasing the complexity of recognizing the individual values of each dimension. This is challenging to overcome in an automatic way without any user supervision.
• Data Interlinking: Regarding the interlinking of multidimensional data with other sources, there is a great need for creating links between observations from different datasets (especially those that come from different sites) and not only links between individual code lists or code list values. This enables merging and combining measurements coming from different sources. However, linking of individual statistical measurements may be very difficult to achieve for datasets that are specific enough, i.e. they have a large number of dimensions whose values are broken down in low level details. For example, in the case of Census data, most national statistical datasets are bound to the reference area, which follow different administrative divisions across each country and are broken down in different hierarchy details (e.g. neighbourhood). Individual observations can only be interlinked on the country level or on a commonly agreed area code list (e.g. NUTS II). This makes a large number of produced LOD statistics unexploited and reduces the available individual observations that can be interlinked across national statistical agencies. A possible solution would be the loose interlinking of observations based on similarity measures rather than exact matches, e.g. they may share the same schema (i.e. dimensions, measures, attributes) but refer to different code lists or hierarchy levels, and so on.
5.
Conclusions and Future Work
References
Auer, S., Bühmann, L., Dirschl, C., Erling, O., Hausenblas, M., Isele, R., … & Williams, H. (2012). Managing the life-cycle of linked data with the LOD2 stack. In The Semantic Web–ISWC 2012 (pp. 1-16). Springer Berlin Heidelberg.
Cyganiak, R., Reynolds, D., Tennison, J. (2014). The RDF Data Cube Vocabulary. World Wide Web Consortium. Retrieved June 04, 2014 from http://www.w3.org/TR/vocab-data-cube/
Ermilov, I., Auer, S., & Stadler, C. (2013). User-driven semantic mapping of tabular data. In Proceedings of the 9th International Conference on Semantic Systems (pp. 105-112). ACM.
Eurostat, European Commission (2011). Statistics for policymaking: Europe 2020. Brussels. Retrieved June 10, 2014 from http://epp.eurostat.ec.europa.eu/portal/page/portal/statistics_policymaking_europe_2020/documents/All.pdf
Galiotou, E. & Fragkou, P. (2013). Applying Linked Data Technologies to Greek Open Government Data: A Case Study. Procedia-Social and Behavioral Sciences, 73, 479-486.
Hausenblas, M., Ayers, D., Feigenbaum, L., Heath, T., Halb, W., & Raimond, Y. (2012). The Statistical Core Vocabulary (SCOVO). Retrieved from http://vocab.deri.ie/scovo
Hellenic Statistical Authority (2014). Retrieved from http://www.statistics.gr/portal/page/portal/ESYE/PAGE-cencus2011tables
Hyland, B., Atemezing, G. & Villazón-Terrazas, B., (2014). Best practices for publishing linked data. World Wide Web Consortium. Retrieved from http://www.w3.org/TR/2014/NOTE-ld-bp-20140109/
Hyland, B., and Wood D. (2011). The Joy of Data – Cookbook for Publishing Linked Government Data. In Linking Government Data(pp. 3-26). Springer New York.
Lebo, T., Erickson, J. S., Ding, L., Graves, A., Williams, G. T., DiFranzo, D., … & Hendler, J. (2011). Producing and using linked open government data in the twc logd portal. In Linking Government Data (pp. 51-72). Springer New York. Petrou, I., & Papastefanatos, G. (2014). Publishing Greek Census Data as Linked Open Data. ERCIM News96. Retrieved
June 10, 2014 from http://ercim-news.ercim.eu/en96/special/publishing-greek-census-data-as-linked-open-data Petrou, I., Papastefanatos, G., & Dalamagas, T. (2013, June). Publishing census as linked open data: a case study.
In Proceedings of the 2nd International Workshop on Open Data (p. 4). ACM.
Salas, P. E. R., Martin, M., Mota, F. M. D., Auer, S., Breitman, K., & Casanova, M. A. (2012). Publishing statistical data on the web. In Semantic Computing (ICSC), 2012 IEEE Sixth International Conference on (pp. 285-292). IEEE.
BIS, ECB, Eurostat, IMF, OECD, UN & World Bank (2005). SDMX–Statistical Data and Metadata Exchange. Retrieved from http://sdmx.org/
Vafopoulos, M., Meimaris, M., Anagnostopoulos, I., Papantoniou, A., Xidias, I., Alexiou, G., … & Loumos, V., (2013). Public spending as LOD: the case of Greece. Available at SSRN: http://dx.doi.org/10.2139/ssrn.2233998
Villazón-Terrazas, B., Vilches-Blázquez, L. M., Corcho, O. & Gómez-Pérez, A. (2011). Methodological guidelines for publishing government linked data. In Linking Government Data (pp. 27-49). Springer New York.
About the Authors
Irene Petrou is a research associate at the Institute for the Management of Information Systems (IMIS) of the ATHENA Research Center. She received her BSc degree in Computer Science from the University of Cyprus and holds an MSc degree in Human Resource Management from the University of Birmingham. She joined ATHENA Research Center in January 2013. Her research interests lie in the area of manipulating multidimensional statistical data using semantic technologies, concentrating on methodologies and best practices for converting and publishing multi-dimensional statistical data as Linked Open Data. She is involved in the linked-statistics.gr project for publishing, exploring and visualizing statistical governmental data as LOD.
Marios Meimaris received his Diploma in Electrical and Computer Engineering from the National Technical University of Athens. He holds an MSc in Artificial Intelligence from the University of Edinburgh and a joint MBA degree from NTUA and the University of Piraeus. He is an associate researcher at the Institute for the Management of Information Systems (IMIS) of the ATHENA Research Center. His research interests lie in the area of data management and semantic technologies. He is the core engineer of the publicspending.net project concerned with publishing public expenditure data as linked data, and is involved in the linked-statistics.gr project for publishing, exploring and visualizing statistical governmental data as LOD. Marios has served as invited expert in W3C's Government Linked Data working group.