Published online February 20, 2014 (http://www.sciencepublishinggroup.com/j/ajep) doi: 10.11648/j.ajep.20130206.21
Three-dimensional multi-physics CFD simulations of sand
transfer around a cube
Kazuto Matsui
1, Masaya Suzuki
2, Makoto Yamamoto
31
Graduate School of Mechanical Engineering, Tokyo University of Science, Tokyo, Japan 2
Aviation Program Group, Japan Aerospace Exploration Agency (JAXA), Tokyo, Japan 3
Department of Mechanical Engineering, Tokyo University of Science, Tokyo, Japan
Email address:
[email protected] (M. Suzuki), [email protected] (M. Yamamoto)
To cite this article:
Kazuto Matsui, Masaya Suzuki, Makoto Yamamoto. Three-Dimensional Multi-Physics CFD Simulations of Sand Transfer around a Cube.
American Journal of Environmental Protection. Vol. 2, No. 6, 2013, pp. 188-193. doi: 10.11648/j.ajep.20130206.21
Abstract:
Recently, concerns on environmental problem of the earth are rapidly growing on. One of the typical issues is desertification. To stop or suppress the harmful effects of desertification, the prediction method which can clarify the mechanism of desertification is required. For the purpose it is expected that numerical simulations are very useful. A number of research papers on sand transfer have been published in the literatures. However, they assumed that the sand particle trajectory is parabolic. This assumption would over-simplify the physics. Our final goals are to construct the multi-physics simulation technique which can correctly reproduce sand transfer, and, by applying it, to develop an effective prevention method for desertification. The purpose in the present study is to investigate the effect of particle trajectory computation. Simulating three-dimensional sand transfer around a cube, and comparing the numerical results with the experiments, we confirmed that our method can reasonably predict sand transfer around a cube, and the pressure gradient force should be taken into account in the particle trajectory computation.Keywords:
Desertification, Sand Transfer, Cube, Multi-Physics Simulation, Particle Trajectory1. Introduction
In recent years, the various environmental problems of the earth are rapidly growing on. One of the typical issues is desertification. Desertification causes decline of agricultural productivity, disappearance of road and town, and so on. To stop or suppress the progress of desertification, a lot of prevention activities have been applied such as tree/grass plantation and wind-breaking-fence arrangement. However, desertification does not stop and is expanding by 10-20 percent of the arid region every year, according to the Millennium Ecosystem Assessment. The main process of desertification is sand transfer. Therefore, the researches on the method to predict and suppress sand transfer blown by wind are needed against desertification. In the past, this kind of researches has mainly been performed with experimental methods, especially field measurements. On the other hand, theoretical studies which satisfy experimental observations are not sufficient (e.g. effect of tree plantation). Therefore, it is thought that more holistic knowledge or understandings about sand transfer would help us to create an effective prevention method for desertification. For this purpose, a
wide variety of experiments and established prediction methods will be required. One of the useful prediction methods for sand transfer is Computational Fluid Dynamics (i.e. CFD). Advantages of CFD are that it is easy to apply at various conditions and at reasonable cost to perform simulations as compared with experiments. In our final purpose, employing an engineering approach with multi-physics CFD, we would like to look for an effective prevention method for desertification.
Our final goals are to establish the multi-physics simulation technique which can correctly reproduce sand transfer phenomena, and, by applying it, to develop an effective prevention method for desertification. The purpose in the present study is to investigate the effect of particle trajectory computation. We simulate sand transfer around a cube. Turbulent flow field, sand particle trajectory and temporal change of sand surface are iteratively computed with an incompressible RANS technique. Comparing the numerical results with the experiments measured by Tominaga [4], we confirm that the present method can quantitatively predict the sand transfer phenomena, especially the temporal change of sand surface geometry, and the pressure gradient term in particle trajectory computations is very important.
2. Numerical Procedures
2.1. Basic Assumptions
The number of sand particles in a desert is infinite. If all sand particles are traced, we must spend a huge amount of time for simulations. Thus, in the present study sand particles are treated as a lump (so-called parcel). In each grid point, mass and direction of sand transfer are estimated from the flow field. Since the sand transfer needs a long period and the time scale is much longer than that of the flow field, steady flow field is assumed for sand surface geometry. That is, sand transfer depends on the flow field in a quasi-steady state. The flow field is turbulent. Although we can use Large Eddy Simulation (so-called LES) or Reynolds-Averaged Navier-Stokes Simulation (RANS), considering the short computing time, RANS is employed in the present study.
Based on these assumptions and using a weak-coupling strategy, we employ the computational procedures for sand transfer as follows:
(1) Simulate turbulent air flow field (2) Simulate sand transfer
(3) Simulate sand surface geometry (4) Change computational grid (5) Return to (1)
These procedures are iteratively repeated, until the computational time reaches the prescribed terminal time.
2.2. Turbulent Flow Computation
We assume that the flow field is incompressible and fully turbulent, and sand particles have no influence on the flow field because of the low concentration of sand in the air. The governing equations are Reynolds-averaged continuity and Navier-Stokes equations (i.e. RANS), as described above. The governing equations are expressed by
0 = ∂ ∂ i i x U (1) − ∂ ∂ + ∂ ∂ ∂ ∂ ∂ ∂ + ∂ ∂ −
= i j
i j j i i i i i
i uu
x U x U v x x U x P Dt DU ρ 1 (2)
where Ui is the mean velocity component in xi direction, t is time, ρ is air density, P is pressure, ν is kinetic viscosity and
j i
u
u
is Reynolds stresses. Reynolds stresses are expressed as follow ∂ ∂ + ∂ ∂ − = i j j i t ij j i x U x U v k u u δ 3 2 (3)where δij is Kronecker delta and νt is eddy kinetic viscosity coefficient.
We adopt RNG k-ε turbulence model proposed by Yakhot and Orszag [5] to predict Reynolds stresses. Then, the turbulence model equations are expressed as follows
ε
− + =Dk Pk
Dt Dk (4)
(
ε
)
ε
ε
ε εε C1P C 2
k D Dt D k − +
= (5)
ε
µ
2
k
C
v
t=
(6)where k is turbulent kinetic energy, ε is its dissipation rate, Cµ is model constant and has the value of 0.085, Pk is production term, Dk and Dε are diffusion terms, as follows
( )
2
1 1 1 3
1 2 , 1 0.228 1.42 , 1 0.015 1 , 2 2 j i k t j i t t k
j j j k j
R R
j i
ij ij ij
j i U U
P v
x x
v v k
D v D v
x x x x
C C C
U
U k
S S S
x x ε ε ε ε σ σ η η η η ε ∂ ∂ = + ∂ ∂ ∂ ∂ ∂ ∂ = + = + ∂ ∂ ∂ ∂ − = − = + ∂ ∂ = + = ∂ ∂ (7)
where model constants σk, σε and Cε2 are 0.7179, 0.7179, and 1.92, respectively.
These governing equations are solved by using the MAC method.
2.3. Sand Transfer Computation
surface creep is generated by saltation. Bagnold found that saltation is dominant in sand transfer. Therefore, in the present study, we assume that sand particles are transferred only by saltation.
Bagnold proposed the equation which expresses the relation between the sand transfer and the friction velocity as follow
3 *
d
q C u
D g
ρ
= (8)
where q is mass transfer of sand, d is mean particle diameter, D is reference particle diameter which is equal to 0.25 (mm), ρ is air density, g is gravitational acceleration, u* is friction velocity, and C is a constant that ranges from 1.5 to 2.8 depending upon the distribution of sand particles being transferred. It should be noted that C has the value of 1.5 for uniform sand particles. The friction velocity is calculated by the following log law
* 0
1 ln z
u z
u κ z
=
(9)
where uz is mean wind velocity over vertical height z from sand surface, κ is Karman constant which has 0.4 and z0 is roughness length scale.
Equation (8) has been modified by a lot of experiments. Kawamura [2] proposed a model with an idea to describe the threshold friction velocity
(
)(
)
2* *t * *t
q C u u u u g
ρ
= − + (10)
where u*t is threshold friction velocity. It means the minimum velocity that is able to move sand particles. And C is a model constant. He suggested that C is 2.78. In the present study, we use Kawamura’s equation (10) to estimate sand mass transfer.
Sand particles dash out from a point of sand surface, draw an arc, and collide with another point of the sand surface. Yuasa et al. [3] assumed the particle trajectory as a parabola in the simulations. Under this assumption, saltation length and height are given as follows
2 2 * , * s s u u L H g g α β
= = (11)
where α and β are constants of 7.2 and 0.5, respectively. However, apparently, this assumption would over-simplify the physics of sand transfer.
In the present study, the particle-phase is treated by the Lagrangian approach, in which each particle is tracked over time along their trajectories in the flow field. We assume that the particles are spherical and non-rotating. As mentioned above, particle-particle collisions and the interaction with the flow field from the particle-phase are negligible because the solid loading is sufficiently small. In addition, Basset history force is ignored because the free-stream velocity is high (approximately 10 m/s).Under
these assumptions, the equations of particle motion are as follows , , p i p i dx u
dt = (12)
,
, , , ,
p i
D i G i P i M i
du
F F F F
dt = + + + (13)
where ∂ ∂ + −
= 2 2 2
, 2 , 24 1 18 j i p i i p p p i D x u D u u D F ρ µφ (14) i p i
G g n
F ⋅
− = 1 ρρ
, (15)
i j i j i p i P x u u t u
F
∂ ∂ + ∂ ∂ = ρρ
, (16)
i j i p i i p p i M x u D Dt Du dt du
F
∂ ∂ − − −
= , 2 2 2
,
40 1 2
1
ρρ (17)
In these equations, subscript p denotes particle; FD,i, FG,i, FP,i and FM,i are drag force and gravitational force, pressure gradient force and added mass force respectively. The fluid velocity used for calculating the drag force is the time-averaged velocity obtained by RANS (see Section 2.2). The changes of sand surface geometry are simulated by
s
dh dQ
dt dz
ρ = − (18)
where ρs is density of sand, h is the normal distance from the base plane, Q is source/sink of sand mass transfer and z is specified length scale. In the present study, z is treated as the first grid point length from the sand surface.
Additionally, it is well known that there is sand mass transfer so-called avalanche. When the slope of sand surface becomes locally larger than the repose angle, avalanche arises, and mass of sand propagates downward so as to keep the repose angle. Generally it occurs when the slope angle is more than 32-35 (degrees). In this study, if the slope of sand exceeds the repose angle of 35 (degrees), the height of sand at the grid point is artificially changed so as to keep the repose angle and also satisfy the mass conservation of the sand.
3. Computational Conditions
number of the flow field is 161×77×56. Sand layer whose initial thickness is 0.03(m) evenly covers on the ground surface. If sand height is less than or equal to zero, sand mass transfer does not occur and the ground surface is not eroded. This limitation is same as that in the experiment. The cube is mounted on the ground surface. At the beginning, a part of the cube (i.e. 0.03(m) from the ground surface) is buried in the sand layer.
The following boundary conditions are applied. At the inflow boundary, inflow velocity, turbulent kinetic energy and its dissipation rate are fixed. In addition, pressure is extrapolated from the computational region and the velocity profile is assumed to be the one-fourth power law according to the experiment. At the outflow boundary, the velocity in the free stream direction and other variables are extrapolated from the computational region. On the sand surface, the cube surface and the wall boundary, no-slip condition is applied for the velocity, and the pressure is extrapolated from the computational domain. The turbulent kinetic energy and its dissipation rate are estimated by using the wall function. At the upper and symmetry boundaries, slip condition is imposed, and thus there is no in/out-flow across these boundaries. For other variables same conditions for the outflow boundary are used.
It should be noted that there is no sand supply from the inflow boundary, and sand transfer whose saltation length goes over the outflow boundary is not taken into account. This means that the total mass of sand particles monotonically decreases through the computation. In addition, if a saltation particle hits against the cube surface, we assume that elastic collision occurs.
Fig 1. Schematic of computational domain
Table 1. Computational conditions
Length 3.0 [m]
Width 0.9 [m]
Height 0.9 [m]
Cube height 0.2 [m]
Initial sand height 0.03 [m]
Free stream velocity 12.0 [m/s]
Grid number 7×10⁵ [-]
Fig 2. Computational grid (161×77×56)
4. Numerical Results and Discussion
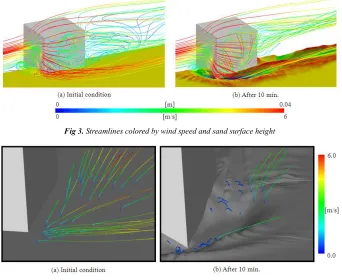
Figure 3 shows the streamlines around a cube at t=0 and t=10(min.), colored by wind speed. At the initial state (i.e. t=0), it is apparent that a lot of vortices are generated because of the influence of the cube. We can find a strong horseshoe vortex in the windward and lateral sides of the cube. And two vortices exist on the side surface. In the back of the cube, a large recirculation region can be observed. It is not clear, but we can confirm a small separation region on the roof of cube. Obviously, these vortices influence the velocity profile around the cube, and thus the local friction velocity changes drastically. We can easily expect that, since large velocity generally leads to high friction velocity, severe aeolian erosion occurs around the high speed region. On the windward region of the cube, the horseshoe vortex makes large velocity near the sand surface, and enhances active sand transfer in the upstream direction. Therefore, aeolian erosion can be found in the windward side of the cube. Moreover, the flow velocity rapidly increases in the vicinity of the windward corner. As the result, sand transport is promoted in the vicinity of the windward corner, and aeolian erosion is intensely generated there. Comparing these results, at 10 (min.), the sand surface drastically changes (see Fig.3(b)). The most remarkable difference is the vortex on the side of the cube. We can find that one strong vortex whose axis aligned to the cattycorner direction is formed. Moreover, the horseshoe vortex is captured within the eroded groove, and the recirculation region in the back of the cube is decreased.
Fig 3. Streamlines colored by wind speed and sand surface height
Fig 4. Particle trajectories by Lagrangian approach around windward corner of cubic (birds-eye view)
Fig 5. Temporal change of sand surface geometry (birds-eye view)
Figure 5 shows the temporal change of sand surface around the cube after five and ten minutes. Color denotes the height of sand surface from the ground level. It is clear that the strongest sand transfer takes place around the windward corner of the cube, and the second strongest sand transfer does behind the cube. The former comes from the horseshoe vortex, and the latter is caused from the separation vortex in the back of the cube. On the other hand, the sand transfer by saltation makes some crests around the cube, especially behind the cube and the windward region of the horseshoe vortex. Roughly speaking, the erosion pattern does not depend on time. We confirmed that these results are in reasonable agreement with the experimental data conducted by Tominaga [4].
Fig.6 shows the heights of the sand surface in the symmetry plane and in the central cross section on the lateral side of the cube, respectively. The present results are compared with the experimental data by Tominaga [4] and also the computational results by Yuasa et al. [3]. In the figures, blue symbols and lines correspond to the results at 5 minutes, and red ones correspond to those at 10 minutes. In addition, solid lines are for the case with considering all forces in Eq.(13), and broken lines are for the case with neglecting the pressure gradient force FP and added mass force FM. The latter case is same as that of Yuasa et al. [3]. Globally, the present results reasonably agree with the experimental data. However, in the windward cross section, our method (i.e. all forces are taken into account) overestimates sand transfer and thus the erosion depth. Probably, this is because the threshold value of friction velocity in our model is lower than the experimental condition. Therefore, in order to obtain more realistic results, we have to improve the physical model, by properly estimating the mass of sand transfer (i.e. Eq.(10)) and the threshold friction velocity. In addition, comparing the cases with and without pressure gradient and added mass forces, it is obvious that in the windward cross section (i.e. low speed region) pressure gradient and added mass forces produce a remarkable difference. As not shown here, we found that pressure gradient force is much larger than added mass force. Thus, we have to introduce pressure gradient force in sand transfer modeling, especially for low speed regions.
Finally, we should point out that turbulence model may affect the results. This point has to be investigated in future.
5. Concluding Remarks
We carried out the three-dimensional and multi-physics CFD computations for the sand transfer around a cube. Through the present study, we obtained following remarks.
(1) Aeolian erosion around the cube is reasonably predicted by the present method.
(2) Aeolian erosion is severe around the windward cornerof the cube and in the back of the cube. These are caused from the vortex formation of the flow field.
(3) Sand accumulation is observed in the windward of the horseshoe vortex and behind the cube. Saltation particles make remarkable crests.
(4) The erosion depth in the symmetry plane maches with the experiment.
(5) Pressure gradient force should be introduced in sand transfer modeling, especially in low speed regions. (6) It is necessary to modify our models for sand transfer
and the method to estimate the threshold friction velocity, in order to obtain more accurate sand transfer estimation.
This research is still under development, and thus we have to do further works in sand transfer modeling and its multi-physics CFD simulation. We hope the present and future researches on sand transfer will suppress desertification in the world.
References
[1] R.A. Bagnold, The physics of blown sand and desert dune, Methuen, London, (1941), 265
[2] R. Kawamura, Study on sand movement by wind, The institute of science and technology, Transactions of University of Tokyo, 5, (1951), 95-112
[3] T. Yuasa, M. Yamamoto and Y. Kawaguchi, Numerical simulation of sand transfer in desert. Proceedings of the 23rd Computational Fluid Dynamics Symposium, (2009), 1-6
[4] S. Tominaga, Chanel experiment and CFD analysis on erosion and bank of sand around object, Transactions of Niigata Institute of Technology, 11, (2007), 43-50