Published online February 28, 2015 (http://www.sciencepublishinggroup.com/j/sjams) doi: 10.11648/j.sjams.20150302.11
ISSN: 2376-9491 (Print); ISSN: 2376-9513 (Online)
Effects of Response Errors on Population Parameters in
Double Sampling for Stratification
David Anekeya Alilah
1, *, Robert Keli
2, Harun Makwata
2, James Kahiri
3, Leo O. Odongo
31
Departments mathematics and physical sciences, Maasai Mara University, Narok, Kenya 2
Departments of Mathematics, Masinde Muliro University of Science & Technology, Kakamega, Kenya 3
Departments of Statistics and Actuarial Sciences, Kenyatta University, Nairobi, Kenya
Email address:
[email protected] (D. A. Alilah), [email protected] (R. Keli), [email protected] (H. Makwata), [email protected] (J. Kahiri), [email protected] (L. O. Odongo)
To cite this article:
David Anekeya Alilah, Robert Keli, Harun Makwata, James Kahiri, Leo O. Odongo. Effects of Response Errors on Population Parameters in Double Sampling for Stratification. Science Journal of Applied Mathematics and Statistics. Vol. 3, No. 2, 2015, pp. 27-32.
doi: 10.11648/j.sjams.20150302.11
Abstract:
This study investigates the effects of response errors on population parameters obtained by double sampling for stratification at the interview and data processing level. Simulation study is carried out to investigate the effects of the response errors on these estimates. Finite population is generated using R-statistical package and study variables are investigated in the presence and absence of errors. The results obtained are compared. It is observed that, in the presence of response errors on the estimates results in underestimation of the population parameters.Keywords:
Response Errors, Double Sampling for Stratification, Error Proportion1. Introduction and Literature Review
The effect of errors in sample survey is of great concern to statisticians. Unlike the sampling errors, the size of non-sampling errors cannot be estimated directly. However most statisticians analyze their effects on data in terms of whether the error proportion is large or small and the diverse effects they have on the parameters estimated using sample survey.
In theory it has been assumed that to each unit Ui in a
population is attached a value Yi called the true value of a
unitY. It is also assumed that, whenever Ui is in the sample,
the value of Yreported is alwaysYi. However this not always
the case, there is error(s) attached to it.
The concept of measurement errors has since been of great concern to statisticians, especially in establishing the reasons why a source introduces errors and how to control and measure their effects, Kahiri (1995).
Many researchers have carried out studies on the effects of errors on statistical data. Most of these studies have employed the use of repeated measurement of sub - samples to estimate the total response variance, the relative sizes of the sample response variance and the correlated components.
Hansen et al (1953) developed theories on the additive measurement error models, while Fellergi (1964) investigated
the effects of response errors on the inter-penetrating sub- samples repetitions of 1961 Canadian census. He found out that by use of proxy interviewing, lowered not only the non response due to temporary absence but also due to refusal. Warner (1965) showed that by ingenious use of randomizing devise, it is possible to estimate the proportion of respondents
who belong to a certain class πA without the respondents
revealing their personal status with respect to the question. A study on the effects of non sampling errors on the quality of statistical data was done by Zarkovich (1965). He found out that, incorrect application of a sampling interval and applying the weights to a particular set of observations causes non- -sampling errors with respect to the sampling process. He also observed that the contribution of respondents’ error can be reduced by increasing the number of units in the sample. Horvitz, et al (1967) suggested the use of unrelated second questions if the second question was not sensitive and being unrelated to the first one. In their study,
The formula and conditions of the efficiency of double sampling design in terms of population parameters was fully investigated by JambuNathan (1957), while Singh et al (1965) worked on double sampling for stratification on the successive occasions.
(1979) and Espeland and Odoroff (1985). Chandhok (1988) studied three - stage (cluster) sampling under measurement errors and finds out that the usual estimates underestimates the variance in the presence of measurement errors. Udofia (2002) investigated the estimation for domains in double sampling for probabilities proportional to size and compared with the global estimators. He established that the variance of the estimate of population total depends on the component variance for the population. Gamrot(2006) estimated domains total under non response using double sampling.
In his study, Kahiri (2007) suggested how the errors from the respondents, interviewers and coders can be minimized. Cohen and Kang (2008) considered misclassification errors in stratification where errors occurred at frame stage. Jenkins, et al (2012) assessed the effect of increased measurement errors in panel survey reports of social security benefit receipt, drawing on unique validation study and how it varies following the questioning method used. They found out that the measurement errors appear to arise from interviewer transcription error rather than the respondent’s error.
Clement et al (2014) estimated domains in stratified sampling design in the presence of non response
In this paper, we investigate the effects of response errors on double sampling for stratification at the interview and data processing level.
This paper is organized as follows. In section 2, we carry out a review of some important concepts that will be useful in the development of this work. We model the response errors on double sampling for stratification in section 3. In section 4, a simulation study aims at investigating the effects of response errors on double sampling for stratification is presented. Summary and conclusions are given in section 5.
2. Stratified Random Sampling
Let a population of N units be divided into n/h non-
overlapping sub - populations (strata) of nh units such that
/
h h h
n =v n and from each, samples of sizes n n n1, 2, 3,...,nH
respectively are taken. If each stratum is homogeneous, an estimate of the stratum mean can be obtained from a small sample in that stratum that will eventually be combined into an estimate of the mean for the whole population.
2.1. Double Sampling for Stratification
Cochran (1977, pg 97), explains in details the concept of stratified sampling. Let a population of size N be stratified into H strata. The first sample is a simple random sample of
size /
n with h
h N W
N
= being the proportion of the population
falling in the th
h stratum while
/ / h h n w n
= is proportion of the
first sample falling in stratumh; where wh is the estimate of
h
W . In the first phase, we select a sample of size /
n from the
whole population, identify the units which belong to
particular strata and categorize them into strata
/ / / /
1, 2,..., h,..., H
n n n n such that
1 H h i n n =
′=
∑
′. In second phase, weselect nh units from
/
h
n such that
1 H h i n n =
=
∑
, the objective ofthe first sample is to estimate the strata weights and that of
the second sample is estimate the strata meansYˆh.
2.2. Estimated Population Mean in Double Sampling for Stratification
Cochran (1977), gives the estimate of population mean as
1
ˆ H
h h i
Y w y
=
=
∑
; where/ / h h n w n = and 1 1 h i n h h i h y y n = =
∑
The expectation of ˆY ;
1 2 1
ˆ
Hh h h
E Y
E E
w y
=
=
∑
/ 1 1 H h h hE
w y
=
=
∑
/ 1E
y
=
=Y ; where/ / / 1
1
h i n h h i hy
y
n
==
∑
and/ / / 1 1
1
h i n H h h iy
y
n
= ==
∑∑
(2.0)Hence ˆY is an unbiased estimator ofY .
The variance of ˆY ;
( )
1 2 1 2ˆ ˆ ˆ
V Y =V E Y +E V Y = 1 2
( )
1 2( )
ˆ ˆ
E V Y +V E Y
(2.1)
In estimating variance of ˆY , the problem is to choose / n
andnh such that we minimize
( )
ˆ
V Y for a given cost.
Therefore in presenting this theory we assume that nh are
random subsamples of nh/ . Thus
/
h h h
n =v n where 0<vh ≤1
and vh are chosen in advance.
Equation (2.1) can be decomposed into;
( )
( )
/ 2 /1 2 1 /
ˆ N n S
V E Y V y
N n − = = and
( )
21 2 1 2
1 1
ˆ
H H
h h h h
h h
E V w y E w V y
= = =
∑
∑
/ 2 2 1 / 1 Hh h h h
h h h
n n s
E w n n = − =
∑
(2.2)Suppose nh =v nh h/, 0<vh≤1,and is fixed then,
( )
/ / 22 1 / /
1
ˆ H h. h h. h
h h h
n n n s
V Y E
n n n = − =
∑
/ 21 / /
1 1 1 . H h h h h n s E v n n = = −
∑
(2.3)( )
// /
1
1
ˆ
h H h1
h
h h
s
s
N
n
V Y
W
N
n
=n
v
−
=
+
−
∑
(2.4)3. Response Errors in Double Sampling
for Stratification
Different interviewers will produce different distributions depending upon their skills, the interaction between themselves and the respondents. If two different units are interviewed by the same person, experience shows that the responses obtained cannot be uncorrelated. Hence, the interviewer’s personality affects the observation s/he makes. The fact that s/he has made a particular observation on one unit seems to affect his or her observations on the other unit. Therefore, we recognize the presence of correlations within
the interviewer’s assignments.
3.1. Mathematical Model for the Measurement of Response Errors
Let the interviewers be randomly assigned a fixed number
of units from
n
h sub sample in order to avoid interactionbetween interviewer bias and true values. We ignore the assumptions of the existence of correlations between the response obtained by one interviewer on one unit and that of another interviewer on another unit which may make the analysis of the data too complicated.
Let yhij =yhi +bhi+eij be the realized value; where yhithe
true is value for the th
i unit in the th
h stratum; bhiis the bias
on the th
i unit in the th
h stratum and eijis the random error.
The expectation of the realized value is given by:
/
ij ij i
m h m h h ij
E y j=E y +b +e =Uhi+bhi = Zhi, where Em yhij Uhi =
;Embhi=bhiand Emeij/ j=0 (3.1)
3.2. Double Sampling for Stratification in the Presence of Response Errors
The estimated population total in the absence of errors is
given by
1 1 h i n H h h h i
Y w y
= =
=
∑∑
while that in the presence of errors isgiven by 1 1 h i n H h h h i
Z w z
= =
=
∑∑
(3.2)Where zhiis the estimated value defined in equation (3.1).
Taking expectation of the population mean in the presence of errors, we have that;
( )
/
1 2 3 /
ˆ H h
h h
n
E y E y E E E y
n = = =
∑
= / / 1 2 / 31 1 h i n H h i h
h i h
y n
E E E
n n = =
∑∑
=( )
/ /1 2 / 1
1 H h h h n
E E z E z
n = =
∑
; Since / z = / / 1 1 h i n H h hh i h
z
n
n
n
= =∑∑
.Therefore 1
( )
/1 1 1 h i N H h h i
E Z Z z
N = =
= =
∑∑
; where Z is thepopulation mean.
The variance of the population mean in the presence errors is given by the expression;
( )
V y = V E E1 2 3
( )
y +E V E1 2 3( )
y +E E V1 2 3( )
y (3.3)which can successively be simplified by taking E1 ,E2
andE3for the first sample selection, sub-sampling and the
response error respectively.
The first term of (3.3) will simplify to
( )
( )
/1 2 3 1
V E E y =V z =
2 / / z S N n N n −
(3.4); where
(
)
2 1 1
1 h i N H h h i Z z Z S N = = − = −
∑∑
.The second term of (3.3) becomes:
( )
/1 2 3 1 2 /
1 H h h h n E V E y E V z
n
=
=
∑
= 1 2 1H h h h E V w z
=
∑
=( )
2 1 2 1 H h h hE w V z
=
∑
= 2 2 / / /1 / / /
1
z H
h h h h h
h h h h
s
n n n v
E
n n n v
= −
∑
=( )
( ) ( )
(
)
2/ / 2
1 / 2 / 2 1
. 1 z
H
h h h
h
h h h
n n s
E v v n n = −
∑
= 2 1 / 1 1 z H h h h h h s v E w v n = − ∑
= 2 2 / 1 1 z H h h h h h s v W v n = − ∑
(3.5); where(
)
2 2 1 1 h i z N h h i h h z z s N = − = −
∑
.Finally, we derive the third term of (3.3) as
( )
1 2 3
E E V y =
/
1 2 3 / 1 H h h h n E E V y
n =
∑
= /1 2 3 / 1 1 h i n H h h
h i h
y n E E V
n n = =
∑ ∑
=( )
(
)
2 /1 2 / 2 3
1 1
1
. cov ,
h h
i i j
n n
H H
h
h h h
h h i i j
n
E E V y y y
(
)
(
)
2 /
2 1 2 /
1
1
. 1
c H
h
h h h
h h
n
E E n
n
n δ δ
=
+ −
∑
.If δh2
2
1 h
i n
h i
h
n
δ
=
=
∑
and(
1)
(
1) ( )
1ij c
h i j
h h h
h h
n n
n n
δ
δ ≠
− = −
−
∑∑
then, E E V1 2 3
( )
y =/
1 2 3 / 1
H h
h h
n
E E V y
n =
∑
=/ 2 1 2 /
1
H h
h h h
n E E
n v δ =
∑
.If 0
ij
h hc
δ = =δ , then
( )
/1 2 3 1 2 3 / 1
H h
h h
n
E E V
y
E E V
y
n
=
=
∑
=/ 2 1 / /
1
H
h h
h h
n
E
n n v
δ
=
∑
=2 / 1
H h h
h h
W
n v
δ
=∑
(3.6)where
2
2 1 i
H h h h
h N
δ δ =
∑
=Therefore, the estimated variance in the presence of errors is given by;-
( )
/ 2/ 2/ /21 1
1
z
H H
h h h
z
h h
h h h h
s v
S N n
V y W W
N n n v n v
δ
= =
−
−
= + +
∑
∑
(3.7)4. Simulation Study
A simulation study was carried out to investigate the effects of the response errors on the survey estimates derived from the double sampling for stratification. R-package program was used to generate a finite population of size N=1000. The population was assumed to be normally distributed with mean 60, and variance 10. To each value, an
independently and identically normally distributed response error with mean 60, and variance 10 was introduced.
In the double sampling procedure, the first sample was
20% of the population, indicated asn/which was stratified
into four strata. We obtain a second sample which was a
random sub - sample of the first sample such that nh =v nh h/ ,
where vh are the strata weights which are uniformly
distributed with parameters 0 and1.
The process was repeated for different sample sizes, that is 30%, 40% and 50% of the sampled population. The estimates of the population mean and variance was obtained when response error was introduced with mean 10 and variance 4 denoted as error 1, and one of mean 5 and variance 2 denoted as error 2 respectively. The coefficient of variation (CV) for the estimates was calculated and the results were compared in the presence and absence of errors. The results were tabulated as below.
Table 1A. Sample size = 20% of population size used when error 1 is present and absent.
Parameter/ statistic Population parameter Population Estimate (statistic)
With Errors Without Errors With Errors Without Errors
Mean 69.79363 60.09449 69.93375 60.28806
Variance 0.002909272 0.002567404 0.0003467337 0.00005274092
Coefficient of Variation(CV) 0.07728164 0.08431648 0.0266263 0.001204599
Table 1B. Sample size = 20% of population size used when error 2 is present and absent.
Parameter/ statistic Population Population Estimate
With Errors Without Errors With Errors Without Errors
Mean 64.60424 59.39667 64.512111 59.27255
Variance 0.002788419 0.002760465 0.0001111318 0.0000381515
Coefficient of Variation(CV) 0.08173687 0.08845634 0.01634097 0.01042082
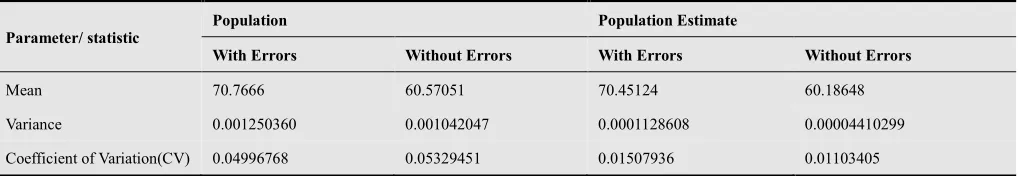
Table 2A. Sample size = 30% of population size used when error 1 is present and absent.
Parameter/ statistic
Population Population Estimate
With Errors Without Errors With Errors Without Errors
Mean 70.7666 60.57051 70.45124 60.18648
Variance 0.001250360 0.001042047 0.0001128608 0.00004410299
Table 2B. Sample size = 30% of population size used when error 2 is present and absent.
Parameter/ statistic Population Population Estimate
With Errors Without Errors With Errors Without Errors
Mean 64.0368 59.10587 63.48668 58.58736
Variance 0.001348674 0.0001333589 0.0001456733 0.0000574608
Coefficient of Variation(CV) 0.5702712 0.06213308 0.0190111 0.01293844
Table 3A. Sample size = 40% of population size used when error 1 is present and absent.
Parameter/ statistic Population Population Estimate
With Errors Without Errors With Errors Without Errors
Mean 70.91572 60.6374 71.16058 59.4131
Variance 0.0006006741 0.0005518777 0.0002848130 0.00003360116
Coefficient of variation(CV) 0.03456025 0.0387419 0.0749964 0.03018259
Table 3B. Sample size = 40% of population size used when error 2 is present and absent.
Parameter/ statistic Population Population Estimate
With Errors Without Errors With Errors Without Errors
Mean 64.29191 59.18542 63.73405 58.50604
Variance 0.0005916881 0.0005542588 0.000140054 0.0001356324
Coefficient of Variation(CV) 0.03783468 0.0397787 0.05891777 0.01990586
Table 4A. Sample size = 50% of population size used when error 1 is present and absent.
Parameter/ statistic Population Population Estimate
With Errors Without Errors With Errors Without Errors
Mean 71.41052 61.24435 71.73002 61.6146
Variance 0.0003994907 0.0003501903 0.0002457492 0.000183455
Coefficient of variation(CV) 0.0279824 0.03055526 0.03008674 0.01179710
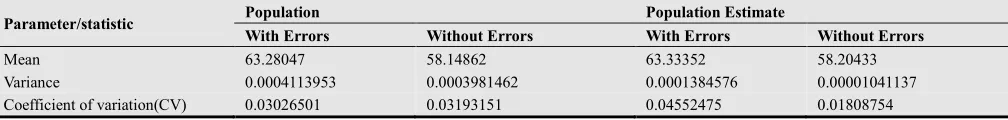
Table 4B. Sample size = 50% of population size used when error 2 is present and absent.
Parameter/statistic Population Population Estimate
With Errors Without Errors With Errors Without Errors
Mean 63.28047 58.14862 63.33352 58.20433
Variance 0.0004113953 0.0003981462 0.0001384576 0.00001041137
Coefficient of variation(CV) 0.03026501 0.03193151 0.04552475 0.01808754
From the above results, it’s observed that the presence of errors under - estimates the mean. Generally, the mean margin increases with the increase in the sample size while there is a general reduction in the error margin of the mean and variance when the sample is increased.
The sample variance is significantly reduced when the population is estimated by double sampling. This is due to stratification which reduces the variance, thus increasing the precision. The presence of errors increases the variance both for the population sample and the estimated population. Increase in the sample size generally reduces the variance.
The sample population has a higher Coefficient of variation (CV) than the population estimate. This implies that, the observations are more far apart from the mean than those of the estimates which we double sampled. As the number of observations increases, they tend to be closer to the centre of distribution which is the mean. It is also generally observed that the CV is small and hence the data can be said to be more consistent, that is, the values of the data are uniform from the arithmetic mean of the data.
5. Summary and Conclusion
This study has investigated the effects of response errors on the estimates derived from samples collected by double sample for stratification. The expression for double sampling for stratification in the presence of the response errors was derived and a simulation study was carried out to investigate the effects of the response errors on the population estimates for different sample sizes. The results were obtained for both true values and the reported (values with errors)
The results obtained showed that, presence of response errors should not be ignored since their presence in the data collected either underestimates or overestimates the final results. This confirms that proper methods of controlling errors should be enhanced at the data processing stage.
References
[2] Chen, T.T. (1979). Log Linear Models for Categorical Data with Misclassification and Double Sampling. Journal of the American Statistical Association, 74 (366), 481 - 488. [3] Clement E.P, Udofia G.A, Enang E.I(2014). Estimation for
domains in stratified sampling design in the presence of non-response, American journal of mathematics and Statistics, Vol 4. No.2, 2014, pp. 65-71.
[4] Cochran, W.G. (1977). Sampling Techniques. Third edition, John Wiley and Sons, New York.
[5] Cohen, S and Kang, K. (2008). Assessment of Misclassification Error in Stratification due to Incomplete Frame Information. Research Triangle Park, NC. 01- 34. [6] Espeland, M.A. and Odoroff, C. L. (1985). Log-Linear
Models for Double Sampled Categorical Data Fitted by the EM Algorithm. Journal of American Statistical Association, 80, 663-670.
[7] Fellergi, L(1964). Response Variance and its Estimation.
Journal of American Statistical Association, 59, 1016 – 1041. [8] Gamrot W.(2006). Estimation of a domain total under
non-response in double sampling. Statistics in Transition, 7(4), 831-840
[9] Hansen, M.H., Hurwitz W.N. and Madow W.G. (1953). Response Errors in Surveys Theory. Journal of American Statistical Association, 46, 147-190.
[10] Horvitz, D.G. and Wolter K.M. (1967). Total Survey Design: Advances in Health Survey, Research Methods. US Department of Health Education and Welfare Publication. No. (HRA) 77 – 3154.
[11] Jenkins, S.P., Lynn, P., Jackle, A. and Sala, E. (2012). The Impact of Questioning Method on Measurement Errors in Panel Survey Measures of Benefit Recipients; Evidence from a Validation Study. Journal of the Royal Statistical Society, Series A (Statistics in Society), 175, 289-308.
[12] Kahiri, J.K. (1995). Impact of Measurement Errors on Categorical Data, Unpublished PhD thesis, University of Southampton.
[13] Kahiri, J.K. (2007). Misclassification Errors from Respondents, Interviewers and Coders. EastAfrican journal of statistics, 1(3), 233-247.
[14] Singh, M.P. and Tessie, R. (1965). Method Test Panel (MTP) Phase III: Feasibility Test for Complete Non Proxy Procedures: Methodology and Analysis Statistics Canada.
[15] Udofia, G.A. (2002) Estimation for domains in double sampling for probabilities proportional to size. Sankhya, B64, 82-89
[16] Warner, S.L. (1965). Randomized Response: A Survey technique for Eliminating Evasive Answer Bias. Journal of American Statistical Association, 60, 63 – 69.
[17] Zarkovich, S .S. (1965). Sampling Methods for Censuses.