Published online July 20, 2013 (http://www.sciencepublishinggroup.com/j/ijnfs) doi: 10.11648/j.ijnfs.20130204.17
Formulation of low cost complementary baby food to
improve the nutritional status of the malnourished
children in Bangladesh
Md. Ariful Alam
1, Md. Tanvir Sarwar
1, Md. Hafizur Rahman
1, A. Y. K Masud Rana
2,
Shakh M. A Rouf
1, *1
Department of Applied Nutrition and Food Technology, Islamic University, Kushtia-7003, Bangladesh
2
Institute of Food and Radiation Biology, Atomic Energy Research Establishment, Savar, Dhaka, Bangladesh
Email address:
[email protected](Shakh M.A Rouf)
To cite this article:
Md. Ariful Alam, Md. Tanvir Sarwar, Md. Hafizur Rahman, A. Y. K Masud Rana, Shakh M. A Rouf. Formulation of Low Cost Complementary Baby Food to Improve the Nutritional Status of the Malnourished Children in Bangladesh. International Journal of Nutrition and Food Sciences. Vol. 2, No. 4, 2013, pp. 200-206. doi: 10.11648/j.ijnfs.20130204.17
Abstract:
In the present study we formulated a low cost complementary baby food and investigated its role to improve the nutritional status of the malnourished baby. One hundred gm of complementary baby food was prepared by blending of 40 gm cereal powder, 16 gm green gram powder, 14 gm sesame powder, 14 gm banana powder, 10 gm pumpkin powder and 6 gm sugar powder according to the proportion of balanced diet. The formulated complementary baby food contained 336.5 Kcal energy and 6.56% moisture, 1.76% crude fiber, 17.5% protein, 13.7% fat, 31.31% carbohydrate, 30.93% ash, 27.7 mg of vitamin C, 210 µg of vitamin E, 30.15 mg of iron, 45.32 mg of zinc, 470.3 mg of calcium, 73.6 mg of magnesium and 1100 µg β-carotene. Impact of formulated complementary food to improve nutritional status was observed by conducting a cross-sectional study on 27 suspected malnourished children living in low socioeconomic status. According to the anthropometric data 18 children were found to be malnourished. From the 18 children, 13 children were taken as Feeding Group and remaining 5 children taken as Control Group. We found that 30.76% children were severe malnourished, 46.15% children were moderate malnourished and 23.07% children were mild malnourished according to Gomez classification. Nutritional status of the feeding and control group was investigated during the three months study period. It was found that control group gradually lost their weight (wasting) during the study periods due to faulty feeding practices and lack of calorie intake. Percent weight loss (wasting) at the end of the study period for Control-1, Control-2, Control-3, Control-4 and Control-5 were 8.60%, 7.14%, 8.33%, 10.0%, and 9.25% respectively. While the newly formulated complementary baby food was provided 120gm/day for the severe malnourished children and 80gm/day for the mild to moderate malnourished children during the study period. It was found that the formulated complementary baby food can reverse muscle wasting and improving nutritional status of the malnourished children during the study period. Thus newly formulated complementary baby food was efficiently providing both calorie and other dietary essentials to the malnourished children.Keywords:
Malnutrition, Complementary Food, Breastfeeding, Child Nutritional Status1. Introduction
The World Health Organization (WHO) recommends exclusive breast feeding for the first six months of life, with the addition of complementary feeds at six months with continued breast feeds until the age of two[1,2]. Infants and young children are at an increased risk of malnutrition from
malnutrition in children less than 5 years of age [4]. According to the WHO, the complementary feeding should be timely, that is all infants should start receiving foods in addition to breast milk from 6 months onwards. The nutritional value of complementary food should fulfill the nutrient requirement of rapidly growing child and the food should be diverse with appropriate texture and given in sufficient quantity [5].
Among preventive measures that would reduce the high mortality rate for the children under the five years of age, includes exclusive breast feeding and good quality complementary feeding. With a calculated 600,000 child deaths per year preventable by good complementary feeding (6% of total child deaths) [6]. It has been suggested that in addition to the disease prevention strategies, complementary feeding intervention targeting this “critical window” is the most efficient measure in reducing malnutrition and promoting adequate growth and development of the children [7]. Complementary foods are often with low nutritional quality and given in insufficient amounts or too early or too frequently, thus displacing breastfeeding [8]. Improved complementary feeding and breastfeeding practices are essential to achieve the Millennium Development Goals (MDGs) for child survival and prevention of malnutrition [9]. Over 70% of dietary protein in developing countries is supplied by cereals that are relatively poor sources of protein [10]. Formulation and development of nutritious weaning foods from local and readily available raw materials has been received a lot of attention in many developing countries [11].
Childhood malnutrition is prevalent in low and middle income countries. According to an estimate, 20 % of children < 5 years of age in these countries were underweight (weight for age Z score < -2) in year 2005 [9]. Similarly, about 32 % of children < 5 years of age in these countries were stunted (height for age Z score < -2). The prevalence of both underweight and stunting was highest in Africa and South-Central Asia. Stunting and wasting (weight for height Z score < -2) along with intrauterine growth restriction are responsible for about 2.1 million deaths worldwide in children < 5 years of age. This comprises 21 % of all deaths in this age group worldwide [12]. It is well recognized that the period of 6-24 months of age is one of the most critical time periods in the growth of the infant. The incidence of stunting is the highest in this period as children have high demand for nutrients and there are limitations in the quality and quantity of available foods, especially after exclusive breastfeeding [13, 14].
2. Materials and Methods
2.1. Materials
The food stuffs such as corn (Zea mays), bengal gram (Cicer arietinum), sesame seed (Sesamum indicum), matured banana (Musa acuminate), pumpkin (Cucurbita maxima) and sugar - were purchased from local markets in
Thakurgaon, Bangladesh. Instruments such as HPLC from Agilent1200, G1316A, CULCOM. Muffle Furness (Gallen kamp) Model-S90, Atomic Absorption Spectrophotometer (SHIMADZU Corporation, AA-6200) were used for experimental process. All chemicals used were research grade and collected from world reputed companies.
2.2. Formulation of Complementary Baby Food
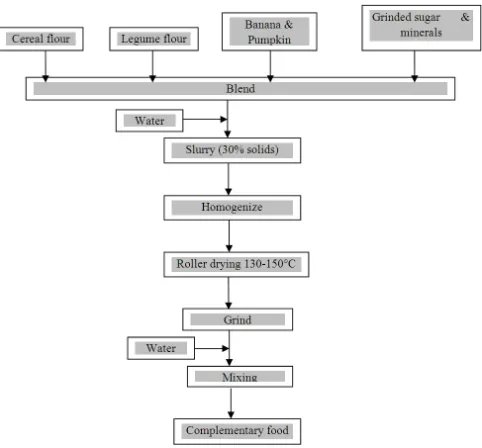
All the raw materials were collected from the local market. The maize was dehulled and the hulls separated. Whole maize was soaked in water (1:3 w/v) at 29°C for six hours and germinated in a sterilized woven cane basket lined with a sterilized moist jute sack for 72 hours. After germination, the grains were dried for eight hours in a solar drier (45-47°C). The vegetative parts were removed by rubbing the grains between the palms and winnowing. The dried malted grains were milled in an attrition mill and sieved to remove the hulls. Sesame seeds were soaked in distilled water for 10 minutes and dried at room temperature. The dry seeds were roasted in an oven for 10-15 minutes at 105°C. Then the roasted seeds were grinded in electric grinding machine for making fine powder. Green grams were steeped in water for 12 hr at room temperature. After 12hr water was removed from the container. The wet grams were allowed to germinate for the further 48 hr. The germinated legumes were roasted at 110±3°C in an electric oven for 20-25 minutes.
The bananas (without skin) were sliced in small pieces. Sliced banana were blended and dried in an oven at 105°C overnight. Dried portion were grinded for making fine powder. Surface of pumpkin was peeled mechanically. Then pumpkin was sliced for making large pieces. Pumpkin pieces were boiled in hot water by using small amount of salt and blended in a blender machine. Blended materials were dried at 70-80°C and then grinded to make fine powder.
All the processed cereal, legume and fruit materials were mixed with the proportion of balanced diet.
2.3. Nutrient Content Analysis
Fig 1. Flow chart of making process of complementary food
2.4. Nutritional Status Assessment of Children for Selecting Control and Complementary Feeding Group
2.4.1. Study design and Subjects Screening
A cross-sectional study was conducted among the children of both sexes between 1-2 years of age. Subjects were selected randomly living in “Tangon Asroyon procolpo and Ershad Nagar” slum of Thakurgaon district town in the northern of Bangladesh. From the 27 children, 18 were found to be malnourished. Among the 18 malnourished children, 13 subjects were included in the feeding group and remaining 5 as negative control group. Remaining subjects were found as normal by comparing the anthropometric data with the reference.
2.4.2. Questionnaire Design
A pre-tested questionnaire was developed to obtain relevant information regarding socio-demographic status such as age, family size, income, education, disease history, mental status, dietary pattern, housing etc of family of study subjects.
2.4.3. Nutritional Status Assessment
A complete physical examination of the study children were performed after interviewing mothers including the information on past and current childhood illnesses. Anthropometric measurements were performed by following standard. Weight for age (W/A) , height for age (H/A) and weight for height (W/H) of the subjects were calculated and compared with the National center for health statistics (NCHS) references [21]
2.5. Designing Selective Feeding and Premixing of Complementary Food
For the selective feeding appropriate amount of
powdered food stuffs were mixed to prepare final ready to serve complementary food based on the calorie requirement of the children. The final product was prepared by blending of the following amount of different food items.
Table 1. Preparation of final product
Food items Amount (gm)
Cereal powder 40
Green gram powder 16
Sesame powder 14
Banana powder 14
Pumpkin powder 10
Sugar powder 06
Total 100
2.5.1. Complementary Feeding of the Malnourished Children
Calorie intake of the children between 1-2 years of age is determined by the following formula-
60.9×weight (kg) – 54 [for male] 61.1×weight (kg) – 51 [for female] [22]
Based on the calorie requirements, complementary food were given to the selected malnourished children by the following categories.
Table 2. Feeding trial for 13 malnourished children
Malnourished Children
Amount to be given (Packet
per day)
Feeding per weeks
Duration of feeding (months)
Severe 120 6 3
Mild and
moderate 80 6 3
3. Results
3.1. Nutrient Content of the Complementary Food
Easily available and cheap food commodities were used for the formulation of complementary baby food. The proximate nutrient compositions of the formulated complementary baby estimated were shown in Table-3.
Table 3. Nutrient content of complementary food per 100 gm
Nutrients gm(%)/100gm Nutrients Content per 100 gm
Moisture 6.56 Vitamin C (mg) 27.7
Fiber 1.76 Vitamin E (µg) 210
Calorie (K cal) 336.92 Iron (mg) 30.15
Protein 17.5 Zinc (mg) 85.32
Fat 13.7 Calcium (mg) 470.3
Carbohydrate 31.31 β-carotene (µg) 1100
3.2. Nutritional Status of the Children under Investigation
For investigating the impact of formulated complementary food to improve nutritional status, a cross-sectional study on nutritional status assessment of 27 children suspected as malnourished living under low socioeconomic status was carried. According to the anthropometric data 18 children were found to be malnourished. From the 18 children 13 children were taken as Feeding Group and remaining 5 children taken as Control Group. The mean age (month), weight (kg), height (cm), and MUAC (cm) of feeding group were found to be 18.23 months, 8.03 kg, 74.75 cm and 13.26 respectively. Mean age (month), weight (kg) and height (cm) among the control group were found to be 17.2 months, 8.7 kg, 76.28 cm and MUAC 13.84 cm that summarize in Table-4.
Table 4. Mean anthropometric measurements of Feeding Group and
Control Group
Variables Feeding Group Control Group
Age(months) 18.23 17.23
Weight(kg) 8.03 8.6
Height(cm) 74.75 76.28
MUAC(cm) 13.26 13.84
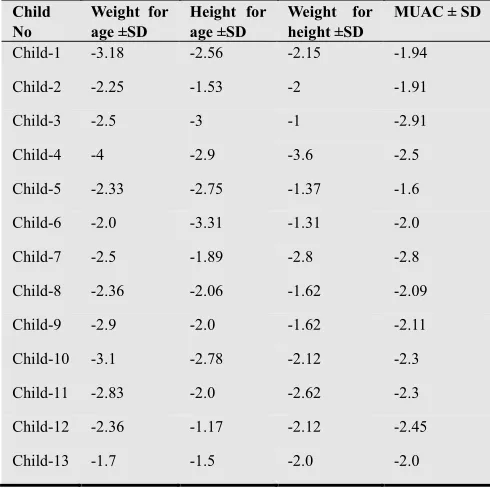
The anthropometric indices (standard deviation) of the 18 malnourished children were shown in the Table- 5.
Table 5. Standard deviation of anthropometric indices and MUAC of
Feeding Group
Child No
Weight for age ±SD
Height for age ±SD
Weight for height ±SD
MUAC ± SD
Child-1 -3.18 -2.56 -2.15 -1.94
Child-2 -2.25 -1.53 -2 -1.91
Child-3 -2.5 -3 -1 -2.91
Child-4 -4 -2.9 -3.6 -2.5
Child-5 -2.33 -2.75 -1.37 -1.6
Child-6 -2.0 -3.31 -1.31 -2.0
Child-7 -2.5 -1.89 -2.8 -2.8
Child-8 -2.36 -2.06 -1.62 -2.09
Child-9 -2.9 -2.0 -1.62 -2.11
Child-10 -3.1 -2.78 -2.12 -2.3
Child-11 -2.83 -2.0 -2.62 -2.3
Child-12 -2.36 -1.17 -2.12 -2.45
Child-13 -1.7 -1.5 -2.0 -2.0
≤ - 3 . 0 0 S D = Severe malnutrition
≤ - 2 . 9 9 t o - 2 . 0 0 S D = Moderate malnutrition ≤ - 1 . 9 9 t o - 1 . 0 0 S D = Mild malnutrition
Table 6. Standard deviation of anthropometric indices and MUAC of
Feeding Group
Child No Weight for age ±SD Height for age ±SD Weight for height ±SD MUAC±SD
Control-1 -2.2 -1.41 -3.3 -2.2
Control-2 -2 -1.24 -1.62 -2.2
Control-3 -1 -1.21 -2.2 -1.5
Control-4 -2.5 -1.96 -1.87 -2.0
Control-5 -2.9 -1.57 -2.25 -1.8
≤ - 3 . 0 0 S D = Severe malnutrition
≤ - 2 . 9 9 t o - 2 . 0 0 S D = Moderate malnutrition ≤ - 1 . 9 9 t o - 1 . 0 0 S D = Mild malnutrition
According to Gomez classification, 15.38% children were severe malnourished, 46.15% children were moderate malnourished and 38.46% children were mild malnourished among the feeding group children (Table-7).
Table 7. Distribution of malnourished children according to Gomez
classification
Type of children
No. of Severe malnutrition
No. of Moderate malnutrition
No. of Mild
malnutrition Total
Feeding 2(15.38%) 6(46.15%) 5(38.46%) 13(100)
Control - 3(60%) 2(40%) 5(100)
According to the anthropometric indices only 23.07% children were severe malnourished, 69.23% children were moderate malnourished and 7.69% children were mild malnourished depending on the weight for age indicator (Table-7).
Table 8. Distribution of malnourished children according to
anthropometric indices
Anthropome tric indices
No. of Severe malnutritio n
No. of Moderate malnutrition
No. of Mild malnutrition
Tota l
Weight for
age (W/A) 3(23.07%) 9(69.23%) 1(7.69%)
13(1 00) Height for
age (H/A) 2(15.38%) 7(53.84%) 4(30.76%)
Weight for
height (W/A) 1(7.69%) 7(53.84%) 5(38.46%)
3.3. Selective Feeding Trial
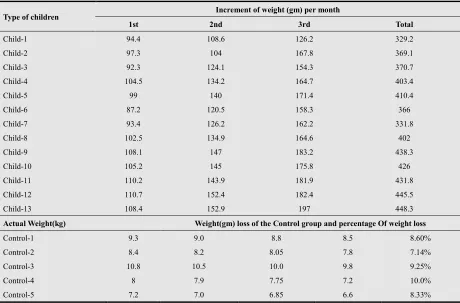
Table 9. Increments of weight (gm) per month of Feeding Group and weight loss per month of Control Group
Type of children Increment of weight (gm) per month
1st 2nd 3rd Total
Child-1 94.4 108.6 126.2 329.2
Child-2 97.3 104 167.8 369.1
Child-3 92.3 124.1 154.3 370.7
Child-4 104.5 134.2 164.7 403.4
Child-5 99 140 171.4 410.4
Child-6 87.2 120.5 158.3 366
Child-7 93.4 126.2 162.2 331.8
Child-8 102.5 134.9 164.6 402
Child-9 108.1 147 183.2 438.3
Child-10 105.2 145 175.8 426
Child-11 110.2 143.9 181.9 431.8
Child-12 110.7 152.4 182.4 445.5
Child-13 108.4 152.9 197 448.3
Actual Weight(kg) Weight(gm) loss of the Control group and percentage Of weight loss
Control-1 9.3 9.0 8.8 8.5 8.60%
Control-2 8.4 8.2 8.05 7.8 7.14%
Control-3 10.8 10.5 10.0 9.8 9.25%
Control-4 8 7.9 7.75 7.2 10.0%
Control-5 7.2 7.0 6.85 6.6 8.33%
4. Discussion
Average calorie intake for the boy and girl infants during the first year of life are 715 kcal and 660 kcal per day recommended by ICMR [23]. About 70% of this energy should be provided from the breast milk and 30% from complementary food for the infant age 6-8 months whereas 52%, 30% and 48%, 70% at 9-11 and 12-24 months of age subsequently [24]. In developing countries, human milk energy content ranges from 0.53 to 0.70kcal/g [2]. Lack of nutrient-dense complementary foods is one of the common factors accounting for decline in satisfactory growth pattern in children. An appropriate diet is critical in the growth and development of children especially in the first two years of life [25]. The present research was conducted to formulate such food that can provide sufficient calorie to the children and meet other dietary requirement. A low cost baby food was formulated from easily available sources. The energy content of the newly formulated complementary baby food was found 337 kcal/100gm adequate for energy requirement of infants when given excess to the breast feeding. The total protein content was increased as because the cereals were germinated and the digestibility might be increased of energy as reported earlier [4,5]. Although several others well known complementary baby foods are available but these are not affordable by the low income
people living in slum and village areas.
complementary baby food formulated from local and readily available raw materials is a constant challenge for developing countries.
5. Conclusion
Children of Bangladesh are the most vulnerable and affected by malnutrition. Inappropriate calorie intake and faulty/absence of complementary feeding after six month of age is the considered as one of the major factor for the child malnutrition. The present study was aimed to formulate low-cost and easily obtainable complementary baby food that can provide sufficient nutrients to the children in addition to the breast feeding for their proper growth and development. Hopefully providing of the newly formulated complementary baby food to the malnourished children revert the weight loss and support their proper growth. Thus, the present study shed light on prevention of child malnutrition by providing low-cost and easily obtainable complementary baby food in Bangladesh.
Acknowledgements
We are thankful to the technical members of the Dept. of Applied Nutrition and Food Technology and to the participant subjects in this study for their all cordial assistance.
References
[1] Aggarwal A, Verma S, Faridi MMA, Dayachand. “Complementary feeding reasons for inappropriateness in timing, quantity and consistency” (2008). Indian J Pediatr, 75:49-53.
[2] World Health Organization. Global strategy for infant and
young child feeding.Geneva,WHO
(2003).http://www.who.int/nutrition/publications/infant fee ding/infant feeding.
[3] World Health Organization. Complementary feeding - Report of the global consultation Summary of Guiding
principles Geneva (2001).
www.who.int/entity/nutrition/publications/infantfee ding/Complementary_Feeding.pdf.
[4] Saadeh B, Worldwide R, Daelmans. Global initiatives to improve complementary feeding. In SCN Newsletter: Meeting the challenge to improve complementary feeding (2003). United Nations System Standing Committee on Nutrition. Moreira,A.D. Ed. Lavenhem Press, UK pp.10-17. [5] WHO: Report of Informal Meeting to Review and Develop
Indicators for Complementary Feeding (2002). Washington, D.C.
[6] Jones G, Steketee RW, Black RE, Bhutta ZA, Morris SS. “How many child deaths can we prevent this year?” (2003). Lancet, 362(9377):65-71.
[7] Martorell R, Khan LK, Schroeder D. “Reversibility of stunting: epidemiological findings in children from developing countries” (1994). Eur J Clin Nutr, 48(Suppl
1):S45-57.
[8] Villapando S.“Feeding mode, infections, and anthropometric status in early childhood” (2000).Pediatrics, 106 (Supplement) pp. 1282- 1283.
[9] Lutter C. “Meeting the challenge to improve complementary feeding. In: Moreira AD, ed” (2003). UN Systems Standing Committee on Nutrition SCN News. Lavenhem Press, UK , pp. 4-10.
[10] Glover DV. “Improvement of protein quality in maize”, In: Wilke HL, ed” (1976).Improving the nutrient quality of cereals. Washington, DC: AID, , pp. 69-97.
[11] Plahar WA, Annan NT. “Development of balanced protein-energy weaning foods based on local legumes and cereals” (1994). Report submitted to the Association of African Universities by Food Research Institute. Accra, Ghana. [12] Black RE, Allen LH, Bhutta ZA, Caulfield LE, de Onis M,
Ezzati M, Mathers C,Rivera J “Maternal and child undernutrition: global and regional exposures and health consequences” (2008). Lancet, 371(9608):243-260.
[13] Shrimpton R, Victora CG, de Onis M, Lima RC, Blossner M, Clugston G. “Worldwide timing of growth faltering: implications for nutritional interventions” (2001). Pediatrics, 107(5):E75.
[14] Dewey KG, Adu-Afarwuah S. “Systematic review of the efficacy and effectiveness of complementary feeding interventions in developing countries” (2008). Matern Child Nutr, 4(Suppl 1):24-85.
[15] A.O.A.C. Official Methods of Analysis, 13th ed. (1980). Association of Official Analytical Chemists. Washington D.C, , 376-384.
[16] WRONO. “The use of persulphate in the estimation of nitrogen by Arnold Cunning modification of Kjeldahl method” (1923). J. Biol. Chem, 55: 427.
[17] Cocks LV and van Reda C. Laboratory Handbook for Oil and Fats Analysts (1966).Academic Press, London, 88 pp. [18] Thiers R. E. Methods of Biochemical Analysis (1957). New
York, Interscience, , Vol. 5 , pp. 274.
[19] Bessey, O.A, and King, C.G. “The distribution of vit-C in plant and animal tissues and its determination” (1933). J. Biol. Chem. 103: 68-73.
[20] Vogel AI, Vogel’s Text book of quantitative in organic analysis (1978). 4th Edition., Longman Group Limited. [21] Jelliffe, D.B., Jelliffe, E.F.P. Oxford (UK), Oxford Univ.
press (1989). Pp. 610.
[22] Gibson R.S, Ferguson E.L, Lehrfeld J. “ Energy requirements for infant in developing countries: their nutrient adequacy and improvement” (1998). Eur J Clin Nutr. 52(10):764-70.
[23] Lartey A, Manu A, Brown K.H, Peerson J.M, Dewey K.G, “A randomized, community-based trial of the effects of improved, centrally processed complementary foods on growth and micronutrient status of Ghanaian infants four 6 to 12 month of age” (1999). Am. J. Clin. Nutr, , 70(3): 391-404.
allowances for Indians A Report of the Expert Group of the Indian Council of Medical Research (2009). Jamai-Osmania PO, Hyderabad – 500 604.