Using Data Analytics To Extract Knowledge From
Middle-Of-Life Product Data
Fatima-Zahra Abou Eddahab, Imre Horváth
Delft University of Technology, Industrial Design Engineering, Landbergstraat 15, 2628 CE Delft, Netherlands,
Delft University of Technology, Industrial Design Engineering, Landbergstraat 15, 2628 CE Delft, Netherlands,
Abstract: Data analytics needs dedicated tools, which are getting complex. In this paper we summarize the results of our literature research done with special attention to existing and potential future tools. The attention is paid mainly to processing big data, rather than to effective semantic processing of middle-of-life data (MoLD). The issue of handling of big MoLD of specific characteristics efficiently has not yet been addressed by the commercialized tools and methods. Another major limitation of the current tools is that they are typically not capable to adapt themselves to designers‟ needs and to support knowledge/experience reusability in multiple design tasks. MoLD require quasi-real life handling due to their nature and direct feedback relationships to the operation process and the environment of products. Nowadays products are equipped with smart capabilities. This offers new opportunities for exploiting MoLD. The knowledge aggregated in this study will be used in the development of a toolbox, which (i) integrates various tools under a unified interface, (ii) implements various smart and semantics orientated functions, and (iii) facilitates data transformations in contexts by the practicing designers themselves.
Keywords:Data analytics, middle-of-life data, analytics tools, application practices, smart analytics toolbox.
1.
Introduction
1.1. Setting the stage
The rapid rise of emerging economies and deployment of information technologies have led to remarkable changes in the lifecycle of products and services. Because of the rapid development of hardware and software, focusing on exploration of data became ubiquitous [1]. Companies need to adjust their operations to the influences of the rapidly evolving markets and to better manage the lifecycle of their products. Towards this end goals, they have to combine (i) static process information with dynamic ones, (ii) product information with processes and resources information, and (iii) human aspect information with business information throughout the entire product lifecycle [2]. However, as reflected by the related literature, most of the past efforts were dedicated to the methodological and computational support of the begin-of-life and end-of-life models and activities. Less efforts were made to exploit middle-of-life data (MoLD) and to value/knowledge creation based on this kind of data. Thanks to new information technologies such as sensors, RFID and smart tags, the chunks of information conveyed by the middle-of-life (MoL) phase of product usage can now be identified, tracked and collected [3]. Our background research was stimulated by the observation that there seems to be a lack of tools to support decision-making in design and servicing using MoLD. This was placed into the position of a concrete research phenomenon to be studied [4]. The above decision was underpinned by the following argumentation. Effective statistical and semantic processing of MoLD is not only an academic challenge, but also a useful asset for the industry [5], since logistics, operation and maintenance activities are located in the MoL phase [6]. It is important for product developer and production companies to see how their products are used by different customers in different application contexts and under different
circumstances. This may provide insights for them concerning how to transform use patterns to specific product enhancements, and how to avoid deficiencies which may occur under circumstances that were not completely known or specified in the development phase of their products. MoLD can be obtained in multiple ways. They can be aggregated by field observations and interrogations of the users, or studying failure log files and maintenance reports, or from relevant web resources such as social media and user forums. Alternatively, they can be elicited directly from products by sensors or self-registrations. The last mentioned approaches are getting more popular as products advance from traditional self-standing products to network linked advanced products to awareness and reasoning enabled smart products [7]. However, due to the dynamic change of sensor data, the large volumes of data aggregated over time, and the unknown nature of data patterns, it is unfortunately not straightforward to perform effective data analysis using the existing traditional techniques [8]. Feeding structured MoLD and use patterns back to product designers is an insufficiently addressed issue [9]. The key challenge is to find ways to effectively use data analytics techniques in purposeful combinations, depending on the application contexts and the specific objectives of product designers [10].
1.2. Reasoning model and contents
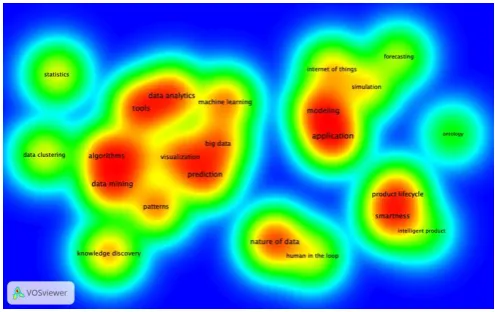
outcome of the keyword-based mapping of the related
literature. The graphical image was built using VOSviewer based on the concerned articles. Figure 1 shows not only the neighboring (semantically related) keywords, but also the distances between them as they appear in the literature. The different colors indicate the frequency of the occurrence of keywords (i.e. the formation of peaks). The most frequently occurring keywords are shown in red (and dark orange) and the less frequent ones are shown in green (and light blue). The visual representation generated by the software application let us see that actually four major clusters of papers could be identified. In a kind of transitive ordering, these are: (i) changes in the nature of data, (ii) approaches of transformation of data, (iii) tools and packages for data analytics, and (iv) design applications of data analytics. These were used as descriptors of the main domains of interest in the detailed literature study, in addition to the key phrase „evolution of data analytics support of product design‟. Called „deep exploration‟, in the second phase of our study, various sources such as subscription-based and open access journals, conference proceedings, web-repositories, and professional publications were used for collecting several hundreds of relevant publications. The findings made it possible to define further relevant key terms on a third level (not shown in Figure 1).
Figure 1: Citation of the chosen family of keywords in the literature
The second phase was also used to provide a quantitative characterization of the interrelationships among the key terms belonging to the same cluster. Figure 2 shows the interrelationships found. If two terms are used in the same document, then there is a line between them, and the thickness of the line indicates how frequently they occur. In other words, the thick lines refer to combinations of terms that appear in multiple papers, whereas the thin ones refer to combinations that rarely appear in the studied publications. It can be observed in the connectivity diagram shown in Figure 2 that the thickest lines are between the above four key terms – a fact that underlines their significance and relatedness. In addition, the diagram casts light not only on the complexity of the completed study, but also indicates which key terms could not be studied separately due to their interconnections claimed by the authors of the studied publications.
Figure 2: Connectivity graph of the chosen family of keywords
The above pieces of information obtained from the quantitative part of the literature study were used to develop a reasoning model for the qualitative part of the study. This part focused on the interpretation on the findings and disclosed semantic relationships. The reasoning model, which was also used at structuring the contents of this paper, is shown in Figure 3. Indicated are only the first and second level key terms while, as mentioned above, the study was actually done with key terms of the third decomposition level.
Figure 3: Reasoning model of the literature research
The considered papers were published in different periods of time, ranging from the mid-fifties until today. An important observation was that the concepts identified by the first level key terms are in an implicative relationship with each other. Namely, if the nature of data changes, then it entails a change in the approaches of data transformation, that in turns implies the need for different data transformation methods and tools. These enablers can provide support for a broader range of existing applications and can facilitate new data analytics applications with regards to enabling product enhancement and innovation by design. The investigation concerning the changes in the nature of data was focused mainly on product-related use, maintenance and service data, and on data describing the conditions and behavior of products.
1.3. Organization of the paper
techniques, and discuss the accompanying challenges. In
Section 4, we summarize the findings related to existing commercial and academic data analytics software tools and discuss how they can be improved according to the literature. In Section 5, various applications of data analytics are discussed, including the major application domains of various big data analytics approaches and the challenges that have already been recognized and addressed. The last Section combines the findings and the lessons learnt in the above four domains and discusses their implications. In this Section we present our conclusions regarding what needs to be done to find resolution for the unearthed issues and deficiencies. Based on these, we sketch up the concept of a novel data analytics enabler, called data analytics toolbox (DAT), which is intended to go beyond the functionality and services of the currently available commercialized integrated data analytics software packages. The implementation of this toolbox is actually in the focus of our follow up research.
2.
Overview and analysis of the changes in the
nature of data
2.1. Nature of data as a domain of research interest Analysis of the trends and changes in the nature of data implies the need for a historical perspective. As a result of the third industrial revolution, which established the scientific and technological domain of electronics created and involved it in automation of industrialized processes the beginning of 1950s, in addition to alphanumeric data, analogue system signals has been also carriers of „data‟. The fourth industrial revolution, which is culminating since the midst of 1980s, introduced digital computing and syntactic data processing not only in industrial contents, but also in everyday creative and executive processes. The current fifth industrial revolution, often referred to as the revolution of intelligence, shifted the attention to various formal and tacit forms of knowledge and to knowledge engineering and semantic knowledge processing. This is an indispensable step considering the objective of current day product design and production to offer smart, cognizant and even intelligent artefactual systems for the society. These are deemed to be the most fundamental (generic and global) trends of change that can at all be identified in the nature of data. However, in addition to these, the literature also reflects many specific and local changes in the nature of the data captured and process, in particular in the field of realization of new products and value-adding services. In the above context, data is a set of qualitative and/or quantitative values of variables [11]. It may concern the behavior, the status, or the function of a system and can be in different formats (symbols, texts, numbers, figures, etc.) [12], [13]. Before and at the beginning of the fourth industrial revolution, data typically were typically limited (up to a couple of petabyte, as a maximum) in terms of their amount, which is nowadays indicated by the term „small data‟). Due to the technological advancements in digital data processing, the use of multiple digital devices, and complex sensor and effector networks, the possibility of capturing and processing data has drastically changed. Tremendous amount of digital data records are generated that form continuous data streams. This „new generation‟ of data, also called „big data‟, may run up to exabytes scales [14]. It is no longer regarded as static or stable, but as dynamic and recomposable, and as such, it is a raw material for business exploitation and a crucial input
that can be used to create new forms of economic assets and values [15]. The motivation to exploit mass data has emerged as a new research field called big data science. Big data analytics (BDA) has come in as a promising, minute-wise evolving methodology to retrieve knowledge from massive data streams and repositories [16]. Though the overall research objective of our study was to find and analyze scientific and professional publications that discuss the recent changes and trends in the nature of data, the actually conducted review was restricted to data associated with monitoring real life use of the products and services in operation, as well as to those obtained by user feedback on social media, due to the abundance of the kinds of data. On the other hand, this scoping of the study made it possible to derive highly relevant conclusions in the narrow context of our research. The practical objective was formulated so as to study the kind of data that makes it possible (i) to extend product and service lifespans, and (ii) to optimize the use of the necessary resources all along their lifecycle. Here, the term „lifecycle‟ refers to all the phases of the product and service life, from the beginning of life (BOL) where the product is designed and realized, through the middle of life (MOL) phases where the product is available on the market and used by the customer, until the end of life (EOL) phases, where the product is dismissed or revamped [17].
2.2. Major findings
huge amount of data has made data modeling a critical and
vital issue of survival of companies (Verhoef et al., 2003). Over the past decades of digital data processing, the fundamental concepts and general principles of data modeling have gone through an evolution (Goodchild, 1996). There are seven modern data modeling approaches identified in the literature, namely: (i) relational, (ii) semantic, (iii) entity-relationship (ER), (iv) extensions of ER (ERR), (v) object-oriented (OO), (vi) statistical, and (vii) data metamodeling (Ter Bekke, 1992) (Ter Bekke, 1995) (Ter Bekke, 1997). In spite of the fact that many pitfalls have been discovered in the relational theory, relational data-models have become widely accepted. They offer mathematical foundations and simple user-level paradigm, while semantic models offer flexible structuring capabilities and explicit data constrains (Siau et al., 2013). Semantic modeling applies various abstractions (such as classification, instantiation, aggregation, decomposition, generalization, and specialization) in order to capture meanings by data structures in complex situations. Semantic integrity is typically guaranteed by making use of the fundamental type-attribute relationship. Object-oriented data modeling captures conceptual entities as objects [24]. OO modeling has emerged as an alternative to the traditional entity-relationship orientated modeling technique, based on the premise that the resulting OO data models are easier to use and understand [25]. It has been experienced that understanding OO data models is indeed faster than that of EER for both simple and complex problems. However, many of the other claims concerning the superiority of OO data modeling (e.g. perceived ease of use) are not empirically verified. OO data models are typically used where used in computing such as programming, analysis, design, and database management [26]. Despite the huge number of research projects in semantic and OO data modeling, the relational one is still the predominant database used in the industry [27]. ER and EER modeling are popular as tools for conceptual data modeling [28]. For the purpose of exploratory data analysis (of continuous data), various parametric and nonparametric data models have been proposed based on estimating the quantile functions and density quantile functions [29], [30]. The trends of change concern not only the sources and amount (size) of digital data its size, but also the arrangement (structure) of data, Figure 4. Unstructured data do not support formal analyzes, traditional database management [31], or applying pattern searching methods [32]. The papers related to the nature of data cluster indicate that individuals, industry, and science face the challenge of dealing with large datasets as a result of the proliferation and ubiquity of high-throughput computing technologies and internet connectivity. The main difficulty is not in the technical handling of large amount of data, but in mining and extracting valuable information and knowledge from them [33]. Decades ago data was characterized by three characteristics (volume, velocity, and variety) because these lend themselves to advanced, complex, and predictive business analysis and insights [34], [35]. Recently it has been complemented with three more characteristics (value, veracity and viability) [36], [37]. In order to deal with its scalability and affordability, the literature suggests that big data requires optimized data warehouses and cloud computing [38]. The outcome of the literature review showed that managing and gaining insights from the produced big data is a challenge and a key to competitive
advantage [39]. It offers substantial value to organizations who decided to adopt it, but poses a number of challenges for the realization of such added value [40].
Figure 4: Change in the characteristics of regular and massive data sets (designed after [36], [37])
In the context of this paper, big data is collected during the whole product lifecycle stages: (i) beginning-of-life (BoL), (ii) middle-of-life data (MoL), and (iii) end-of-life (EoL) [17]. Researchers showed that it is important to focus on MoLD that primarily, but not exclusively include use, service and maintenance data [3], [41]. It provides failure data, performance data, age data of product, operating environment data, usage intensity data, maintenance reports, and refund and replacement data [42]. These data allow the observation of the condition and the behavior of products during the usage phase [13]. If manufacturers face communication challenges and if they do not have well-established processes to obtain and utilize feedback from their customers, processing MoLD may also help them [43]. Furthermore, acquisition of MoLD creates opportunities for and encourages a life-cycle orientated approach to incremental product design that evaluates and enhances all products and services on a continuous basis [44]. In other words, MoLD can be transformed into knowledge that enables a perpetual and long term design improvement, and product innovation and planning. Collecting product information during the MoL and EoL phases makes a product itself or product operations improved in various ways, such as the improvement of design and the optimization of maintenance operations [45]. A recognized difficulty related to MoLD is that the related elicitation activities should be executed outside the companies, typically with an intense involvement of both the products and the end users. If elicitation of product-related information is interventional, then it may lead to operational inefficiencies [3]. Since conventional information systems used in the definition of products and services cannot handle MoLD and the knowledge, the need for dedicated data analytics approaches and tools have been recognized also by the developers of product life cycle management systems. Nevertheless, in the current industrial practice the potentialities offered by MoLD analytics is seldom utilized sufficiently by product and service developers. The gradually increasing smart behavior of products have been recognized as a key development in collecting and feeding back data and information to designers with regards to modes of use and operation [3].
2.3. Lessons learnt
over a relatively short time. What is typical nowadays is to
produce and process complex data structures, rather than only data constructs or individual data, as contents for data warehouses, integrated databases [46]. We are moving away from the so called „situated aspect data‟ (sorted according to type, location and meaning) to big data, which cannot however be interpreted easily from the point of view of its structure and semantics because these patterns are often deeply hidden in the flow of data, which does not hint directly at the semantical meanings of the various bodies of data [47], [48]. One reason of why digital data have become diverse is that engineering and technical data have been combined with social data [49]. At the same time, it has also become tendentious to produce qualitative data together with quantitative data. It is a daily routine nowadays. Processing life-time data of products and related processes means that descriptive, prescriptive, predictive and operational data should be managed concurrently. This resulted in a data engineering challenge for the developers of the current data processing tools [50]. There has emerged an increased need for modifying or redesigning them in order to be able to process hidden data patterns and mixed semantics [51]. The above changes in the nature of data explain why a new data science is in a formation stage and why a lot of novel methods and tools have been or are being developed in the field of managing data technologies. Data modeling plays an important role in both structuring data, and capturing and eliciting the meaning of (structured) data. Typically, three types of data models are used in information systems: (i) conceptual data models (data requirements models), (ii) logical data model (data constructs/structures models), and (iii) physical data models (database/warehouse access models) [52]. These models are used in both business-oriented and system-related data processing. The major issues are related to (i) the inflexibility of current data models, (ii) the multiplicity of imposing structures and capturing meanings, (iii) the limited reusability of data models, (iv) the insufficiency of data modelling standards, (v) the lack of stereotyped data interfaces, (vi) the management of the relational complexity of data models, and (vii) the uncoordinated development of information systems [53]. Though these issues were identified almost 15 years ago, the majority of them are still acute. A clear distinction has been drawn between data modeling and data analysis. Data modeling is the activity of using a set of tools and techniques to aggregate, organize, relate, represent and store data, whereas data analysis is interpreted as the activity of merging data from multiple data sources together using set of methods and tools to gain insight from a data and analyze trends to help make better decisions [54]. There have been an impenetrable range of data modeling/representation and data analytics tools developed. This issue will be addressed in Section 4. At this point it is important to mention that, as all data collected during the whole life-cycle of a product, MoL data also need to be defined, collected, processed and then can be used. However, there is a difference with regards to the execution of these four steps.
MoLD are associated with certain phases of the product life cycle. Therefore, first the phases with which the MoLD are associated should be captured. These phases can be so broad as logistics, operation, and maintenance, which produce a wide variety of MoLD, e.g. run time performance data, failure data, data about the aging of a product, changes in the operating environment, usage
intensity, completed maintenance task data, refund and replacement data, etc. Due to their nature (state and time dependence), these need specific data processing and interpretation approaches.
Collecting data is determined where the MoLD can be found and collected. In this sense, MoLD may have many sources, outcome of which should typically be combined before processing. For instance, MoLD can be aggregated by field observations, interrogations of users, studying failure log files and maintenance reports, or from relevant web sources such as social media and user forums. Alternatively, they can also be elicited directly from products by sensors or self-registrations.
Processing MoLD depends on the opportunities of computational management, for instance, on the pre-processing, processing and post-processing procedures (detailed in the next section). Though these steps are common, what makes them challenging is the fact that the complexity of data should be addressed, the data is to be processed in real-time, and there is a time- and context dependence to be dealt with. The existing data processing tools are not yet equipped with capabilities for these purposes.
Using MoLD can be considered from multiple aspects and application cases. This raises different requirements on the output of the data analytics tools. For instance, data collected during the use of a product may deliver insights on consumers‟ behavior and preferences, but also on the frequency of using a product, the convenience of the interaction, or the potential misuses of a product. This means that the goals of data processing are strongly articulated by the objectives and manners of using a product.
3.
Overview and analysis of steps and
techniques of data transformation
3.1 Interpretation and mapping of data
transformation approaches
of a particular software tool possible on a different platform
[59]. This is often referred to as data- or software-migration. However, as reflected in the literature, data transformation means data processing for some authors, and it is the synonym of data translation or data integration for others. We adopted the comprehensive interpretation according to which data transformation blends data pre-processing processing (transformation) and data post-processing (presentation). DT involves multiple steps, going from the aggregation of data, through cleaning, classification and interpretation of data, to extraction of patterns to be evaluated and representation of data patterns. These steps are needed to support and interpret changes in the structure, representation and content of data [56]. Since the beginning of the big data era, many authors addressed the challenges that they were facing. The primary issue is not the huge amount and diversity of data, but the way of transforming them and extracting valuable insights from dumped and dynamically changing data [41]. The aim is to discover previously unknown interrelations among unrelated attributes of datasets [60], [61]. Many books are published on the essence and challenges of data transformation processes [15]. The complexity and other challenges of data mining were addressed from many aspects by data scientists and analysts, as well as the steps needed to find solutions [62]–[64]. The difficulty and specific challenges of making correlation analysis (i.e. finding the measures, the degree of association of the data, or the strength of the relationship among them) using mathematical operations is also addressed in the literature [65]. These challenges include: (i) spatial and temporal variation of data, (ii) missing values, and (iii) the lack of balance in sampling [66]. To find answers to these challenges is a concern not only for researchers, but also business/market managers and decision makers who should base their decisions and actions on the insights gained from big data [67]. Toward this end, they have to understanding the aggregation of big data, the approaches of extracting patterns, and using them to predict future situations and/or behavior.
3.2 Major findings
The ultimate objective of big data management is to generate new business opportunities for the service industries. However, since more than 80% of the world‟s data is unstructured, most businesses do not even try to use it for their benefits [68]. Big data itself has no real meaning, unless it is exploited by extracting information and knowledge from it. Various authors argue that in fact not only the amount of data is important, but also the diversity of it, which may lend itself to various semantic patterns [69]. There is a wide variety of big data sources. It ranges from natural processes and substances through engineered physical processes and artifacts to virtual environments and objects. A recent source of big data has been the social media and websites [70]. Data collected from diverse sources and represented in various formats need to be transformed (prepared for semantic processing). This constitutes an essential step in the process of a meaningful analysis [71]. Social media and website data need pre-processing that involves common steps such as aggregation, cleaning, sorting, etc. because of the fact that real-world data are typically impure [72]. Pre-processing is also expected (i) to determine the accuracy and completeness of data [73], (ii) to reduce noise of data and correct the
competition, productivity and innovation.
3.3 Lessons learnt
Base on the development of automatic identification, data capture and storage technologies, people generate data much faster and collect data much bigger than ever before in business, science, engineering, education and other areas [94]. Current literature identifies: (i) data preparation, (ii) data mining, (iii) patterns evaluation, and (iv) knowledge representation as the main activities of processing complex and non-structured data [95]. The change in the nature and the sources of data implies a change in the steps of data transformation [96]. Due to the large dynamics, data processing should consider the time dependent validity of data [97]. The literature claims that there is a need for data transformation techniques able to manage changing data patterns or dealing with dynamic patterns recognition and evaluation [33]. It was explained in many papers that big data is mainly unstructured and heterogeneous, but its cleaning and pre-processing may lead to a relatively high loss of data [56]. It is also claimed that significant amount of big data is discarded [97], which may severely influence the results of data transformation, but still no clear solution has been proposed concerning those issues, which raises complexity challenges of big data. The mining of big data primarily focuses on extracting patterns to be evaluated by both manual and automated approaches [98]. Currently, dealing with patterns requires multiple expert interventions (especially after mining) [99]. At the same time, the currently widespread methods of big data transformation do not consider human behavior, which adds uncertainty to the outcome of the process [100]. Extraction of patterns is typically done on historical data, rather than won real-time acquired data. Mining and transforming big data necessitates highly scalable strategies [101]. In order to achieve more effective processing, the literature suggests developing sophisticated data filtering and integration techniques, as well as using advanced parallel computing environments and more effective user involvement [14]. Researchers also observed that if the process of transforming data to knowledge is time consuming, then it may negatively influence the relevance of the extracted knowledge and its validity in the dynamic context, or it can even make the extracted knowledge invalid [102]. This issue has been addressed by many publications, but the contour of a general solution does not seem to be in formation. However, one issue that does not seem to be sufficiently addressed in the literature is providing meaning to data (automatically or semi-automatically). The importance of this issue originate in that it concerns and may computationally influence all data transformation steps. A hierarchy of concepts interlinked by the assumed relationships, and the axioms able to express the relationships of the concepts and to constrain their interpretation are seen as ingredients of a possible solution [103]. In addition, only limited efforts have been made related to capturing the semantics of transformed data and to give meaning to transformed data in context [104]. No sufficient attention was given to relations between signifiers, such as words, phrases, signs and symbols, what they stand for, and what their denotations are [105]. It seems that there are multiple challenges related to the early preparatory activities of data analytics. One of them is data inundation, which may manifest as the major performance bottleneck for processing (cleaning, sorting, structuring, etc.) the output of
increasingly complex sensor networks used to monitor product use and life cycle performance [106]. In addition to the amount of data generated by sensors, the signals and data generated by the end user products themselves should also be accounted for. It was argued that data analytics will be significantly challenged by the necessity of combining sensor generated (objective and aggregating) macro data with end-user generated (subjective and finely granular) micro data to figure out their mutual meaning and impacts [107], [108]. Furthermore, associating quantitative (measured and factual) data with qualitative (social networking provided) data needs. Data modeling approaches are often distinguished as exploratory and confirmatory approaches [109], [110]. Furthermore, distinction is made between non-parametric statistical confirmatory data modeling and parametric statistical confirmatory data modeling [111].
4.
Overview
and
analysis
of
data
transformation tools and packages
4.1. Interpretation and mapping of data
transformation means
The literature presents, discusses and compares many tools that have been developed to help understanding and processing data. The overwhelming majority of these tools are general purpose statistical tools [112]. Much less tools have been developed to assist the improvement of products and services [113], [114]. The general purpose software means are typically sorted into three categories: (i) single task orientated software tools [115], (ii) multi tasks orientated integrated software packages (and toolboxes) [116], and (iii) multi-functional development environments [117]. The first category consists of software implementation of algorithms, procedures, or techniques to represent, enhance, analyze or transform input and output data. A second level categorization of the single task orientated software tools is made based on the type of tasks they are intended to support. Typical representatives are such as business analysis tools, data visualization tools, trend analysis tools, etc., which are marketed by many vendors. The second category of systems includes (often modularized) software packages, which combine and interlink functionalities of multiple software tools. The component tools typically share a common user interface and can exchange data among each other [118]. The statistical procedures offered by the integral packages for exploring and predicting big data address the issues of big data processing such as source heterogeneity, noise accumulation, spurious correlations, and incidental endogeneity, in addition to balancing the statistical accuracy and computational efficiency [119]. The third category includes developer tools that are able to generate (partly or fully automated) algorithms, source codes, and executable programs, and to interlink these. The term „environment‟ in the name of the category indicates that all developer tools and production servers are incorporated.
4.2. Major findings
data [121]. This is also confirmed by a study in 2017
explaining the large volume of data makes it difficult for human being to extract valuable knowledge from it without powerful tools [122]. Though the literature discusses many big data mining and analysis tools, their majority is still in infancy [123]. The traditional tools are able to capture, curate, analyze and visualize big data, but usually fail to fulfill the variety of needs such as satisfying all experimental designs [124], finishing the processing in a reasonable time [125], functioning in parallel [126] and being scaled to large datasets [127]. The fact is that as the number of existing commercial (C) and open source (OS) tools grows, the choice of the most appropriate one for a particular data analysis task is becoming increasingly difficult [128]. An apparent technological issue for traditional software tools that amount of data generated and stored at different sources grows rapidly and their handling needs a sufficient level of automation [129]. In the lack of this, it is becoming hard to capture, store, manage, analyze, visualize and share mass data using typical tools [130]. Required are powerful and efficient tools that extract useful information from data, and that can cope with big data challenges [131]. It has been found in [54] that there are software tools that solely operate as information servers to data mining tools and do not have any analysis functionality. Others, as argued, “can be abused for data mining, but their intended use lies somewhere else” (like that of the software packages dedicated to pure statistical analysis, or MATLAB‟s Neural Network Toolbox [132]. Some other software tools are advertised as data mining or knowledge discovery tool, but they only do reporting and visualization, such as Oracle Discoverer [133]. There are surveys and comparative studies in the literature that analyze the functional capabilities of data analytics tools and compare the performance of these tools [134], [135]. A survey done in 2016 reported that the top ten tools were: R, Python, Microsoft SQL Server, Microsoft Excel, RapidMiner, Hadoop, Spark, Tableau, KNIME, and Scikit-learn [136]. In Table 1 we sorted the tools, which we investigated in our study, according to their functionality offered for data analytics. Obviously, in the case of any comparison of the tools not only the functionalities and the data analytics tasks at hand, but also the user groups, the data structures, the processing methods, the import and export of data, the use of models, as well as the platforms and the licensing have to be taken into consideration.
Other web resources showed that the choice of tools is also influenced by several pragmatic issues, such as the budget and the user experience . As an overall finding we can argue that there is no a single tool not even an integrated package, that could cover all needs and steps of data analytics, in particular not in the case of big data processing and applications [137]. It seems to be a generally accepted conclusion in the literature that no tool is better than the others [138] and that users can select the adequate data analytics software package only based on a critical analysis of the objectives and the application case [139]. It is worth noting that there are some quasi-data analytics tools, which we have not considered to be relevant for our specialized study. For instance, in the area of engineering, tools like ThingWorx (PTC), Exaled (Dassault Systemes), and Omneo (Siemens).
4.3. Lessons learnt
A lot of work has been done to develop and enhance data analytics tools. It is emphasized that big data cannot be managed with traditional methodologies or data mining software tools [140], [141]. In general, they encounter great difficulties at handling heterogeneity, volume, speed, as well as privacy and accuracy. They are inadequate for handling such characteristics [142]. Applying existing data mining algorithms and techniques to real-world problems raises many challenges due to inadequate scalability and other limitations of these algorithms and techniques [143], [144]. Several authors confirm that there is a need for new computational theories and tools to assist humans in extracting useful information or knowledge from the rapidly growing volumes of digital data [145]. There are a multitude of tools, which can help understanding and interpreting various application data, but can also assist the improvement of products and services based on dedicated data
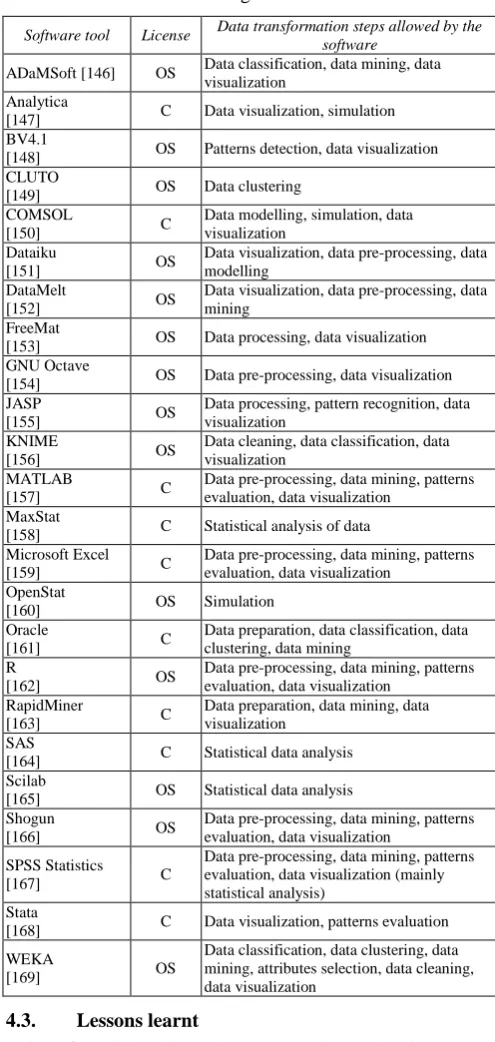
Table 1: Investigated software tools
Software tool License Data transformation steps allowed by the software
ADaMSoft [146] OS Data classification, data mining, data visualization
Analytica
[147] C Data visualization, simulation
BV4.1
[148] OS Patterns detection, data visualization
CLUTO
[149] OS Data clustering
COMSOL
[150] C
Data modelling, simulation, data visualization
Dataiku
[151] OS
Data visualization, data pre-processing, data modelling
DataMelt
[152] OS
Data visualization, data pre-processing, data mining
FreeMat
[153] OS Data processing, data visualization
GNU Octave
[154] OS Data pre-processing, data visualization
JASP
[155] OS
Data processing, pattern recognition, data visualization
KNIME
[156] OS
Data cleaning, data classification, data visualization
MATLAB
[157] C
Data pre-processing, data mining, patterns evaluation, data visualization
MaxStat
[158] C Statistical analysis of data
Microsoft Excel
[159] C
Data pre-processing, data mining, patterns evaluation, data visualization
OpenStat
[160] OS Simulation
Oracle
[161] C
Data preparation, data classification, data clustering, data mining
R
[162] OS
Data pre-processing, data mining, patterns evaluation, data visualization
RapidMiner
[163] C
Data preparation, data mining, data visualization
SAS
[164] C Statistical data analysis
Scilab
[165] OS Statistical data analysis
Shogun
[166] OS
Data pre-processing, data mining, patterns evaluation, data visualization
SPSS Statistics
[167] C
Data pre-processing, data mining, patterns evaluation, data visualization (mainly statistical analysis)
Stata
[168] C Data visualization, patterns evaluation
WEKA
[169] OS
transformation steps. It is often mentioned that even the most
sophisticated tools need human interaction [170]. Another open issue is that it is not clear how a data analytics system can deal with historic data as well as with real-time data at the same time, and what is an optimal architecture of such a system [171]. Less significant, but still important issue is that it is difficult to find user-friendly visualizations in the case of large volume data [172].
5.
Overview and analysis of data analytics
applications
5.1.Interpretation and mapping of data analytics applications
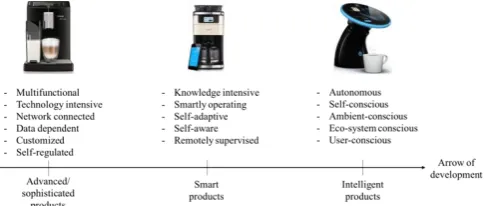
Data driven applications have emerged in the last decades [173]. Due to its fast development big data is rapidly expending in all science and engineering domains, as well as in physical, biological and biomedical sciences [84]. Research has provided important information for designing big data mining algorithms and systems [174]. For the reason that every discipline and application domain has a vested interest, big data became primordial for multidisciplinary problem solving [175]. In this case, the challenge is how it is possible to use data regardless the application domain [176]. Despite the complexity of this issue, there is an optimistic atmosphere due to the serious efforts that scientists and developers are currently making related to what big data can offer. “Many big data applications will have unintended and unpredictable results as the data scientist seeks to reveal new trends and patterns that were previously hidden” [177]. In spite the above efforts, the domains of engineering- and product-associated big data processing (BDP) are behind the overall progress because of the shear fact of late recognition. Other issue is the rapid paradigmatic changes in the field due to the converging technologies and embedding software and cyber-ware in practically all products. These imply many changes that are already observable currently [178]. First of all, engineered products are becoming more-and-more multifunctional, technology intensive, network connected, data dependent, and customized/personalized [179]. Operation and maintenance process data can be tracked in real-time over MoL by embedding an information device to the product itself [83]. Products with these characteristics are often referred to as advanced or sophisticated products. However, the largest paradigmatic change is that they are rapidly becoming knowledge-intensive and smartly operating, or even progressing towards some forms of intelligent operation (Figure 5) [180]. Therefore, in line with many other researchers, we considered advanced consumer durable products as a specific application domain of big data and data analytics [181]. In the next section, we will highlight the major finding related to main application domains of big data management, including advantages, challenges and trends.
Figure 5: The dominating trend of development of new generations of products
5.2. Major findings
scientific research, many fields have become highly
data-driven due to the development of computer science [195], for instance, astronomy [196], social computing [197], bioinformatics [198], and biology [199], which generate enormous data sets able to provide the basis for inquiry or to drive the whole system design when analyzed [200]. In all of the mentioned applications, but also in others, significant challenges are to be considered related to system capabilities, algorithmic designs, and design models [201].
5.3. Lessons learnt
As argued in [84], “Driven by real-world applications … managing and mining big data have shown to be a challenging yet very complicated task”. Practically independent of the field of application, one of the main challenges of BDP is exploring large volumes of data and extracting useful information or knowledge for future actions [202]. Notwithstanding, new applications are revealed and new approaches are proposed. One proliferating field of application is using BDP in strategic product development and life cycle engineering of products. In this particular field of application, rapid changes are predominant. We can witness the trend of intellectualization of products and services nowadays [203]. Intellectualization means equipping industrial and consumer products with digital connectivity and data communication as well as with capabilities that mimics human-type intelligence. The first developments are supported by the Internet of things technologies as overall infrastructure. However, it has also been clarified that the Internet of things enables connectivity and information exchange, rather than implementation of operational intelligence of products [204]. It is the role of cyber-physical systems and the various advanced forms of artificial (system) intelligence to provide sophisticated mechanisms for building situation and context awareness, reasoning and decision making, and adaptation to carrying operational situations and objectives [205]. It has been observed that the term „intelligence‟ has become popular both in the scientific literature and in the professional literature, though it begs for a more careful use in the context of artifacts and services. As for now, the terms such as „advanced‟, „sophisticated‟, „smart‟, „autonomous‟, „intelligent‟, etc. are used interchangeably, as well as distinguishingly, by various authors [206]. Until now, the concept of intelligent products has remained fuzzy and the use of the term is confusing [207]. Interestingly, even the scientific literature is divided in terms of using these terms to characterize the operation and/or behavior of artifacts and their interaction with humans and other artifacts (systems) [208]. It seems that there is a problem with the verbatim interpretation of the term „intelligent‟ as well as with the relationships of intelligent products to knowledge acquisition and processing. This entails the need for further work considering the variety of application contexts. In addition, there is a need for a new classification of these products simultaneously considering the achieved level of intelligence and the specific manifestations of these levels [209]. On the other hand, researchers active in various fields of intelligent products do agree that there is still a long way to go before different kinds of machines and systems will be able to intelligently communicate, reason and understand each other [210], [211]. Some of them believe that more is needed than that typically provided by ontologies and semantic
web-related technologies to be able to produce truly „intelligent‟ tools [212]–[214].
6.
Discussion, conclusions and future work
6.1. Discussion
(v) big data virtualization platforms, (vi) deploying big data
applications on cloud environments, and (vii) management of time-wise distributed big data and applications – just to mention the most significant ones. The use of cloud computing methods and resources in capturing and processing big data is becoming a daily standard, and it is exploited in many areas of big data. This phenomenon rapidly proliferates in these days since users are able to access data and data-processing tools from a cloud anywhere and anytime it is needed [215]. Actually, there are several existing data processing applications that need cloud environments, such as multi-media data management in a distributed manner. In turn, the need for efficient BDP also raises many new requirements for cloud computing, for instance: (i) resources for handling large-scale heterogeneity, (ii) effective and smart multimedia content retrieval, and (iii) transport and security protocols, and so on. Large databases with large volume of vaguely related data entities or complex data structures are also in the focus of research. The intension is to lessen data uncertainty and to increase understanding of meaning and consequently enhance the reliability of analysis and decision making. Since the amount of data grows irresistibly, data sub-sampling is becoming a means of resolving computational limitations. Though surrogating entire complex datasets helps overcome the real-time constraint, it introduces even greater uncertainty. It can be prognosticated that efficiency and reliability of data mining and knowledge discovery will remain the major issues for advanced big data analytics. Processing algorithms and mechanisms should be based on new underpinning theories, which allow dealing with the volume, the distribution, the cognitive complicatedness, and the dynamically changing characteristics of big data. The timed characteristic of big data does not seem to a significant obstacle, but the interplay among all aspects of big data does. Across all industries, big data is a new business asset and advanced data analytics will help businesses to become smarter, more productive, and better at making predictions. In the context of future product and service development, some new sources of data like social media will offer new opportunities for designers to get insights into consumers‟ purchasing preferences, decisions and behavior, and to uncover information in context that is not possible with traditional product functionalities and life cycle data management approaches. In a wide field-based collecting data, they may rely on Internet of Things principles and technologies, while in terms of locally interpreting and reasoning with big data, they may rely on smart cyber-physical systems technologies. To put an end to the infinite problems of big data management and processing, some authors proposed specific solutions for a selection of tools, the way of coping with the complexity of big data in particular application domains. A purposeful regrouping of these solutions (touched upon earlier in this paper) could reveal the fact that the majority of authors are committed (if not attached) to real-time analysis of data and to developing powerful tools and better system architectures so that consumer durable making companies can realize value by understanding their operations, customers, distributors, and the marketplace as a whole.
6.2. Conclusions
Our main conclusions have been formulated as follow:
The completed literature study reinforced our observation
that everything is changing and developing rapidly in the current daily practice of data analytics. The source phenomenon triggering the changes in the methods, tools and applications is the change of nature of digital data. This change manifests itself in the growing amount and increasing complexity of data, which challenges pattern-based information and knowledge mining.
A significant diversification can be observed in the area of data transformation. A plethora of methods and techniques have been developed for systematic and controlled data aggregation, interactive visualization, structural and semantic interpretation, and trend analysis and prediction. However, many of these are general (mathematical and statistical) approaches that are not reflecting the specific needs of particular applications.
Diversification of the methods and techniques is naturally followed by the diversification and articulation of the data analytic tools and systems. Articulation is reflected by the fact that the commercialized enablers range from (i) specific-purpose (individual) tools, through (ii) multi-purpose (integrated) packages, to (iii) application oriented toolboxes. There are several interoperability and efficiency issues reported in the literature.
Design application of data analytics seems to be in a premature phase. As a combined effect of the proliferation of data analytics tools and the Internet of Things connectivity, companies gradually recognize the opportunities and try to convert them into business benefits. However, neither comprehensive methodologies nor dedicated toolboxes seem to be available to facilitate their endeavor.
There is a kind of paradoxical situation due to the large number of data analytics tools and their underexposed exploitation in product development and innovation. In other words, product managers, designers and developers need to be supported by proper data analytics enablers in order to extract new knowledge and achieve significant benefits by MoL product data processing [216]. It seems to be a pragmatic, but instrumental strategy to combine the existing tools and packages into user-friendly and application-sensitive toolboxes.
The title of the paper is: „What does data analytics offer for extracting knowledge from the middle-of-life product data?‟ This indicates the need to investigate data analytics in the context of processing MoLD, which are typically characterized by huge variety, dynamics, and multiplicity of relationships. Our study revealed that there are only a very limited number of papers that specifically address the issues of extracting knowledge from this kind of data, considering the above characteristics and the purpose of providing information about product usage and operations. The existing literature so far lacks a systematic and extensive analysis of stakeholders within MoL phase [217], also analyzing MoLD is a challenge and still in its infancy, since data collection of MoLD reveals several issues [10]. With regards to the tools available, we also claim that there is no one specifically developed for processing MoLD data.
available on the market are not dedicated to the changing
aspects of the design tasks. In addition, the use of some of the tools is complicated because of the necessity of having a minimum of knowledge and skills to write and employ algorithms for data analysis. Furthermore, a critical issue from the perspective of designers is the lack of data integration and the abstraction towards semantic interpretation of the outputs, without which it is difficult to put the results into a specific design context.
The need for a smart data processing system to process real-time data streams to provide support for the operator is becoming a necessary tool to handle the vast amount of data generated from online instruments. It will provide the benefit or pre-filtering of useful data to be transferred from the remote monitoring system and stored for reference purposes. Much of this data is stored but never accessed and the potential capability of expensive instruments often goes unrealized due to a lack of under-standing and difficulty in extracting useful information from massive databases [218].
6.3.Future work
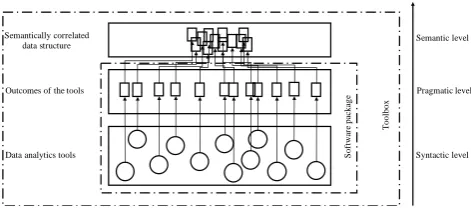
Our on-going and future work concentrates on the development of a novel „designerly‟ data analytics toolbox for product designers of a family of data-intensive products. Based on our forerunning study we hypothesized that the currently available data analytics tools miss semantic fusion with regards to their output data and suffer from the lack of interpretation of data constructs in various design contexts. We are conducting a two-stage study to understand what designers would expect from a „designerly‟ data analytics toolbox, and what sort of smart functionalities would they assume to be provided by a sophisticated (smart) toolbox. On the basis of these studies we are conceptualizing a functional, architectural and information processing framework for the target toolbox. We assumed that, instead of developing a set of new data analytics tools, regrouping and compilation of existing ones in a toolbox proper for an application dependent set of data transformation actions and able to store, access and analyze data in real-time/nearly real-time to allow extracting of knowledge beneficial for companies‟ product managers and developers. The functionality of the toolbox will go beyond the typical analytics functionality of commercialized integrated packages. It will offer purposefully correlated output data structures, which will allow interpretation of the meanings and relationships of the outcomes of multiple software tools not only on syntactic level, but also on pragmatic and semantic levels. In addition, the toolbox will feature an open architecture that makes it possible to include or exclude various tools, and will be equipped with reasoning capability that will provide meaningful insights and knowledge or product developers. The general principle of information fusion by the toolbox is shown in Figure 6. The functional/architectural framework of the toolbox reflects a stratified structure as shown in this Figure. The endeavor is to achieve the highest possible level of fusion and semantic processing of output data, rather than just integrating analytics tools on data exchange-level. This is underpinned by the need of product developers, who are not data analytics experts. They need not only convenient data transfer among the various software tools and databases, but also well-constructed and visually interpretable data structures, as well as explicit developer knowledge that can be used in multiple enhancement contexts. A major technical
issue is the implementation of data fusion on multiple levels. The associated challenge is to elicit the output data structures, and to give meaning to them according to the specific application domain, context and tasks. In our case it concretely means that the toolbox should provide insights for developers and make them able to transform use-patterns into product enhancement information and knowledge based on the outcome of the conducted analyses.
Figure 6: Novel system features of the proposed toolbox approach
From an operational point of view, the toolbox will take care of three different types of functions, namely: (i) kernel functions (for data transformations), (ii) auxiliary functions (for data management), and (iii) interface functions (connecting end-users, developers, and systems). The development of the toolbox will happen in two phases. The reason is that, according to our experiences, an incremental (or a step-by-step) innovation is more acceptable and straightforward for companies than a disruptive innovation. The first phase focuses on the development of an initial version of the toolbox for integral syntactic data analytics, which is referred to as „conventional data analytics toolbox‟ (C-DAT). Typical classes of syntactic data mining tasks are such as: (i) clustering analysis, (ii) anomaly/outlier detection, (iii) association rule learning, (iv) classification analysis, and (v) regression analysis. C-DAT includes an arsenal of existing tools, launched as open source or marketed as commercial tools. The software tools interoperating in various modules share a common user interface, exchange data with each other, and can be adapted easily according to the user and application needs. They aggregate, represent, maintain, analyze or enhance MoLD entered as inputs, and provide insights on how products are used by different customers and in different cultures, inform on the availability of the product, cast light on emerged failures, etc. This will facilitate the decision making concerning what and how to improve and for which customers. In the second phase of development, C-DAT will be augmented with various smart reasoning components enabling semantic data analytics, reasoning, and advising. This advanced version is called „smart data analytics toolbox‟ (S-DAT). The smart kernel functionality extends developed (second-generation) toolbox with: (vi) historic operation use situation/change analysis, (vii) multi-source output data fusion, (viii) simulation-based prediction and forecasting, (ix) visually-based feature learning, (x) event occurrence monitoring („watchdogging‟), (xi) semantic association graph building, and (xii) context-based advising. The modules of the smart part are purposefully developed semantic data modeling and reasoning tools. This smart extension will be developed to keep up with next generations of products, which are equipped with the capability of: (i) aggregating and generating MoLD real-time, (ii) communicating about their
S
o
ft
w
ar
e
p
ac
k
ag
e
T
o
o
lb
o
x
Syntactic level Pragmatic level Semantic level Knowledge level
Semantically correlated data structure
Outcomes of the tools
objectives and states, and (iii) building awareness, reasoning
about their operation states and objectives, and (iv) adapting themselves towards an optimum performance. Based on these, they can be considered as an external part of the smart toolbox. On the other hand, the considered elements of smartness are supposed to allow designers making the products more autonomous and carrying out a part of the data analytics quasi- automatically. This gives opportunity for using multiple products as interacting agents contributing to multi-aspects enhancements. This also means that designers will use the toolbox in case of large scale, multi-source dependent data processing. Our research will also consider sharing smart data analytics functions between the concerned products themselves and the product data analytics environment. The reason for this is that products are becoming equipped with more and more smart capabilities, which enable them to gather and process data by themselves in run time and self-adapt themselves according to the operational conditions and altering objectives. What it means is that products can take over a part of the functionality of a data analytics toolbox. This, however, is a new research phenomenon and challenge that needs further extensive studies. Putting everything together, research in and development of a smart toolbox able to assist anticipation of real-life use patterns and decision-making about product enhancement is relevant not only for the scientific community, but also for several segments of the making industry.
References
[1] Z. Bi, and D. Cochran, “Big data analytics with applications,” Journal of Management Analytics, 1(4), pp. 249-265, 2014.
[2] K. Bodenhoefer, A. Schneider, T. Cock, A. Brooks, G. Sands, L. Allman, and O. Delannoy, “Environmental life cycle information management and acquisition – First experiences and results from field trials,” In Proceedings of Electronics Goes Green, pp. 5-8, 2004
[3] H.-B. Jun, D. Kiritsis, and P. Xirouchakis, “Research issues on closed-loop PLM,” Computers in Industry, 58(8), pp. 855-868, 2007.
[4] Falcon Project, “Feedback mechanisms Across the Lifecycle for Customer-driven Optimization of iNnovative product-services”, available at: http://www.falcon-h2020.eu, 2015.
[5] M. Franke, P. Klein, L. Schröder, and K.-D. Thoben, “Ontological Semantics of Standards and PLM Repositories in the Product Development Phase,” Global Product Development, pp. 473-482, 2011.
[6] A. Saaksvuori, and A. Immonen, Product lifecycle management (2 Ausgabe), Springer, 2005.
[7] K. Bongard-Blanchy, and C. Bouchard, “Dimensions of User Experience from the Product Design Perspective,” Journal d'Interaction Personne-Système, 3(1), pp. 1-15, 2014.
[8] A. Katal, M. Wazid, and R. Goudar, “Big Data: Issues, Challenges, Tools and Good Practices,”. In Proceedings of the 6th International Conference on Contemporary Computing (IC3‟13), pp. 404-409, 2013.
[9] S. Terzi, A. Bouras, D. Dutta, M. Garetti, and D. Kiritsis, “Product Lifecycle Management from its History to its new Role,” International Journal of Product Lifecycle Management, 4(4), pp. 360-389, 2010.
[10] W.F. van der Vegte, “Taking Advantage of Data generated by Products: Trends, Opportunities and Challenges”, In Proceedings of the ASME Design Engineering Technical Conferences & Computers and Information in Engineering Conference IDETC/CIE, pp. V01BT02A025-V01BT02A025, 2016.
[11] H. Shu, “Big Data Analytics: Six Techniques,” Geo-spatial Information Science, pp. 1-10, 2016.
[12] T. H. Davenport, and L. Prusak, Working Knowledge: How Organizations Manage What They Know, Harvard Business Press, Buston, 1998.
[13] A. Bufardi, D. Kiritsis, and P. Xirouchakis, “Generation of Design Knowledge from Product Life Cycle Data,” Methods and Tools for Effective Knowledge Life-Cycle-Management, pp. 375-389, 2008.
[14] D. Che, M. Safran, & Z. Peng, “From Big Data to Big Data Mining: Challenges, Issues, and Opportunities,” In Proceedings of the International Conference on Database Systems for Advanced Applications, pp. 1-15, 2013.
[15] V. Mayer-Schönberger, and K. Cukier, Big Data: A Revolution That Will Transform How We Live, Work, and Think, Houghton Mifflin Harcourt, 2013.
[16] F. Xhafa, & L. Barolli, “Semantics, Intelligent Processing and Services for Big Data,” Future Generation Computer Systems, 37, pp. 201–202, 2014.
[17] D. Kiritsis, “Ubiquitous Product Lifecycle Management Using Product Embedded Information Devices,” In Proceedings of the International Conference in Intelligent Maintenance Systems (IMS‟2004), x-x, 2004.
[18] J. Guttag, “Abstract Data Types and the Development of Data Structures,” Communications of the ACM, 20(6), pp. 396-404, 1977.
[19] M.L. Brodie, “On the development of data models,” On conceptual modelling, pp. 19-47, 1984.
![Figure 4: Change in the characteristics of regular and massive data sets (designed after [36], [37])](https://thumb-us.123doks.com/thumbv2/123dok_us/8585385.1719787/4.595.313.552.92.222/figure-change-characteristics-regular-massive-data-sets-designed.webp)