118 |
P a g e
PUSHOVER ANALYSIS OF REINFORCED
CONCRETE FRAME STRUCTURES: A CASE STUDY
Abhijeet A. Maske
1, Nikhil A. Maske
2, Preeti P. Shiras
31
Civil Engineering, Government College of Engineering,
Sant Gadgebaba University Amravati, ( India)
2Civil Engineering, Assistant Professor, Nagpur Institute of Technology, RTMNU, (India)
3Civil Engineering, Assistant Professor, Nagpur Institute of Technology, RTMNU, (India)
ABSTRACT
Recent earthquakes in which many concrete structures have been severely damaged or collapsed, have indicated the need for evaluating the seismic adequacy of existing buildings. About 60% of the land area of our country is susceptible to damaging levels of seismic hazard. We can’t avoid future earthquakes, but
preparedness and safe building construction practices can certainly reduce the extent of damage and loss. In order to strengthen and resist the buildings for future earthquakes, some procedures have to be adopted. One of the procedures is the nonlinear static pushover analysis which is becoming a popular tool for seismic performance evaluation of existing and new structures. By conducting this push over analysis, we can know the weak zones in the structure and then we will decide whether the particular part is to be retrofitted or rehabilitated according to the requirement. In the present study the push over analysis is performed on multistoried frame structures by using most common software SAP2000 (version 14). To achieve this objective, two framed buildings with 5 and 12 stories respectively were analyzed. The results obtained from this study show that properly designed frames will perform well under seismic loads.
Index Terms—Seismic Hazards, Reinforced Concrete Structures, Pushover Analysis.
I. INTRODUCTION
Recent earthquakes in which many concrete structures have been severely damaged or collapsed, have indicated
the need for evaluating the seismic adequacy of existing buildings. About 60% of the land area of our country is
susceptible to damaging levels of seismic hazard. We can’t avoid future earthquakes, but preparedness and safe
building construction practices can certainly reduce the extent of damage and loss. In order to strengthen and
resist the buildings for future earthquakes, some procedures have to be adopted. One of the procedures is the
static pushover analysis which is becoming a popular tool for seismic performance evaluation of existing and new
structures. In particular, the seismic rehabilitation of older concrete structures in high seismicity areas is a matter
of growing concern, since structures venerable to damage must be identified and an acceptable level of safety
must be determined. To make such assessment, simplified linear-elastic methods are not adequate. Thus, the
structural engineering community has developed a new generation of design and seismic procedures that
incorporate performance based structures and are moving away from simplified linear elastic methods towards a
more non linear technique. The behavior of a multi-storey framed building during strong earthquake motions
depends on the distribution of mass, stiffness, and strength in both the horizontal and vertical planes of the
building. In multi-storied framed buildings, damage from earthquake ground motion generally initiates at
119 |
P a g e
seismically deficient since seismic design code requirements are constantly upgraded and advancement inengineering knowledge. Further, Indian buildings built over past two decades are seismically deficient because of
lack of awareness regarding seismic behavior of structures. The widespread damage especially to reinforced
concrete buildings during Bhuj earthquake exposed the construction practices being adopted in India, and
generated a great demand for seismic evaluation and retrofitting of existing building stocks. The minimum
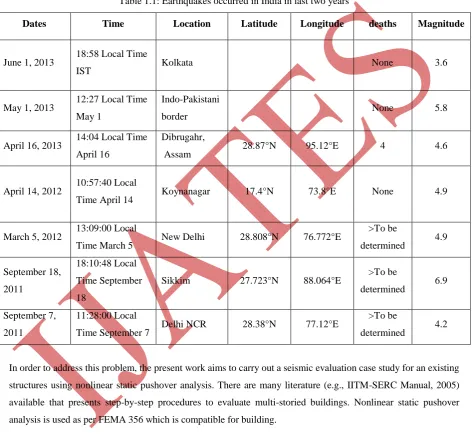
requirement for any method of analysis, including pushover, is that it must be “good enough for design”. Earthquake occurs in India in last two years are given in Table 1.1
Table 1.1: Earthquakes occurred in India in last two years
Dates Time Location Latitude Longitude deaths Magnitude
June 1, 2013 18:58 Local Time
IST Kolkata None 3.6
May 1, 2013 12:27 Local Time May 1
Indo-Pakistani
border None 5.8
April 16, 2013 14:04 Local Time April 16
Dibrugahr,
Assam 28.87°N 95.12°E 4 4.6
April 14, 2012 10:57:40 Local
Time April 14 Koynanagar 17.4°N 73.8°E None 4.9
March 5, 2012 13:09:00 Local
Time March 5 New Delhi 28.808°N 76.772°E
>To be
determined 4.9
September 18,
2011
18:10:48 Local
Time September
18
Sikkim 27.723°N 88.064°E >To be
determined 6.9
September 7,
2011
11:28:00 Local
Time September 7 Delhi NCR 28.38°N 77.12°E
>To be
determined 4.2
In order to address this problem, the present work aims to carry out a seismic evaluation case study for an existing
structures using nonlinear static pushover analysis. There are many literature (e.g., IITM-SERC Manual, 2005)
available that presents step-by-step procedures to evaluate multi-storied buildings. Nonlinear static pushover
analysis is used as per FEMA 356 which is compatible for building.
1.1 Pushover Methodology
A pushover analysis is performed by subjecting a structure to a monotonically increasing pattern of lateral loads,
representing the inertial forces which would be experienced by the structure when subjected to ground shaking.
Under incrementally increasing loads various structural elements may yield sequentially. Consequently, at each
event, the structure experiences a loss in stiffness. Using a pushover analysis, a characteristic non linear force
displacement relationship can be determined. It is necessary for the following considerations:
120 |
P a g e
Seismic demands are computed by nonlinear static analysis of the structure, which is subjected tomonotonically increasing lateral forces with an invariant height-wise distribution until a target
displacement is reached.
It is also necessary for evaluating the seismic adequacy of existing buildings.
Nonlinear static pushover analysis can provide an insight into the structural aspects, which control performance
during severe earthquakes. The analysis provides data on the strength and ductility of the structure, which cannot
be obtained by elastic analysis. By pushover analysis, the base shear versus top displacement curve of the
structure, usually called capacity curve, is obtained. Based on the capacity curve, a target displacement which is
an estimate of the displacement that the design earthquake will produce on the building is determined. The extent
of damage experienced by the structure at this target displacement is considered representative of the damage
experienced by the building when subjected to design level ground shaking.
1.2 Objectives Of The Study
The main objective of the present study is to carry out the seismic response of frame structures i.e. 5 storey’s and
12 storey using pushover analysis methods. The specific objectives are as given below:
To study and understand standard pushover analysis with their advantages, limitations and superiority. To employ design & analysis software Sap 2000 Vs. 14 and to study pushover analysis of frame
structures under consideration.
To investigate performance of multistoried frame structures under seismic loads.
To study and evaluate various seismic assessment parameters such as pushover curve, capacity curve.
II. LITERATURE REVIEW
The use of the nonlinear static analysis (pushover analysis) came in to practice in 1970’s but the potential of the
pushover analysis has been recognized for last 10-15 years. This procedure is mainly used to estimate the strength
and the seismic demand for the structure subjected to selected earthquake. This procedure can be used for
checking the adequacy of new structural design as well. The effectiveness of pushover analysis and its
computational simplicity brought this procedure in to several seismic guidelines (ATC 40[4] and FEMA 356[5])
and various design codes in last few years.
1. In the M.Mouzzoun et.al (2013) paper [1], assessed seismic performance of a five storey reinforced concrete
building designed according to the Moroccan seismic code RPS2000. In the first time a set of dynamic
analysis are carried out to compute dynamic properties of the building (fundamental period, natural
frequencies, deformation modes), in the second time a pushover analysis is performed to assess the seismic
performance of the building and detect the locations of the plastic hinges. Pushover analysis was performed
using SAP2000. The results obtained from study show that designed building perform well under moderate
earthquake, but is vulnerable under severe earthquake.
2. In the A. Kadid et.al (2008) paper [2], presents the study on three framed buildings of low rise, mide rise and
high rise buildings with 5, 8 and 12 stories respectively and these are analyzed using nonlinear static analysis
program SAP 2000.They concluded that the causes of failure of reinforced concrete during the Boumerdes
earthquake may be attributed to the quality of the materials of the used and also to the fact that most of
121 |
P a g e
3. In the Ms. Nivedita N. Raut et.al (2013) paper [3] presents the study about multi-storey reinforced concreteframed building structures in urban India which are constructed with masonry in fills. From results of
non-linear analysis, they compare Base shear and Displacement in bare frame, in fill wall frame and ground, and
concluded that at roof level, displacement in bare frame is more than other two frames and displacement at
ground floor in weak story is more than other two frames as well as most plastic hinges are formed in beam
than in column.
4. In FEMA (356) journal [5], detailed procedure and information about the Standard nonlinear static pushover
analysis is described.
III. METHODOLOGY
3.1. GENERAL: - The Seismic vulnerability assessment of multistoried buildings will be carried out using
pushover analysis. The different methods to be used are as follows:
i.Standard pushover analysis method (FEMA 356)
ii.Capacity spectrum Method (ATC 40)
iii.Modal pushover analysis method.
iv.Non-linear Time history analysis method.
For the present study standard pushover method described in FEMA 356 is adopted.
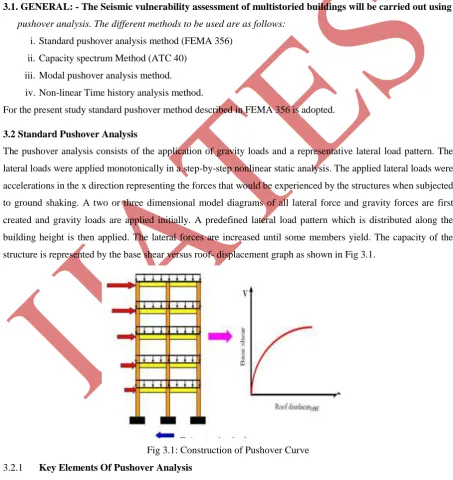
3.2 Standard Pushover Analysis
The pushover analysis consists of the application of gravity loads and a representative lateral load pattern. The
lateral loads were applied monotonically in a step-by-step nonlinear static analysis. The applied lateral loads were
accelerations in the x direction representing the forces that would be experienced by the structures when subjected
to ground shaking. A two or three dimensional model diagrams of all lateral force and gravity forces are first
created and gravity loads are applied initially. A predefined lateral load pattern which is distributed along the
building height is then applied. The lateral forces are increased until some members yield. The capacity of the
structure is represented by the base shear versus roof- displacement graph as shown in Fig 3.1.
Fig 3.1: Construction of Pushover Curve
3.2.1 Key Elements Of Pushover Analysis
1. Definition of plastic hinges: In SAP2000, nonlinear behavior is assumed to occur within a structure at
concentrated plastic hinges. The default types include an uncoupled moment hinges, an uncoupled axial
122 |
P a g e
2. Definition of the control node: control node is the node used to monitor displacements of the structure. Itsdisplacement versus the base-shear forms the capacity (pushover) curve of the structure.
3. Developing the pushover curve which includes the evaluation of the force distributions. To have a
displacement similar or close to the actual displacement due to earthquake, it is important to consider a
force displacement equivalent to the expected distribution of the inertial forces
4. Estimation of the displacement demand: This is a difficult step when using pushover analysis. The control
is pushed to reach the demand displacement which represents the maximum expected displacement
resulting from the earthquake intensity under consideration, which is calculated in Response spectrum
analysis.
The main output of a pushover analysis is in terms of response demand versus capacity. If the demand curve
intersects the capacity envelope near the elastic range, Fig.3.2 (a), then the structure has a good resistance. If the
demand curve intersects the capacity curve with little reserve of strength and deformation capacity, Fig.3.2 (b),
then it can be concluded that the structure will behave poorly during the imposed seismic excitation and need to
be retrofitted to avoid future major damage or collapse. Depending on the weak zones that are obtained in the
pushover analysis, we have to decide whether to do perform seismic retrofitting or rehabilitation.
Safe design unsafe design
Fig.3.2: Typical seismic demand versus capacity
Under incrementally increasing loads some elements may yield sequentially. Consequently, at each event, the
structures experiences a stiffness change as shown in Figure 3.3, where IO,LS and CP stand for immediate
occupancy, life safety and collapse prevention respectively.
Fig.3.3: Performance Levels Described By Pushover Analysis
Immediate occupancy IO: damage is relatively limited; the structure retains a significant portion of its original stiffness.
Life safety level LS: substantial damage has occurred to the structure, and it may have lost a significant amount of its original stiffness. However, a substantial margin remains for additional lateral deformation before collapse
would occur.
123 |
P a g e
IV. STRUCTURE MODELING
4.1material Properties
M-25 grade of concrete and Fe-415 grade of reinforcing steel are used for all members of the frame structures.
Elastic material properties of these materials are taken as per Indian Standard IS 456 (2000).
4.2 Structural Elements
Two structures representing low rise and high rise reinforced concrete framed buildings are considered in this
study. For the present study, structures with 5 and 12 stories are chosen. These structures are designed according
to Indian Standards. The details of frame structure are as follows:
1. Size of building = 24 m X 12 m (figure 4.1)
2. Floor to floor height = 3.06m.
3. Thickness of slab = 0.11 m.
4. Dead load = 1 X 0.11 X 25 X 1.5 = 4.1 KN/m2
5. Live load = 3 KN/m2 (assume)
6. Modulus of Elasticity (Ec) = =
= 25000000 KN/m2
1. Seismic Coefficient for Response Spectrum method
a) Seismic Zone v
b) Zone Factor 0.36
c) Medium soil, Soil type II
d) Residential building, Importance factor 1
2. The dimensions of the beams and columns for the two reinforced concrete frames are shown in Table
4.1.
Figure 4.1: Plan of Reinforced concrete buildings
Table 4.1.
Beams and column dimensions
Building Beam (m X m) Level Columns (m x m)
5 storey 0.3X0.5 1-3 0.5X0.5
4-5 0.4X0.4
8 storey 0.3X0.5 1-5 0.5X0.5
6-8 0.4X0.4
12 storey 0.3X0.5 1-9 0.7X0.7
124 |
P a g e
4.3modelling ApproachThe general finite element package SAP 2000 (Version.14) has been used for the analyses. A three dimensional
model of each structure has been created to undertake the non linear analysis. Beams and columns are modeled as
nonlinear frame elements with lumped plasticity at the start and the end of each element. SAP 2000 provides
default hinge properties and recommends M3 hinges for columns and M3 hinges for beams as described in
FEMA 356. Fig 4.3 shows the assigned hinges to buildings.
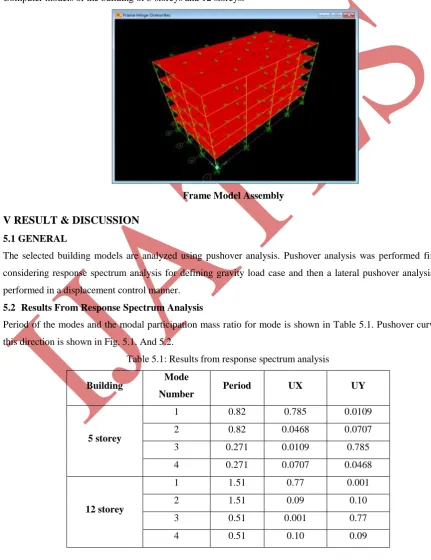
4.5 Building Geometry
The structural analysis program, SAP2000- Version 14 was used to perform analyses. Fig. 4.2 shows 3D
Computer models of the building of 5 storeys and 12 storeys.
Frame Model Assembly
V RESULT & DISCUSSION
5.1 GENERAL
The selected building models are analyzed using pushover analysis. Pushover analysis was performed first by
considering response spectrum analysis for defining gravity load case and then a lateral pushover analysis was
performed in a displacement control manner.
5.2 Results From Response Spectrum Analysis
Period of the modes and the modal participation mass ratio for mode is shown in Table 5.1. Pushover curve for
this direction is shown in Fig. 5.1. And 5.2.
Table 5.1: Results from response spectrum analysis
Building Mode
Number Period UX UY
5 storey
1 0.82 0.785 0.0109
2 0.82 0.0468 0.0707
3 0.271 0.0109 0.785
4 0.271 0.0707 0.0468
12 storey
1 1.51 0.77 0.001
2 1.51 0.09 0.10
3 0.51 0.001 0.77
125 |
P a g e
5.3 Results From Pushover AnalysisBuilding Target
Displacement(m)
Elastic base
shear(KN)
Inelastic base
shear(KN)
5 storey 0.28 m 1621.9 1946.3
12 storey 0.5 m 1707.09 2646
5.3.1 Capacity Curve
The resulting capacity curves for the two buildings are shown in figure 5.1 and fig 5.2 for 5 storeys and 12 storeys
building respectively. Both curves show similar nature. They are initially linear but start to deviate from linearity
as the beams and the columns undergo inelastic actions. When the buildings are pushed well into the inelastic
range, the curves become linear again but with smaller slope. A target displacement of 0.28m for the 5 storey
building, the base shear of whole structure is 1946.3 KN which is equivalent to 1.2 times that of structure under
elastic seismic design. For 12 storeys building, for a target displacement of 0.5m the base shear is 2646 KN
which represents 1.55 times that of elastic base shear.
Fig 5.1 Pushover Curve For 5 Storey Building. Fig 5.2 Pushover Curve For 12 Storey Building.
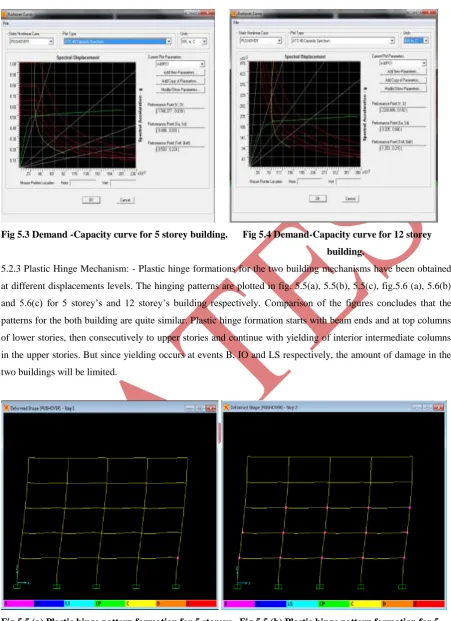
5.2.2 Demand Capacity Curve: The resulting demand- capacity curves for the two buildings are shown in figure
5.3 and fig 5.4 for 5 storey and 12 storey building respectively. From the following curve the performance point
i.e. the point at which capacity curve and demand curve intersects is near to the event point B in both the figures.
126 |
P a g e
Fig 5.3 Demand -Capacity curve for 5 storey building. Fig 5.4 Demand-Capacity curve for 12 storey
building.
5.2.3 Plastic Hinge Mechanism: - Plastic hinge formations for the two building mechanisms have been obtained
at different displacements levels. The hinging patterns are plotted in fig. 5.5(a), 5.5(b), 5.5(c), fig.5.6 (a), 5.6(b)
and 5.6(c) for 5 storey’s and 12 storey’s building respectively. Comparison of the figures concludes that the
patterns for the both building are quite similar. Plastic hinge formation starts with beam ends and at top columns
of lower stories, then consecutively to upper stories and continue with yielding of interior intermediate columns
in the upper stories. But since yielding occurs at events B, IO and LS respectively, the amount of damage in the
two buildings will be limited.
Fig.5.5 (a) Plastic hinge pattern formation for 5 storeys. Fig 5.5 (b) Plastic hinge pattern formation for 5
127 |
P a g e
Fig.5.5(c) Plastic hinge pattern formation for 5 storey building at step 8Fig.5.6 (a) Plastic hinge pattern formation for 12 storey Fig.5.6 (b) Plastic hinge pattern formation for
12 storey building at step 1 building at step 7
Fig.5.6(c) Plastic hinge pattern formation for12 storey building at step 13
VI. CONCLUSIONS
The performance of reinforced concrete frames was investigated using the pushover analysis. As a result of the
work that was completed in this study, the following conclusions were made:
1. Both the pushover curves show no decrease in the load carrying capacity of buildings suggesting good
128 |
P a g e
2. From demand capacity curve it is concluded that both the demand curve intersects the capacity curve near theevent point B. Therefore, it can be concluded that the margin safety against collapse is high and there are
sufficient strength and displacement reserves.
3. The behavior of properly detailed reinforced concrete frame building is adequate as indicated by the
intersection of the demand and capacity curves and the distribution of hinges in the beams and the columns.
Most of the hinges developed in the beams and few in the columns but with limited damage.
4. The pushover analysis is a relatively simple way to explore the non linear behavior of Buildings.
5. A nonlinear static pushover analysis is carried out for evaluating the structural seismic response.
REFERENCES
[1] M.Mouzzoun, O.Moustachi, A.Taleb, S.Jalal, “Seismic performance assessment of reinforced concrete buildings using
pushover analysis” ISSN: 2278-1684 Volume 5, Issue 1 (Jan. - Feb. 2013).
[2] A. Kadid and A. Boumrkik, “Pushover analysis of reinforced concrete frame Structures” Asian journal of civil
engineering” (BUILDING AND HOUSING) VOL. 9, NO. 1 (2008).
[3] Nivedita N. Raut & Ms. Swati D. Ambadkar, “Pushover Analysis of Multistoried Building”, Global Journal of
Researches in Engineering Civil and Structural Engineering Volume 13 Issue 4 Version 1.0 Year 2013.
[4] R. Shahrin & T.R. Hossain, “Seismic performance evaluation of residential buildings in Dhaka city by using
pushover analysis Dhaka, Bangladesh" ISBN: 978-984-33-4363-5 December 22-24, 2011.
[5] Applied Technology Council, “Seismic Evaluation and Retrofit of Concrete Building, ATC-40”, Volume 1and 2,
Report NO.SSC 96-01, Seismic Safety Commission, Redwood City, 1996.
[6] Federal Emergency Management Agency, “NEHRP Guidelines for the Seismic Rehabilitation of Buildings”,