Original Research Article
ICDS: is it reaching the all child beneficiaries?
N. Pragathi Kumar
1, Tagaram Ramchandra
2*
INTRODUCTION
Ministry of women and child development is implementing various schemes for welfare, development and protection of children.1 The Integrated Child Development Services (ICDS) scheme is one of the flagship programmes of the Government of India and represents one of the world‟s largest and unique programmes for early childhood care and development.1 It is the foremost symbol of country‟s commitment to its children and nursing mothers, as a response to the challenge of providing pre-school non-formal education on one hand and breaking the vicious cycle of
malnutrition, morbidity, reduced learning capacity and mortality on the other.1
With wider spread of the scheme, plan allocation, which stood at Rs. 44,400 crores for the eleventh plan has been increased to Rs. 1,03,003 crores for the twelfth plan.1 For the 3rd year of the twelfth plan i.e. for 2014-15, an amount of Rs. 16581.82 crores has been released to States/UTs as on 31.03.2015 against originally budget allocation (BE) of Rs.18195.00 crore.1 This clearly shows a large portion of budget is allotted for ICDS, and it has to reach the beneficiaries for the cost benefit.
ABSTRACT
Background: The beneficiaries under the scheme are children in the age group of 0-6 years, pregnant women and lactating mothers, women in the age group of 15-44 years and adolescent girls in selected blocks. Irrespective of caste, religion, socioeconomic status all beneficiaries are eligible for availing of services under the Integrated Child Development Services (ICDS) scheme. BPL is not a criterion for registration of beneficiaries under ICDS2. Present study is to recognize whether all categories of people are utilizing the services or not irrespective of economic status, religion etc.
Methods: Descriptive observational study done for period of one year, sampling done by multi stage (random) method. Study conducted in ICDS centers in the field practicing area of Kakatiya medical college Warangal, Telangana, India. 622 children from 31 anganwadi centres of 0 to 6 year age were included.
Results: Majority (71.7%) were belongs to „0 to 3‟ years of age group, male (50%) and female (50%) were equally in distribution. majority (78.3%) were Hindus. Majority parents (father-84.9, mother 84.2) were literates and mothers were unemployed/housewives, fathers were skilled workers (28%) followed by farmers (22%). Majority were (35.4%) belonged to middle, followed by lower middle (30.2%) level of socio economic status.
Conclusions: There were less number of 3 to 6 years age category population in the study, means that age group is not getting covered properly by ICDS. Two extremes (higher and lower categories) of education, occupation, socio economic status parents were not properly utilising the ICDS services for their children.
Keywords: ICDS, Anganwadi, Child beneficiaries
Department of Community Medicine, 1Ayaan Institute of Medical Sciences, Kanaka Mamidi, Moinabad, 2Government Medical College, Nalgonda, Telangana, India
Received: 20 July 2019
Accepted: 07 August 2019
*Correspondence:
Dr. Tagaram Ramchandra, E-mail: [email protected]
Copyright: © the author(s), publisher and licensee Medip Academy. This is an open-access article distributed under the terms of the Creative Commons Attribution Non-Commercial License, which permits unrestricted non-commercial use, distribution, and reproduction in any medium, provided the original work is properly cited.
The beneficiaries under the scheme are children in the age group of 0-6 years, pregnant women and lactating mothers, women in the age group of 15-44 years and adolescent girls in selected blocks with main focus on children below 6 years.1 Irrespective of economic status, religion, socioeconomic status, all beneficiaries are eligible for availing of services under the ICDS scheme.2 BPL is not a criterion for registration of beneficiaries under ICDS.2
Rationale of study
Present study is to recognize whether all categories of people are utilizing the services or not irrespective of economic status, religion etc.
METHODS
Study design
This is descriptive observational study, done for period of one year (September 2017 to August 2018).
Study area
ICDS centers in the field practicing area of Kakatiya Medical College, Warangal, Telangana, India. The study was conducted in 31 anganwadi centres covered by 2 ICDS projects each one from urban and rural, out of 18 ICDS projects, in Warangal district.
Study population
622 children from urban (307) and rural (315) anganwadi centres. All 0-6 years of children attending/registered in 31 anganwadi centre were taken as study sample.
Inclusion criteria
Only registered beneficiaries of 0 to 6 years aged children who are present at the time of visiting.
Exclusion criteria
Those who are not presented at the time of study and not given consent and refused to participate in study are excluded.
Sampling method
Multi stage (random) sampling method was adopted for selecting 31 anganwadi centres.
Study tools
Pretested semi structured questionnaire was used. Informed consent was taken from each participant. Questionnaire was translated in local language for communication. Modified B.G. Prasad‟s classification
was used to calculate the socio economic status. Consumer price index of 288 was taken. Categories were V) lower- below 985, IV) lower middle- 986 to 1971, III) middle- 1972 to 3286, II) upper middle- 3287 to 6573, I) upper- above 6574 Rs. per month.
Education classification
Illiterate: who cannot read and write in any language were labelled as illiterate. Less than primary school is who attended school less than 5th class, who can read and write their names.
Primary school completed: subject‟s educated up to 5th class. High school completed- subject‟s education above 5th class up to 10th class.
Higher/secondary complete: subjects studied up to intermediate or 11th and 12th class.
Graduated: subjects completed graduation
Post-graduation: subjects who completed post-graduation.
Type of family classification
Nuclear: a married couple and their children while they are still regarded as dependent.
Joint family: number of married couples and their children who live together in the same household. Three generation family: married children of the couple continue to stay with their parents and have their own children.
Data analysis
Data was entered in MS-excel 2007 and data was analysed using SPSS software Trail version 22. Results were displayed in numbers; percentages only. No statistical tests were done.
RESULTS
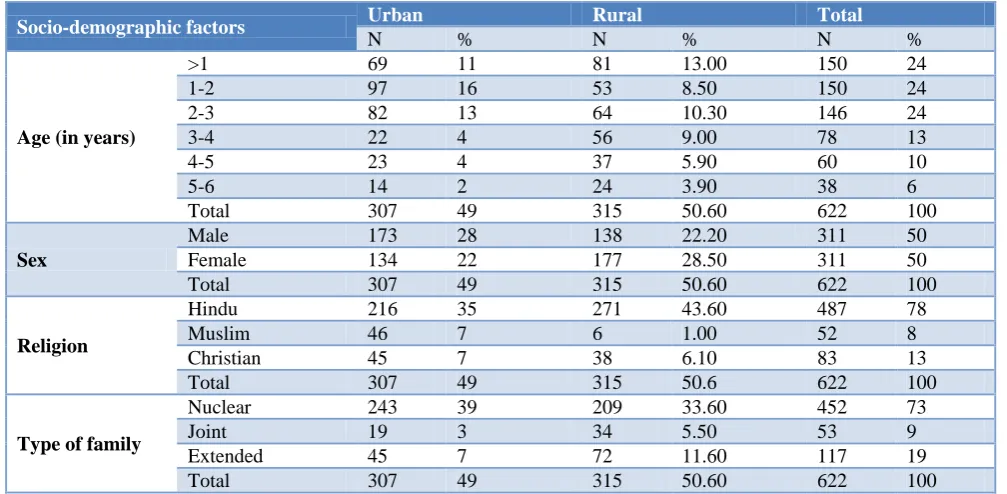
Age: Distribution among the total study population
(total=622, urban=307 and rural=315) majority (71.7%) were belongs to „0 to 3‟ years of age group, and are equally distributed among themselves (24.1%, 24.1%, 23.5%), with minor predominance of „1 to 2‟ age group (15.6%) in urban population. Study population decreases with age after 3 years.
Religion: Among the total study population majority (78.3%) were Hindus followed by (13.3%) Christians and (8.4%) Muslims. Rural area has more of Hindus (86.03%) when compared to urban. Urban area constitutes more of Muslims and Christians (15%, 14.7%) when compared to rural study population.
Type of family: Among the total study population
majority (72.7%)were belonging to nuclear family type. Urban study population constitutes more (79.15%) of Nuclear families when compared to rural study population (Table 1).
Table 1: Distribution of age, sex, religion, type of family among study population.
Socio-demographic factors Urban Rural Total
N % N % N %
Age (in years)
>1 69 11 81 13.00 150 24
1-2 97 16 53 8.50 150 24
2-3 82 13 64 10.30 146 24
3-4 22 4 56 9.00 78 13
4-5 23 4 37 5.90 60 10
5-6 14 2 24 3.90 38 6
Total 307 49 315 50.60 622 100
Sex
Male 173 28 138 22.20 311 50
Female 134 22 177 28.50 311 50
Total 307 49 315 50.60 622 100
Religion
Hindu 216 35 271 43.60 487 78
Muslim 46 7 6 1.00 52 8
Christian 45 7 38 6.10 83 13
Total 307 49 315 50.6 622 100
Type of family
Nuclear 243 39 209 33.60 452 73
Joint 19 3 34 5.50 53 9
Extended 45 7 72 11.60 117 19
Total 307 49 315 50.60 622 100
Table 2: Literacy level among study population.
Urban Rural Total
N % N % N %
Father’s literacy
Illiterate 18 2.90 76 12.20 94 15.10 Primary school 4 0.60 8 1.30 12 1.90 Middle school 22 3.50 51 8.20 73 11.70 High school 112 18.00 82 13.20 194 31.20 Intermediate 50 8.00 54 8.70 104 16.70
Graduate 93 15.00 44 7.10 137 22.00
Post graduate 8 1.30 0 0.00 8 1.30
Mother’s literacy
Illiterate 22 3.50 76 12.20 98 15.80 Primary school 7 1.10 7 1.10 14 2.30 Middle school 44 7.10 37 5.90 81 13.00 High school 88 14.10 111 17.80 199 32.00 Intermediate 79 12.70 58 9.30 137 22.00
Graduate 67 10.80 26 4.20 93 15.00
Post graduate 0 0.00 0 0.00 0 0.00
Father’s literacy: Among fathers of the study, total population majority (84.9) were literates and studied up to high school (31.2%), followed by graduation (22.0%) education level. Rural study population constitutes more (24.1%) of illiteracy level compared to urban.
Mother’s literacy: Among the mothers of total study population, majority (84.2) were literates and studied up to high school (32%), followed by intermediate (22.0%)
education level. Rural study population constitutes more (24.1%) of illiteracy level compared to urban (7.16%) (Table 2)
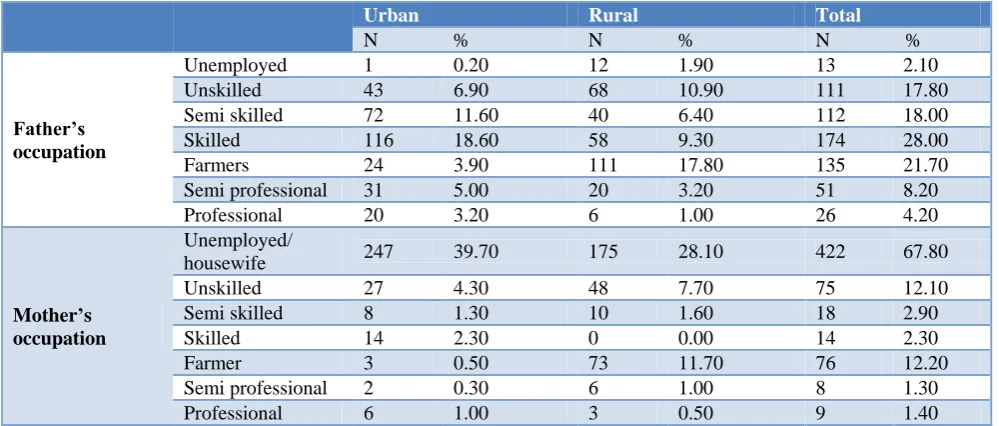
Table 3: Occupation level distribution among study population.
Urban Rural Total
N % N % N %
Father’s occupation
Unemployed 1 0.20 12 1.90 13 2.10
Unskilled 43 6.90 68 10.90 111 17.80 Semi skilled 72 11.60 40 6.40 112 18.00
Skilled 116 18.60 58 9.30 174 28.00
Farmers 24 3.90 111 17.80 135 21.70
Semi professional 31 5.00 20 3.20 51 8.20
Professional 20 3.20 6 1.00 26 4.20
Mother’s occupation
Unemployed/
housewife 247 39.70 175 28.10 422 67.80
Unskilled 27 4.30 48 7.70 75 12.10
Semi skilled 8 1.30 10 1.60 18 2.90
Skilled 14 2.30 0 0.00 14 2.30
Farmer 3 0.50 73 11.70 76 12.20
Semi professional 2 0.30 6 1.00 8 1.30
Professional 6 1.00 3 0.50 9 1.40
Table 4: Socio economic status distribution of study population.
Socio economic status
Modified B.G. Prasad classification
Urban Rural Total
N % N % N %
Upper 23 3.7 3 0.5 26 4.2
Upper middle 37 5.9 35 5.6 72 11.6
Middle 118 19.0 102 16.4 220 35.4
Lower middle 79 12.7 109 17.5 188 30.2
Lower 50 8.0 66 10.6 116 18.6
Total 307 49.4 315 50.6 622 100.0
Mother’s occupation: Among mothers of the total study
population, majority (67.8%) were housewives or unemployed followed by farmers (12.2%) unskilled (12.1%). Urban study population constitutes more of housewives (80.5%) than rural (55.6%) study population (Table 3).
Socio economic status: Among the study population,
majority were (35.4%) belonged to middle, followed by lower middle (30.2%) socio economic status level. Among the rural study population majority (34.6%) belonged to lower middle followed by lower (21%) (Table 4).
DISCUSSION
In the present study, majority (71.7%) of the population belongs to <3 years of age group, and almost equally distributed in between 0-1, 1-2, 2-3 years (24.1%, 24.1%, 23.5%), with slight rise in „1-2‟ years of age group (15.6%) in urban population. Gradual decrease in population in >3 years is observed. In the present study, ICDS project is meeting the goals of NFHS-3 report3 by having large population of <3 years of age group, it‟s may be because of salutary custom of sending them to
kindergarten school or pre nursery school. A similar study done by Jitendra et al was not supporting the present study age distribution, where 3-6 age group was more.4 Another study done by Yesmin et al has most (60%) of the children in rural and urban area belonged to the age group of 12-23 months, this supports present study.5 Take home ration is limited to age group of 0-3 years in icds programme.2 This might be a reason for Gradual decrease in population after 3 years.
distributed, this finding is very much similar to the present study.7 Another study done by Mohammed et al in ICDS centers in rural Bangalore to on children aged 2- 6 years it was found that 49.4% were boys and 50.6% were girls this finding also supports the present study.8 NFHS-3 report also supports the present study, where in ICDS projects male and female were equally (male-86.2% female 86.3%) registered.3
Among study population, majority (78.3%) were Hindus, rural area has more number of Hindus (86.03%) when compared to urban. 2011 India census data says 79.8% were Hindus, thus the present study is similar to the general population of India.9 This is because Hinduism is the major religion in India (also known as „Hindustan‟). In a study done by Mohammed et al in ICDS centers in rural Bangalore on children aged 2- 6 years has 81.6% of Hindus, which supports the present study rural population.8
Among the total study population, majority (72.7%) belong to nuclear family type. Urban study population constitutes more (79.15%) of Nuclear families when compared to Rural (66.35) study population. This trends shows population leaning forward towards nuclear family, due to many reason like migration for education, employment to a new place where they live as nuclear family. In a study done by Brahmam et al of under five year rural children in the districts of Madhya Pradesh state- panna in associated with NIN Hyderabad has results with majority (59%) were nuclear family, which support the present study especially family type proportion of rural population. A study done by I.V. Mamatha et al, on Nutritional Status of Pre-School Children Attending Anganwadi Centres in Tirupati, Andhra Pradesh, About 64% of children were from nuclear family in the rural areas majority children 66% were from joint family.11 This supports the present study urban population but differs with rural population where nuclear families are more.
Regarding educational status of parents, majority (father 84.9, mothers 84.2) were literates and studied up to high school (father 31.2% mother 32%), rural study population constitutes more (24.1%) of illiteracy level compared to urban. In a study done by Brahmam et al on assessment of nutritional status of under five year rural children in the districts of Madhya Pradesh in association with NIN Hyderabadhas nearly similar results in relation to literacy status of father.10 About 65% of the fathers of the index children were literates. About 42% had schooling of 6th-10th class, but 45% of the mothers of the index children were literates. About 15% of them had an education level of 1-5th class, which does not support the present study. In another study conducted by Bant et al, on prevalence of protein energy malnutrition among anganwadi children of Hubli, 30.8% of mother were illiterate, 28.9% studied up to high school.12 A total 35.44% of fathers were educated up to high school and around 26.17% were illiterate. A majority, 91.7% of mother occupation were
housewife, illiteracy rate was higher than the present study, but it supports the percentages of fathers and mothers education up to high school level. Study done by Mittal et al in under five says education of mother significantly influenced the nutritional status of under-fives as the prevalence of under nutrition was 60.9% where mother was illiterate and it was only 21.2% where education level was more than high school, this support the present study.13
In the present study, among the total study population majority of fathers (28.0%) were skilled workers followed by farmer (agricultural labourer) (21.7%), semi-skilled (18%), semi-skilled (17.8%). Rural study population constitutes more of Farmers (agricultural labourer) (35.2%). In a study done by Dattatreya etal, 56.47% of fathers were labourers (agricultural labourer) by occupation, which support the present study.12 In the present study population majority of mothers (67.8%) were housewives/unemployed followed by farmer (agricultural labourer) (12.2%), unskilled (12.1%). Urban study population constitutes more of housewives (80.5%) than rural (55.6%) study population. In a study done by Brahmam et al on assessment of nutritional status in under five year rural children, majority (56%) of mothers were housewives, which supports the present study.10 In other study done by Nagaraja et al, on anganwadi children and ICDS programme in Karnataka state major strata in (58.3%) fathers occupation was under farmer category which supports the present study.14
Socio economic status was calculated by using modified B. G. Prasad scale. Majority (38.4%) belonged to middle, followed by lower middle (30.2%) socio economic status level. Among the rural study population majority (34.6%) belonged to lower middle followed by lower (21%). Due to limitations of Modified B.G. Prasad classification the socio economic status is distributed in middle and lower middle levels equally, actually all are may be in the same level.
study done by Dinna etalabout 32% belongs to class 3 (middle) this supports the present study.12 In ICDS, only supplementary nutrition is given, and that is not replacement of whole nutrition. Major part of nutrition is given at home. Due to their low economic status they can‟t afford to meet the dietary requirement of the child.
CONCLUSION
There were less number of 3 to 6 years age category population attending ICDS/Anganwadi centre in the present study, means that age group is not getting covered properly by ICDS. Two extremes (higher and lower) categories in education, occupation, socio economic status levels of parents were not showing interest in utilising the ICDS services for their children.
Recommendations
It can be improved by extending the supplementary nutrition 3-6 years age category children. Awareness of ICDS/Anganwadi services in parents of two extremes (higher and lower) of education, occupation, socio economic status level of categories by frequent awareness programmes.
ACKNOWLEDGEMENTS
We are very thankful to Dr. Punam Kumari Jha, Professor and HOD of department of community Medicine, Kakatiya Medical College, Warangal, Telangana, India, for the immense support for conducting this study.
Funding: No funding sources Conflict of interest: None declared
Ethical approval: Ethical clearance was obtained from the institution and Director of ICDS Warangal
REFERENCES
1. Integrated Child Development Service Scheme, Ministry of Women & Child Development, India New Delhi, 2012. Available at: www.icds.gov.in/ Accessed on 11 September 2018.
2. Park K. Park‟s Text Book of Preventive and Social Medicine. 24th edition. Jabalpur: Bhanot publications; 2017: 627-630.
3. International Institute for Population Sciences Govandi Station Road, Deonar, Mumbai, Maharashtra, National Family Health survey, NFHS-3 REPORT. Available at: http://rchiips.org/ nfhs/factsheet.shtml. Accessed on 3 June 2019. 4. Surwade JB, Mantri SB, Wadagale AV. Utilization
of ICDS Scheme in Urban and Rural Area of Latur District with Special Reference to Pediatric Beneficiaries. Int J Recent Trends Sci Technol. 2013;5(3):107-10.
5. Yesmin F, Baruah R. A comparative study on gender disparity in nutritional status in children under five years in rural and urban communities of Assam, India. Indian J Community Health. 2014;26(2):1.
6. Bangaruthalli programme scrapped in Telangana (internet- telugu language), Andhrjyoti ABN, Available at: https://www.andhrajyothy.com/artical? SID=240671. Accessed on 13 May 2016.
7. Shanawaz M, Sundar JS. An evaluation of primary immunization coverage among icds children under urban field practice area of osmania medical college, Hyderabad. J Evol Med Dent Sci. 2014;3(4):30.
8. Imran M, Subramanian M, Subrahmanyam G, Seeri J, Pradeep C, Jayan M. Impact of nutrition education and supplementary nutrition under ICDS scheme on nutritional status of preschool children in rural field practice area. National J Community Med. 2014;5(1):109.
9. Rao BV (Mumbai), first post.com “India has 79.8% Hindus, 14.2% Muslims, says 2011 census data on religion” Aug 26, 2015 10:30 IST Available at: http://www.firstpost.com/india/india-has-79-8- percent-hindus-14-2-percent-muslims-2011-census-data-on-religion-2407708.html. Accessed on 3 June 2019.
10. Brahmam GNV, Venkaiah K, Laxmaiah A, Meshram II, Rao KM, Reddy CG, et al. Assessment of Nutritional Status of under five year rural children in the Districts of Madhya Pradesh State- Panna district. National Institute of Nutrition, Indian Council Med Res. 2011.
11. Mamatha IV, Reddy NK. Nutritional Status Of Pre-School Children Attending Anganwadi Centres In Tirupati, Andhra prades, India. IOSR J Nursing Health Sci. 2015;4:139-43.
12. Dattatreya D, Gajula M, Bathija GV, Bant, Lokare L, Godbole M, et al. Protein energy malnutrition: knowledge of the mother a significant associate of child‟s nourishment status, a study among 1-6 year children and their mothers in urban slums of old hubli. J Evol Med Dent Sci. 2014: 14194.
13. Mittal A, Sing J. Effect of maternal factors on nutritional status of 1-5-year-old children in urban slum population. Indian J Community Med. 2007;32:264-7.
14. Nagaraja GM, Anil, Ravishankar S, Muninarayana C. Building Social Relationships and Health Habits at Anganwadi center: A Sociological Study of Anganwadi Children and I.C.D.S. Programme, Kolar District, Karnataka State. Int J Humanities Social Sci Invention. 2014;3(5):32-6.
15. Ramesh N, Masthi NR, Gangaboraiah, Kulkarni P. An exploratory study on socio economic status scales in a rural and urban setting. J Family Med Primary Care. 2013;2(1):69-73.