IJSRSET173177 | Received : 15 Sep-2016 | Accepted : 09 Oct-2016 | September-October-2016 [(2)6: 533-549 ]
© 2016 IJSRSET | Volume 2 | Issue 5 | Print ISSN: 2395-1990 | Online ISSN : 2394-4099 Themed Section: Engineering and Technology
549
Detection and Classification of Cervical Cancer in Pap Smear
Images using EETCM, EEETCM & CFE methods based Texture
features and Various Classification Techniques
S. Athinarayanan
1, Dr. M. V. Srinath
2, R. Kavitha
31Research Scholar, Manonmaniam Sundaranar University, Abhisekapatti, Tirunelveli, Tamil Nadu, India 2Director, Department of MCA, STET Women’s College, Mannargudi, Trichy, Tamil Nadu, India
3Assistant Professor, Department of BCA, The MDT Hindu College, Pettai, Tamil Nadu, India
ABSTRACT
Cervical cancer is the second most common gynaecologic cancer worldwide. Unlike the other cancers it does not show any symptoms in its earlier stage which causes mortality among women. It takes 8 to 10 years to develop from precancerous to severe stage. The important reasons for higher cervical cancer in developing countries are lack of resources, lack of effectual screening programs and inadequately organized health system aimed for detecting precancerous condition before they progress to persistent cancer and also 80% of cervical cancers are incurable at the time of detection due to their advanced stage. Therefore, early detection of cervical cancer is more important for reducing the mortality rate of the women. Thus, the aim of this paper is to investigate about the classification of cervical cell as Normal Cell or Abnormal Cell by using individual feature extraction method and combining individual feature extraction features method with the classification technique. In this paper, we proposed three novel feature extraction methods. From that three, two were individual feature extraction methods, they are Extending Enriched Texton Occurrence Matrix (EETCM) and Effective Extending Enriched Texton Co-Occurrence Matrix (EEETCM) and the remained one was combining individual feature extraction features method named as Concatenated Feature Extraction (CFE). The CFE method represents combining all the individual feature extraction methods of EETCM, EEETCM features into one feature to assess their joint performance. Then these three feature extraction methods are tested over two classifiers: Kernel Support Vector Machine (K-SVM) and Support Vector Machine (SVM). This Examination was conducted over a set of single cervical cell based pap smear images. The dataset contains two classes of images, with a total of 952 images. The distribution of number of images per class is not uniform. Then, the performance of the proposed system was evaluated in terms of the statistical parameters of sensitivity, specificity & accuracy in both the individual feature extraction & classification combinations and combining all the individual feature extraction features method and classification combinations. Hence, the performance of individual combination method described, the proposed EEETCM features with Kernel SVM Classifier combination had given the better results than the other combinations such as EEETCM with SVM Classifier, EETCM with Kernel SVM Classifier, EETCM with SVM Classifier. Then the performance of combining all the individual feature extraction method and classification combination described, proposed Concatenated Feature Extraction (CFE) with Kernel SVM Classifier had given the better results than CFE with SVM Classifier and all other individual feature extraction and classification combinations.
Keywords: Cervical Cancer, Feature Extraction, Classification.
I.
INTRODUCTION
Cancer can start any place in the body. It starts when cells grow out of control and crowd out normal cells.
parts of the body.[3] Early on, typically no symptoms are seen. Later symptoms may include abnormal vaginal bleeding, pelvic pain, or pain during sexual intercourse.[2] While bleeding after sex may not be serious, it may also indicate the presence of cervical cancer [4].
Human papillomavirus (HPV) infection appears to be involved in the development of more than 90% of cases [5][6]. Most people who have had HPV infections, however, do not develop cervical cancer [7][8]. Other risk factors include smoking, a weak immune system, birth control pills, starting sex at a young age, and having many sexual partners, but these are less important.[2][9] Cervical cancer typically develops from precancerous changes over 10 to 20 years [7]. About 90% of cervical cancer cases are squamous cell carcinomas, 10% are adenocarcinoma, and a small number are other types.[9] Diagnosis is typically by cervical screening followed by a biopsy. Medical imaging is then done to determine whether or not the cancer has spread [2].
Cervical screening is the process of detecting and removing abnormal tissue or cells in the cervix before cervical cancer develops.[10] By aiming to detect and treat cervical neoplasia early on, cervical screening aims at secondary prevention of cervical cancer.[11] Several screening methods for cervical cancer are the Pap test (also known as Pap smear or conventional cytology), liquid-based cytology, the HPV DNA testing and the visual inspection with acetic acid. Pap test and liquid-based cytology have been effective in diminishing incidence and mortality rates of cervical cancer in developed countries but not in developing countries.[12] Prospective screening methods that can be used in low-resource areas in the developing countries are the HPV DNA testing and the visual inspection.[13]
The Papanicolaou test (abbreviated as Pap test, known earlier as Pap smear, cervical smear, or smear test) is a method of cervical screening used to detect potentially pre-cancerous and cancerous processes in the cervix (opening of the uterus or womb). Abnormal findings are often followed up by more sensitive diagnostic procedures, and, if warranted, interventions that aim to prevent progression to cervical cancer. The test was invented by, and named for, the prominent Greek doctor Georgios Papanikolaou [14].
Pre-processing is an improvement of the image data that suppresses unwilling distortions or enhances some image features important for further processing, although geometric transformations of images (e.g, rotation, scaling, translation are classified among pre-processing methods here since similar techniques are used [15].
Segmentation is the most important part in image processing. Fence off an entire image into several parts which is something more meaningful and easier for further process. These several parts that are re-joined will cover the entire image. Segmentation may also depend on various features that are contained in the image. It may be either color or texture [16]. Feature extraction involves reducing the amount of resources required to describe a large set of data. When performing analysis of complex data one of the major problems stems from the number of variables involved. Analysis with a large number of variables generally requires a large amount of memory and computation power, also it may cause a classification algorithm to over fit to training samples and generalize poorly to new samples. Feature extraction is a general term for methods of constructing combinations of the variables to get around these problems while still describing the data with sufficient accuracy [17].
Image classification is a complex process that may be affected by many factors [18]. Binary classification is one of the method which classifies the elements of a given cell into two groups based on the classification rule. Binary classification is one of the characteristic method used to determine if the patient which has been affected by the cancer [19]. Principally classification process focussed the detection of cancer with the help of pap smear screening test results. But, it is difficult to detect the critical stage of the cancer from the pap smear screening test images.
II.
METHODS AND MATERIAL
1. Related Works
CT, MRI, etc. can be used with image processing techniques to get the staging of disease. Transform features such as contour let and Gabor features mainly based on energy are used for the prediction of output. Second-order statistical features based on contrast, correlation, energy and homogeneity are significantly used to predict outcome from pre-treatment MR images of cervical cancer [20].
B. Ashok.et al. proposed the diagnosis method using cervical cell image which is obtained by Pap smear test. Image segmentation performed by multi-thresholding method and texture and shape features are extracted related to cervical cancer [21]. JieSu.et al. proposed a two-level cascade integration system of two classifiers to classify the cervical cells into normal and abnormal cells [22]. Several new image processing algorithms to reduce these constraints. The Adaptive Fuzzy-k-Means (AFKM) clustering algorithm is proposed to replace the Moving k-Means (MKM) to segment Pap smear images into the nucleus, cytoplasm and background regions. Next, the feature extraction algorithm based on pseudo colouring called the Pseudo Colour Feature Extraction (PCFE) manual and Semi-Automatic PCFE are designed to replace the Region Growing Based Feature Extraction (RGBFE) which uses monochromatic images [23].
Among the number of screening methods, cytology based screening using Pap smear test is by far the most widely followed and accepted method [24]. Early detection of cervical cancer using Pap smear images. Regular Pap smear screening is the most successful attempt of medical science and practice for the early detection of cervical cancer. Manual analysis of the cervical cells is time consuming, laborious and error prone. This paper presents an algorithm for classifying Cervical cells as normal or abnormal [25]. The manual screening method of cervical cancer with several methods suffers from accurate results and also time consuming. The computerized methods of classification are used for differentiating the normal and abnormal cells of the cervical cancer [26].
A novel approach to classify the various malignancies in cervical images using acoustic shadowing. For classification we have used SVM classifier that would help us to classify the stages of the cancer and help the pathologist detect the cancer better [27]. To identify cervical cytology image as a representative of the
normal or malignant cancer cell. Features of the nucleus and cytoplasm of cervical cell images are extracted after pre-processing and segmentation. Appropriate and adequate features are selected by mining techniques. This feature set is fed to classifiers to decide nature of the cell [28]. Neural networks to be used as cervical cancer diagnostic system, the features of cervical cell are used as inputs for neural networks and the classification of cervical cell type are used as output target [29].
2. Proposed Methodology
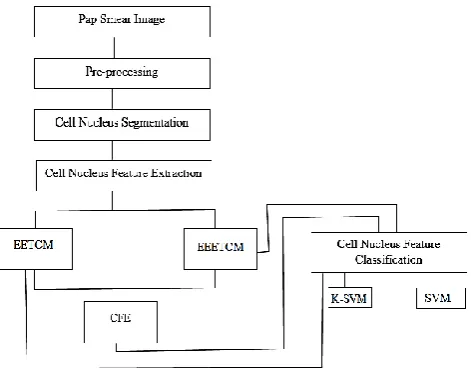
The framework for the proposed methodology shown in given figure 1.
Figure 1. Proposed Methodology
The Proposed Methodology Consists of four number of process.
That is
1. Pre-processing.
2. Nucleus Segmentation. 3. Nucleus Feature Extraction. 4. Nucleus Feature Classification.
The brief details of the above process are given below.
2.1. Pre-processing:
be given directly applying the segmentation process. Since, these images are passed through an anisotropic filter which diminishes the noise and enhances the image quality. Anisotropic filter is used for reducing image noise without removing significant parts of the image content, particularly the edges, lines or other details that are important for the interpretation of the image [30].
2.2. Nucleus Segmentation
The cervical cell nucleus segmentation process consists of two stages such as
i) Image binarization using thresholding.
ii) Sharpening the region using morphological operations.
2.2.1 Original image is convert into a binary image by thresholding
Initially, the input image is transformed into a binary image. An image of up to 256 gray levels is translated to a black and white image using the threshold value. The gray level value of every pixel in the improved image is considered at this stage. All the pixels with values above the threshold are set as white and the remaining pixels are set as black in the image during the binarization process. In this paper, the threshold value is selected based on the contrast of the image as given in eqn (1).
Binarized Image,
… (1)
2.2.2 Sharpening the nucleus region using Morphological operation
After transforming into binary images, the morphological process is applied for sharpening the regions and filling the gaps. The main processes of the morphological operations are opening, closing, erosion and dilation. In this paper, erosion operation is applied for removing the hurdle, noise and enhances the image. Erosion: In the erosion operation on an image having labels 0 and 1 with structuring element , the
value of pixel in is changed from 1 to 0, if the
result of convolving with , centered at , is below
some predefined value. We have set this value to be the area of , which is principally the number of pixels that are 1 in the structuring element itself. The structuring element, also known as the erosion kernel, finds out the details of how particular erosion thins boundaries as given in eqn (2).
.
……. (2)
Then the final sharpened nucleus mask of the binary image is mapped with the original image means to get the segmented nucleus from the original pap smear image.
2.3. Nucleus feature Extraction:
The process of extracting the features of the high contrast image sequence in a temporal frame with gray scale reference information for text block detection in both horizontal and vertical edge scanning of adjacent text block in a multi-resolution fashion are considered as feature extraction. It extracts information grounded on maximum gradient difference. The purpose of feature extraction is to reduce the original data set by measuring certain properties, or features, that distinguish one input pattern from another pattern. The extracted feature is expected to provide the characteristics of the input type to the classifier by considering the description of the relevant properties of the image into a feature space. In this paper, we proposed three novel feature extraction methods. From that three, two were individual feature extraction methods, they are Extending Enriched Texton Co-Occurrence Matrix (EETCM) and Effective Extending Enriched Texton Co-Occurrence Matrix (EEETCM) and the remained one was combining individual feature extraction features method named as Concatenated Feature Extraction (CFE). The CFE method represents all the individual feature extraction methods of EETCM & EEETCM features are combining together to one feature to assess their joint performance. The types of individual and combining individual feature extraction features method is given below.
Individual Feature Extraction Methods:
Computation of Feature Vector F(V1) using EETCM.
Computation of Feature Vector F(V2) using EEETCM.
Otherwise
Threshold y
k B if y
k
BBinary grey
, 1
) , ( ,
0 ) , (
F
Yi
F
Y
F
iY
( , )
Combining Individual Feature Extraction Features Method:
Computation of Feature Vector F(V4) using CFE.
The detailed Process of the above feature extraction method is given below.
3. Individual Feature Extraction Methods
3.3.1. Computation of Feature Vector F(V1) using EETCM:
Texton is one of the very important concepts for texture analysis, it was developed 20 years ago [31]. It is a set pattern sharing a common property all over the image.
According to the neuropsychological findings, different types of incentive are processed disjoint, yet concurrently, by dissimilar neural mechanism previously to the stimulus are intentionally perceived as a whole. In this proposed method, feature extraction process is done with the help of Extending Enriched Texton Co-occurrence Matrix (EETCM). In this method, both Histogram and co-occurrence matrix are used for feature extraction process. The relationship between the values of neighbouring pixels is characterized by TCM. Histogram based techniques are simple to compute, but highest indexing performance. The co-occurrence matrix directly uses a feature representation of the image. If the dimension of the image is high, then the performance is decreased. The spatial information is lost when the histogram is used only for feature representation of the image [32]. Hence combine both the histogram and co-occurrence matrix for feature extraction and representation.
Texton Detection
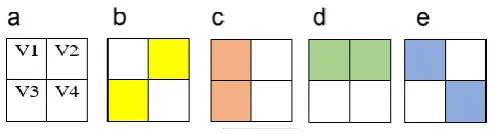
The Texton template defined in EETCM are different from those in TCM. In this paper, four special texton types are defined on a 2 x 2 grid, as shown in figure.2. Denote the four pixels as V1, V2, V3 and V4. If the two pixels highlighted in the gray color have the same value, the grid will form a texton. Those 4 texton types are denoted as T1, T2, T3 & T4, respectively.
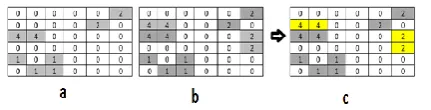
The Working Mechanism of Texton detection is illustrated in figure.3. In the final segmented nucleus mapped with the original image, we move 2 x 2 block from left to right and top to bottom throughout the
image to detect textons with 2 pixel as step length. If a texton is detected, the detected pixel pair values in the 2 x 2 grids are kept unchanged. Otherwise it will have the zero value. Finally we will obtain a Texton image, denoted by T(x,y). This process results was shown in figure.3(a-e). After the formation of final texton image, the feature vector F(V1) (Five features such as, ASM, entropy, IDM, contrast and Maximum probability) is extracted from it.
Figure 2. Special texton types of EETCM ( a) original 2x2 matrix (b)Texton T1 (c) Texton T2 (d) Texton T3 (e)
Texton T4
Figure 3. Texton image formation process using EETCM (a) 2x2 Matrix (b) Original image intensity value (c) Texton location of the original image (d) Four
texton types (e) Final texton image of EETCM.
The four texton types used in EETCM contain richer information than those in ETCM because the co-occurring probability of two same-valued pixels is bigger than that of three or four same-valued pixels in a 2 x 2 grid. As for the texton detection procedure, EETCM is also faster than ETCM. In the texton detection of ETCM, the 2 x 2 grid moves throughout the image with one pixel as the step-length, and the detected textons in a neighborhood may overlap. The final texton image needs to be fused by the overlapped components of textons, and this will increase the computational complexity. Therefore, our proposed EETCM method, the step- length is set to two pixels to reduce the computational cost.
3.3.2. Computation of Feature Vector F(V2) using EEETCM:
information that lost. so there are 6 textons. The new textons are horizontal bottom and vertical right. The aim of this method is addition to prevent the loss of information when pixels are co-occurred on horizontal bottom and vertical right.
Texton Detection
The Texton template defined in EEETCM are different from those in EETCM. In this method, six special texton types are used. defined on a 2 x 2 grid, as shown in figure.4(a-e). Denote the four pixels as V1, V2, V3 and V4. If the two pixels highlighted in the gray color have the same value, the grid will form a texton. Those 6 texton types are denoted as T1, T2, T3, T4, T5 & T6, respectively. From this 6 textons, four textons (T1,T2,T3 & T4) are used for ETCM method. T5 & T6 additionally added new textons.
The Working Mechanism of Texton detection is illustrated in figure.5. In the final segmented nucleus mapped with the original image, we move 2 x 2 block from left to right and top to bottom throughout the image to detect textons with 2 pixel as step length. If a texton is detected, the detected pixel pair values in the 2 x 2 grids are kept unchanged. Otherwise it will have the zero value. Finally we will obtain a Texton image, denoted by T(x,y). This process results was shown in figure.5(a-e). After the formation of final texton image, the feature vector F(V2) (Five features such as, ASM, entropy, IDM, contrast and Maximum probability) is extracted from it.
Figure 4. Special texton types of EEETCM ( a) original 2x2 matrix (b)Texton T1 (c) Texton T2 (d) Texton T3 (e)
Texton T4 (f) Texton T5 (g) Texton T6.
Figure 5. Texton image formation process using EEETCM (a) 2x2 Matrix (b) Original image intensity value (c) Texton location of the original image (d) Four
texton types (e) Final texton image of EEETCM.
The six texton types used in EEETCM contain rich information than those in EETCM because the co-occurrence probability of two same-valued pixels is bigger than that of three or four same-valued pixels in a 2 x 2 grid. As for the texton detection procedure, the computational complexity of proposed EEETCM is slightly slower than EETCM because of additional added 2 textons, but in terms of the effective texture information extraction for the same 2 textons of horizontal bottom and vertical right, the proposed EEETCM will better than EETCM.
Difference between EEETCM and EETCM in Texton Detection and Computational Complexity
The six texton types used in EEETCM contain rich information than those in four texton types of EETCM because of additionally added two textons of horizontally bottom and verticle right extracting more information than EETCM. As for the texton detection procedure, the computational complexity of proposed EEETCM is slightly slower than EETCM because of the same 2 textons, but in terms of the effective texture information, the proposed EEETCM will produce better result than EETCM. This Result was shown in figure 6.
Figure 6. The Result of Texton detection a) EETCM b) EEETCM c) Difference between EEETCM & EETCM.
Combining Individual Feature Extraction Features Method
3.3.3. Computation of Feature Vector F(V3) using CFE:
Summary of Texture Features
The three feature extraction methods and its features details are given in the following table 1.
Table.1. Features Summary Table.
Feature category
Features Number of features
EETCM ASM, Entropy, IDM, Contrast,
Maximum Probability.
5 features
EEETCM ASM, Entropy, IDM, Contrast,
Maximum Probability.
5 features
CFE The features of EETCM &
EEETCM
10 features
4. Nucleus feature Classification:
The individual feature extraction methods of EETCM & EEETCM & combining individual feature extraction features method (CFE) features are tested over two classifiers such as Kernel based Support Vector Machine (K-SVM) and Support Vector Machine (SVM). The result of this classifiers represent classifies the cervical cell as normal cell or abnormal cell. This Examination was conducted over a set of single cervical cell based pap smear images. The dataset contains two classes of images, with a total of 952 images. From that 952 images normal cell images were 440 & abnormal cell images were 512 images.
4.1. Feature Classification using K-SVM:
After feature extraction process, In-order to detect the presence of the cancer in the pap smear image, we perform the final classification step. Proposed system used kernel based SVM for binary classification of pap smear image as normal or abnormal. SVM basically tries to divide the given data into decision surface. Decision surface is a hyper-plane which divides the data into two classes. Training points are the supporting vector which defines the hyper-plane. The basic theme of SVM is to maximize the margins between two classes of the hyper-plane [33 & 34].
Given training vectors X i R n , i =1, 2,...m and a
vector of labels Yi R m , i -1,+1, SVM provides
the optimal hyperplane f ( X )=W T. X + b that aims to
separate the training patterns. In the case of linearly separable classes this hyperplane maximizes the sum of the distances to the closest positive and negative training patterns. This sum is called margin. To construct the maximum margin or optimal separating hyperplane, we need to classify correctly the vectors Xi of the training set into two different classes Yi using the smallest norm of coefficients W.
For a nonlinear classifier, SVM maps the data points into a higher dimensional space H, where a separating hyperplane with maximal margin is constructed. The following quadratic optimization problem has to be solved
Min(𝜔, 𝑏, 𝜉)1 2∥ 𝒲 ∥
2 + 𝐶 ∑ 𝜉 𝑖 𝑚
𝑖=1 Subject to
𝑌𝑖. (𝑊𝑇. 𝜙(𝑋𝑖) + 𝑏) ≥ 1 − 𝜉𝑖 , 𝑖 = 1,2, … . 𝑚, 𝜉𝑖 ≥ 0, 𝑖
= 1,2, . . 𝑚
Where training data are mapped to the higher dimensional space H by the function 𝑋 → 𝜙(𝑋)𝜖𝐻 A set of slack.
Variables 𝜉 is introduced for each training vector and C is a penalty parameter on the training error. Under this mapping the solution of an SVM has the form:
𝑓(𝑥) = 𝑠𝑖𝑔𝑛 (∑ 𝑌𝑖 𝑚
𝑖=1
𝛼𝑖 𝜙(𝑋). 𝜙(𝑋𝑖) + 𝑏)
As can be seen, it is sufficient to compute the scalar products of the form. A kernel function 𝐾(𝑋, 𝑌) = 𝜙(𝑋). 𝜙(𝑌) which defines an inner product in H performs the respective mapping leading to the following decision function f(x):
𝑓(𝑥) = 𝑠𝑖𝑔𝑛 (∑ 𝑌𝑖 𝑚
𝑖=1
𝛼𝑖𝐾(𝑋, 𝑋𝑖) + 𝑏)
𝑀𝑎𝑥(𝛼) ∑ 𝛼𝑖−
1 2
𝑚
𝑖=1
∑ 𝛼𝑖𝛼𝑗𝑌𝑖𝑌𝑗 𝑚
𝑖,𝑗=1
𝐾(𝑋𝑖𝑋𝑗)
Subject to:
∑ 𝛼𝑖𝑌𝑖 = 0, 𝑚
𝑖=1
0 ≤ 𝛼𝑖 ≤ 𝐶, 𝑖 = 1,2 … 𝑚
There are several common kernel functions namely,
Linear: 𝑦𝑖. 𝑦𝑗
Polynomial of degree: 𝑑 ∶ (𝑦𝑖. 𝑦𝑗+ 1)𝑑,
Radial Basis Function (RBF): 𝑒𝑥𝑝 [−∥𝑦𝑖−𝑦𝑗∥2
2𝜎2 ]
4.2. Feature Classification using SVM
The SVM has been widely used in pattern recognition applications due to its computational efficiency and good generalization performance. It is widely used in object detection and recognition, content-based image retrieval, text recognition, biometrics, speech recognition, etc. It creates a hyperplane that separates the data into two classes with the maximum margin. Originally it was a linear classifier based on the optimal hyperplane algorithm. A support vector machine searches an optimal separating hyper-plane between members and non-members of a given class in a high. In SVMs, the training process is very sensitive to those training data points which are away from their own class. A Support Vector Machine (SVM) is a classification model that finds an optimal separating hyperplane that discriminates two classes. An SVM is a linear discriminator; however, it can perform non-linear discriminations as this is a kernel method [35]. A special property of SVM is that it can simultaneously minimise the empirical classification error and maximise the geometric margin of a classifier. It is a powerful methodology for solving problems in nonlinear classification, function estimation and density estimation, leading to many applications including image interpretation, data mining, biometric authentication, biotechnological investigation and other electrical applications [36]. The Support Vector Machine has become one of the most popular classification methods in medical applications. The main objective of SVM is to orient the separating of the hyperplane to a direction that
maximises the distance between the support vectors of each class and the hyperplane [37].
Theory of linear separable binary classification
In this study Pap smear images were categorized into two classes normal and abnormal, this kind of situation is described as classification problems. Classification of two class data is called binary classification and can be described as follows.
Assume that we have set of labelled objects denoted by the order pairs (xi,yi), i = 1… n where (xiR) are
known as feature vectors and yi{-1,+1} are class
labels. The classification task is to generate the rule that assigns any new object (point) x to one of the classes.
The support vector Machine has become one of the most popular classification methods in medical applications.
Assume that the data is linear separable, so a line can be drawn in a graph of x1vs. x2 just having only two
features, likewise a hyperplane can be drawn on a graph of x1,x2….xD … when D>2. That hyperplane is
given by eqn (3)
wtx + b = 0 (3)
Where w is the normal vector of the hyperplane, and
the term 𝑏
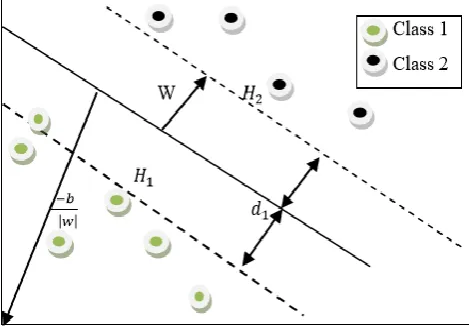
Figure 7. Illustration on how two classes can be separated by hyperplane
Figure.7 depicts that implementing a support vector machines (SVM) can be cut down to selecting the appropriate values of the variables w and b. Hence the training data for two classes can be described as follows in eqn (4 & 5):
wT.x
i+b≥+1 (4)
For yi=+1
For wT.x
i+b≤-1 (5)
yi=-1 (6)
The generalization of these formulas can be given as follows:
yi (wT.xi+b)-1≥0 Ɐi
The two planes containing the support vectors for the classes 1 and 2 are named as H1 and H2 respectively,
these two planes can be computed as follows in eqn (7 & 8).
wT.x
i+b=+1 (7)
For H1
wT.x
i+b=-1 (8)
For H2
The variable d1 and d2 are the perpendicular distances
of separating hyperplanes to h1 and h2 respectively and
are known as SVM margins. The SVM aims to orient the hyperplane in a way that it maximizes the margin.
This margin is equal to 1
∥𝑤∥ . To maximize this margin it is necessary to minimize ∥ 𝑤 ∥, the maximization of the margin of separation between binary classes is equivalent to minimizing the Euclidean norm of weight vector w [39].
III.
EXPERIMENTAL RESULTS AND
DISCUSSION
1. Experimental image Data Set
For any machine learning algorithm, the database with which it is trained plays an important role. It is said that a machine can be made to learn and reproduce any human behaviour, provided it is trained with suitably precise database. The database prepared in this work consists of two classes of normal and abnormal cell based 952 single cervical cell presented in pap smear images. In this study two classes of single cell cervical cyto smear images totally 400 images (200 abnormal Images and 200 normal Images) have been used, which were derived from Pap smear tests collected in 2013 at Muthamil Hospital, Tirunelveli District, Tamilnadu State, India. From these 200 abnormal and 200 normal images, 100 abnormal images and 100 normal images were used for training phase. Remaining 100 abnormal and 100 normal images used for testing phase. The images were taken with 100X lens magnification using Olympus ch20i Microscope. Each image was examined and diagnosed by pathologists of that hospital before being used as reference for this study. The Sample Image data sets are shown in the table 2. The Implementation was done in the tool of matlab.
Sample Data Sets
Abnormal Images
Table 2.
Sample Image Data Set
Note:
For the purpose of Images included in this table were slightly scaled.
2.
ExperimentalResults
In this Experimental Result Section as per the three process of this paper which was referred in our
previous section (2.1 & 2.2), collected images could be processed. The Result was given in following
table.3.
Image No
Image Name
Original Image Gray Scale Image Binary Image Nucleus Segmented Gray Scale image 1 Smear 234
2 Smear 235
3 Smear 236
3. Comparative Analysis
3.1 Individual feature Extraction and Classification Combination Method:
In this paper we proposed, two individual feature extraction methods features are used. That methods are namely EETCM & EEETCM and these two methods features are evaluated by two classification techniques such as K-SVM & SVM. Hence, this individual method features with Classifier performance evaluation of this work is conducted with widely used statistical measures, sensitivity, specificity, accuracy and error rate [40]. TP = True Positive is correctly classified the cell as
abnormal cell. FN = False Negative is incorrectly classified the cell as no cancer. FP = False Positive is incorrectly classified the cell as cancer. TN = True Negative is correctly classified the cell as no cancer.
Higher values of sensitivity, the proportion of correctly classified positives, indicate better performance of the method in predicting positives. Specificity measures how well the system can predict the negatives. Accuracy measures the overall correctness of the classifier in predicting both positives and negatives, and overall error rate is calculated as per the following eqn(9-12).
….. (9)
FN) TP/(TP y
Sensitivit
5 Smear 238
6 Smear 239
7 Smear 240
8 Smear 241
9 Smear 242
10 Smear 243
…..(10)
…(11) Error rate = 1 – Accuracy …..(12)
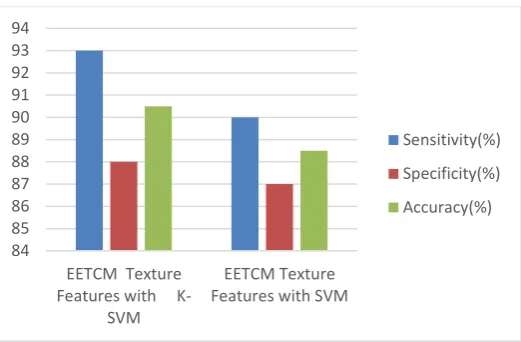
The performance analysis has been made by plotting the graphs of evaluation metrics such as sensitivity, specificity, accuracy and the error bar details of the EETCM features with Classifier and EEETCM features with Classifier are shown in respective tables.3 & 4 and also these results based graphical charts are shown in the figures.8-11).
Table 4. EETCM features with K-SVM & SVM Classifiers.
Table 5. EEETCM features with K-SVM & SVM Classifiers
Figure 8. Graphical Analysis for EETCM features and its Classification
Figure 9. Graphical Analysis for EEETCM features and its Classification
Figure 10. Graphical Representation for Error rate of EETCM features and its Classification
Specificity TN/(TNFP) FP) FN TP TP)/(TN TN
Accuracy (
84 85 86 87 88 89 90 91 92 93 94
EETCM Texture Features with
K-SVM
EETCM Texture Features with SVM
Sensitivity(%)
Specificity(%)
Accuracy(%)
80 82 84 86 88 90 92 94 96
EEETCM Texture Features with
K-SVM
EEETCM Texture Features with SVM
Sensitivity(%)
Specificity(%)
Accuracy(%)
0 2 4 6 8 10 12 14
EETCM Texture Features with K-SVM
Figure 11. Graphical Representation for Error rate of
EEETCM features and its Classification
From the results was shown in the tables (4&5) and graphs (8-11), the proposed EEETCM features with K-SVM Classifier combination had given the better results in the statistical parameters of sensitivity, specificity, accuracy and error rates than the other combinations such as EEETCM with SVM Classifier, EETCM with K-SVM Classifier & EETCM with SVM Classifier.
Combining Individual Feature Extraction features and Classification Combination Method
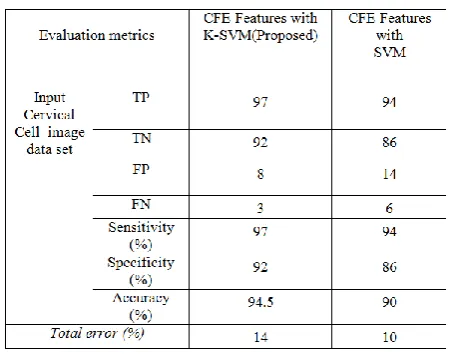
In this combining individual feature extraction methods of EETCM and EEETCM features are concatenated to each other and evaluating the performance with the classification methods of K-SVM & K-SVM. This method is called as Concatenated Feature Extraction (CFE) method. The performance of this features with classification methods based Evaluation Metrics table is given in table.6 and its graphical representation is given figure.12 & 13.
Table 6. CFE features with K-SVM & SVM Classifiers.
Figure 12. Comparison result analyses of Concatenated Texture features (CFE) with K-SVM
and SVM.
Figure 13. Graphical Representation for Error rate of CFE features and its Classification:
From the above results, proposed Concatenated Feature Extraction (CFE) method with SVM Classifier had given the better results in the statistical parameters of sensitivity, specificity, accuracy and error rates than all other remained CFE method with classifier combinations. and also all other individual feature extraction and classification combinations.
Comparative analysis using the K-fold
cross-validation method
This section presents the performance analysis of the proposed system (Individual features with classification system and concatenated features with classification System) using K-fold cross-validation method [41]. According to this, the original data set of 400 images is divided into k subsets (k=20) of data and for every validation, a single subset is used as the testing data and the remaining subsets are utilized as training data. This procedure is repeated until all the subsets of data utilized as testing data. Here, we have chosen k=20 so 0
2 4 6 8 10 12
EEETCM Texture Features with K-SVM
EEETCM Texture Features with SVM
Error Rate (%)
80 82 84 86 88 90 92 94 96 98
CFE Texture Features with
K-SVM
CFE Texture Features with SVM
Sensitivity(%)
Specificity(%)
Accuracy(%)
0 2 4 6 8 10 12 14 16
CFE Texture Features with K-SVM
CFE Texture Features with SVM
that, the input data are divided into ‘20’ sub-samples to extensively analyze the proposed system. The obtained experimental results of the proposed individual and combining individual features methods were compared with the existing results in terms of the resulting parameters of sensitivity, specificity and accuracy using k-fold cross validation method.
Individual feature extraction method and classification combination
Sensitivity Validation
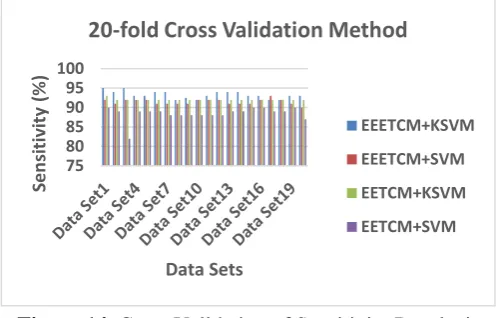
It can be observed that the sensitivity of the proposed EEETCM+K-SVM method for the dataset 1 & 3 represent 95% and this combination when compared to the other combinations, this method has given the highest sensitivity result than all other existing feature extraction and classification combinations. This results was shown in figure 14.
Figure 14. Cross Validation of Sensitivity Results in proposed (EEETCM) and existing (EETCM) individual
feature extraction method and classification combinations.
Specificity Validation
The same the specificity of the proposed EEETCM+K-SVM method for the dataset 15, 16 &19 represent 90% and this combination when compared to the other combinations, this method has given the highest specificity result than all other existing feature extraction and classification combinations. This results was shown in figure 15.
Figure 15. Cross Validation of Specificity Results in proposed (EEETCM) and existing (EETCM) individual
feature extraction method and classification combinations
Accuracy Validation
The same the accuracy of the proposed EEETCM+K-SVM method for the dataset 1 represent 92% and this combination when compared to the other combinations, this method has given the highest accuracy result than all other existing feature extraction and classification combinations. This results was shown in figure 16.
Figure.16. Cross Validation of Accuracy Results in proposed (EEETCM) and existing (EETCM) individual
feature extraction method and classification combinations.
Combining Individual feature extraction features and classification combination
Sensitivity Validation 75 80 85 90 95 100 Se n si tiv ity (% ) Data Sets
20-fold Cross Validation Method
EEETCM+KSVM EEETCM+SVM EETCM+KSVM EETCM+SVM 78 80 82 84 86 88 90 92 D ata S e t1 D ata S e t3 D ata S e t5 D ata S e t7 D ata S e t9 D ata S e t11 D ata S e t13 D ata S e t15 D ata S e t17 D ata S e t19 Sp e ci fi ci ty (% ) Data Sets
20-fold Cross Validation Method
EEETCM+KSVM EEETCM+SVM EETCM+KSVM EETCM+SVM 76 78 80 82 84 86 88 90 92 94 D ata S e t1 D ata S e t3 D ata S e t5 D ata S e t7 D ata S e t9 D ata S e t11 D ata S e t13 D ata S e t15 D at a S et17 D at a S et19 A cc u rac y ( % ) Data Sets
20-fold Cross Validation Methods
EEETCM+KSVM
EEETCM+SVM
EETCM+KSVM
It can be observed that the sensitivity of the proposed CFE+K-SVM method for the dataset 6 represent 97% and this combination when compared to the other combinations, this method has given the highest sensitivity result than all other combination of CFE + SVM. This results was shown in figure 17.
Figure. 17. Cross Validation of Sensitivity Results in proposed CFE method and classification combinations
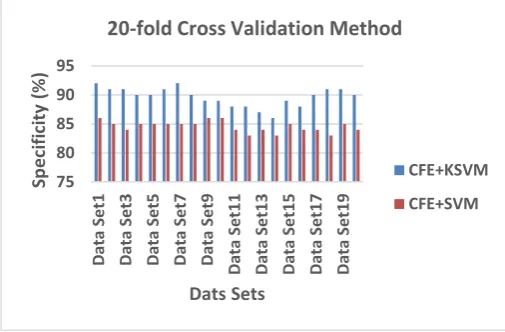
Specificity Validation
The specificity of the proposed CFE+K-SVM method for the dataset 1 & 7 represent 92% and this combination when compared to the other combinations, this method has given the highest specificity result than all other combination of CFE + SVM. This results was shown in figure.18.
Figure. 18. Cross Validation of Specificity Results in proposed CFE method and classification combinations
Accuracy Validation
The accuracy of the proposed CFE+K-SVM method for the dataset 1 represent 94.5% and this combination when compared to the other combinations, this method has given the highest accuracy result than other combination of CFE + SVM. This results was shown in figure.19.
Figure. 19. Cross Validation of Accuracy Results in proposed CFE method and classification combinations
IV.
CONCLUSION
In this paper, we have developed an automated cervical cancer diagnostic system with normal and abnormal classes. The proposed system was designed with the individual and combining individual texture features with the classification techniques. The benefit of the system is to assist the physician to make the final decision without hesitation. According to the experimental results, the proposed method is efficient for the classification of image into normal cell and abnormal cell. For comparative analysis, in an individual feature extraction and classification combinations, our proposed (EEETCM + K-SVM) approach provide the better results in all the statistical parameters when it compared with all other remaining feature extraction and classification combinations. In combining individual features method, the proposed CFE + K-SVM approach provide the better results than all other CFE with classifications combination and also all other individual feature extraction and classification combinations. Hence, our proposed method proved that the proposed algorithm graph is good at detecting the cancer in the experimental images.
80 85 90 95 100 D ata S e t1 D ata S e t3 D ata S e t5 D ata S e t7 D ata S e t9 D ata S e t11 D ata S e t13 D ata S e t15 D ata S e t17 D ata S e t19 Se n si tiv ity (% ) Data Sets
20-fold Cross Validation Method
CFE+KSVM CFE+SVM 75 80 85 90 95 D ata S e t1 D ata S e t3 D ata S e t5 D ata S e t7 D ata S e t9 D ata S e t11 D ata S e t13 D ata S e t15 D ata S e t17 D ata S e t19 Sp e ci fi ci ty (% ) Dats Sets
20-fold Cross Validation Method
CFE+KSVM CFE+SVM 75 80 85 90 95 100 D ata S e t1 D ata S e t3 D ata S e t5 D ata S e t7 D ata S e t9 D ata S e t11 D ata S e t13 D ata S e t15 D ata S e t17 D ata S e t19 A cc u rac y ( % ) Data Sets
20-fold Cross Validation Method
CFE+KSVM
V.
REFERENCES
[1]. http://www.cancer.org/cancer/cancerbasics/what-is-cancer.
[2]. "Cervical Cancer Treatment (PDQ®)". NCI. 2014-03-14. June2014.
[3]. "Defining Cancer". National Cancer Institute, June 2014.
[4]. Tarney, CM; Han, J (2014). "Postcoital bleeding: a review on etiology, diagnosis, and management.". Obstetrics and Gynecology
International. 2014:
192087.doi:10.1155/2014/192087. PMID 25045355.
[5]. Kumar V, Abbas AK, Fausto N, Mitchell RN (2007). Robbins Basic Pathology (8th ed.). Saunders Elsevier. pp. 718–721. ISBN 978-1-4160-2973-1.
[6]. Kufe, Donald (2009). Holland-Frei cancer medicine. (8th ed.). New York: McGraw-Hill Medical. p. 1299. ISBN 9781607950141.
[7]. World Cancer Report 2014. World Health Organization. 2014. pp. Chapter 5.12. ISBN 9283204298.
[8]. Dunne, EF; Park, IU (Dec 2013). "HPV and HPV-associated diseases.". Infectious Disease Clinics of North America. 27 (4): 765–78. doi:10.1016/j.idc.2013.09.001.PMID 24275269. [9]. "Cervical Cancer Treatment (PDQ®)". National
Cancer Institute. 2014-03-14. Retrieved 25 June 2014.
[10]. "What is cervical screening". National Screening Unit, Government of New Zealand. 27 November 2014.
[11]. Levels of Disease Prevention. (2007, April 24). Retrieved March 16, 2014, from Centers for Disease Control and Prevention website: "Archived copy". Archived from the original on 2014-02-26. Retrieved 2015-08-23.
[12]. Quinn, M; Babb, P; Jones, J; Allen, E (1999). "Effect of screening on incidence of and mortality from cancer of cervix in England: evaluation based on routinely collected statistics.". BMJ. 318: 904–8. doi:10.1136/bmj.318.7188.904. PMC 27810 .PMID 10102852.
[13]. World Health Organization (2014). Comprehensive Cervical Cancer Control: A Guide to Essential Practice. WHO.
[14]. https://en.wikipedia.org/wiki/Pap_test.
[15]. Milan Sonka, Vaclav Hlavac, Roger Boyle, "Image Processing, Analysis and Machine Vision”, pp: 56-11.
[16]. R.Yogamangalam, B.Karthikeyan, "Segmentation Techniques Comparison in Image Processing”, ISSN : 0975-4024 Vol 5 No 1 Feb-Mar 2013, International Journal of Engineering and Technology (IJET), 307-313.
[17]. https://en.wikipedia.org/wiki/Feature_extraction. [18]. D. Lu & Q. Weng (2007) A survey of image
classification methods and techniques for improving classification performance, International Journal of Remote Sensing, 28:5, 823-870, DOI: 10.1080/01431160600746456. [19]. Daniel X. Le, George R. Thoma, Harry Wechsler
. Classification of binary document images into textual or nontextual data blocks using neural network models, Springer Verlag publication. 1995; 8: 289-16.
[20]. Soumya M. K, Sneha K and Arunvinodh C, "Cervical Cancer Detection and Classification using Texture Analysis”, Biomedical and Pharmacology Journal, ISSN:0974-6242. E-ISSN:2456-261.
[21]. B. Ashok Int. Journal of Engineering Research and Applications, ISSN: 2248-9622, Vol. 6, Issue 1, (Part - 1) January 2016, pp.94-99.
[22]. JieSu,1 XuanXu, YongjunHe and JinmingSong. "Automatic Detection of Cervical Cancer Cells by a Two-Level Cascade Classification System”, Hindawi Publishing Corporation Analytical Cellular Pathology Volume 2016, Article ID
9535027, 11 pages
http://dx.doi.org/10.1155/2016/9535027.
[23]. Siti Noraini Sulaimana, Nor Ashidi Mat-Isab, Nor Hayati Othmanc, Fadzil Ahmada. "Improvement of Features Extraction Process and Classification of Cervical Cancer for the NeuralPap System”, 19th International Conference on Knowledge Based and Intelligent Information and Engineering Systems. 60 (2015) 750 – 759, 1877-0509 © 2015.
[24]. Deepak et al., J Cytology Histology, "Computer Assisted Pap Smear Analyser for Cervical Cancer Screening using Quantitative Microscopy”, 2015, S:3 http://dx.doi.org/10.4172/2157-7099.S3-010. [25]. Sreedevi et al. "Papsmear Image based Detection
of Cervical Cancer”, International Journal of Computer Applications (0975 – 8887) Volume 45– No.20, May 2012.
[26]. M.Anousouya devi et al., "Detection of Cervical Cancer using the Image Classification Algorithms" I J C T A, 9(3), 2016, pp. 153-166 © International Science Press.
[27]. N.Sakthi priya, "Cervical Cancer Screening and Classification Using Acoustic Shadowing”, International Journal of Innovative Research in Computer and Communication Engineering, Volume 1, Issue 8, October 2013.
[28]. Karthigai Lakshmi et al. "Feature Extraction and Feature Set Selection for Cervical Cancer Diagnosis”, Indian Journal of Science and Technology, Vol 9(19), DOI: 10.17485/ijst/2016/v9i19/93881, May 2016. [29]. Nazahah Mustafa et. Al, "Cervical Cancer
No. 2, May 2008, ISSN: 804x online, 1473-8031.
[30]. Demirkaya O. "Anisotropic diffusion filtering of PET attenuation data to improve emission images”, Phys MED Biol vol.47(20): N271-8.2002.
[31]. B.Julesz, Textons, The elements of Texture Perception and their interactions, Nature 290 (5802) (1981) 91-97.
[32]. Liu G.-H., Zhang L., Hou Y.K., Z.Y. Li and Yan J.Y. g 2010 Image retrieval based on multi- texton histogram Pattern Recognition 43 2380-2389. [33]. Zhang J., Liu Y., Cervical Cancer Detection
Using SVM Based Feature Screening, Proc of the 7th Medical Image Computing and Computer-Assisted Intervention,vol. 2, pp.873-880,2004. [34]. Zhang K., CAO H.X., Yan H., Application of
support vector machines on network abnormal intrusion detection. Application Research of Computers, vol.5, pp.98-100, 2006.
[35]. Luz Helena Camargo Casallas (2012) Classification of squamous cell cervical cytology, Master’s Thesis, Faculty of Medicine – Engineering Faculty, Universidad Nacional de Colombia, Bogota D.C Colombia.
[36]. Yung-Fu Chen, Po-Chi Huang, Ker-Cheng Lin, Hsuan Hung Lin, Li-En Wang, Chung-chuan Cheng, Tsung-Po Chen, Yung-Kuan Chan, John Y. Chiang (2013), Semiautomatic segmentation and classification of Pap smear cells. IEEE Journal of Biomedical and Health Informatics, pp 1–15.
[37]. Ramin Moshavegh, Babak Ehteshami Bejnordi (2013) Chromatin pattern analysis of cell nuclei for improved cervical cancer detection, Master’s Thesis in Biomedical Engineering, Department of Signal and systems, Chalmers University of Technology, Sweden.
[38]. S. Theodoridis and K. Koutroumbas (2009) Pattern Recognition, 4th ed. China Machine Press. [39]. Simon Haykin (2009) Neural networks and learning machines, 3rd ed. China Machine press, Pearson education Asia Ltd.
[40]. Wen Zhu, Nancy Zeng, Ning Wang, "Sensitivity, Specificity, Accuracy, Associated Confidence Interval and ROC Analysis with Practical SAS Implementations", Proceedings of the SAS Conference, Baltimore, Maryland, pages: 9, 2010. [41]. Ounpraseuth S, Lensing SY, Spencer HJ, Kodell