Department of Computer Science and Engineering, SRM University, Kattankulathur - 603 203, Kancheepuram, Tamil Nadu, India. Email: [email protected]
Received: 08 May 2017, Revised and Accepted: 16 August 2017 ABSTRACT
Objective: Cancer is the uncontrollable multiplication of cells in human body. The expansion of cancerous cells in the breast area of the women is identified as breast cancer. It is mostly identified among women aged above 40. With the current advancement in the medical field, various automatic tests are available for the identification of cancerous tissues. The cancerous cells are spotted by taking the photo imprint in the form of X-ray comprising the breast area of the woman. Such images are called mammograms. Segmentation of mammograms is the primary step toward diagnosis. It involves the pre-processing of the image to identify the region of interest (ROI). Later, features are extracted from the image which involves the learned features that may be statistical and textural features. When these features are used as input to the simple classifier, it helps us to predict the risk of cancer. The support vector machine (SVM) classifier was proved to produce a better accuracy percentage with the features extracted.
Methods: The mammograms are subjected to a pre-processing stage, where the images are processed to identify the ROI. Next, the features are extracted from these images to identify the statistical and textural features. Finally, these features are used as input to the simple classifier, it helps us to predict the risk of cancer
Results: The SVM classifier was proved to produce the maximum accuracy of about 88.67% considering 13 features including both statistical and textural features. The features taken for the study are mean, inverse difference moment, energy, entropy, root mean square, correlation, homogeneity, variance, skewness, range, contrast, kurtosis, and smoothness.
Conclusion: Computer-aided diagnosis is one of the most common methods of detection of cancer with mammograms, and it involves minor human intervention. The dataset of mammograms was analyzed and found that SVM provided the highest accuracy of 88.67%. A wide range of the study is progressing in the field of cancer as this disease causes a high threat of human life in this era.
Keywords: Cancer, Segmentation, Feature extraction, Mammograms, Classification, Gray-level co-occurrence matrix, Region of interest.
INTRODUCTION
Cancer leads to the uncontrollable duplication of cell growth in different parts of the body. The excess growth of the cell in a human body may lead to micro calcifications, architectural distortions, or masses. These will help in detecting if the tissue is benign or malignant. Non-cancerous tissues are called benign tissues. Malignant tissues are cancerous and can cause a threat to life. The major threat includes its spread to other parts of the body eventually destroying nearby tissues [1]. The great majority of cancers, 90-95% of cases are due to tobacco, 25-30% because of obesity, 30-35% infections, 15-20% radiation, 10% stress, lack of physical activity, and environmental pollutants. The remaining 5-10% are due to inherited genetics involving hormonal and mutational changes [2]. Fig. 1 depicts normal, benign, and malignant images of breast tissue mammograms.
The breast cancer is mostly detected in 60% of women who are aged above 40-50 years, some of which is life threatening (survey by the American Cancer Society [3]). Cancer has become the main cause of deaths now. It is also estimated that by 2030 the death rates caused by cancer are expected to be around 12 million. The screening and diagnosis of mammograms at the early stage would help in the detection of breast cancer, thus increasing the treatment options and thereby increasing the survival rates [4]. The only method available to confirm the presence of cancer in a human body is biopsy. Most common biopsy techniques are surgical biopsy (open), fine-needle aspiration, vacuum-assisted, and core-needle biopsy [5].
The radiologists predict the presence of a tumor with the help of mammograms. The prediction mainly involves the diagnosis of the mammograms as well as the ultrasound scan of the patient. The major drawback using this method is the high involvement of human intervention and also error due to visual inspection [6]. The estimated sensitivity of radiologists in breast cancer screening is only about 75%. One of the effectively suggested approaches is double reading to improve sensitivity and accuracy [1]. Computer-aided diagnosis (CAD) is a method introduced to overcome this problem which includes automatic methods to predict cancer in a human.
The method of image segmentation mainly involves the understanding of a region of interest (ROI), where actually the tumor is present. Later, features are extracted from the images using mathematical calculations [7]. The features extracted can be statistical, textural, and structural [8][9]. These features are later classified using the classification algorithm called support vector machine (SVM) which helps in gaining high accuracy of cancer prediction. Fig. 2 represents the various steps involved in the automatic prediction of cancer using mammograms.
MIAS DATABASE
This database contains around 322 mammograms for the purpose of the study. The images of the MIAS database are with a resolution of 200 µ though initially was of 50 µ. The character of background tissue, database reference number indicating right and left breast, class of lesion, size, coordinates of present lesions, and pathology of each left and right breasts are attached along.
PRE-PROCESSING OF IMAGE
Pre-processing involves the segmentation of the image to find the ROI of each mammogram. There are various methods and algorithms available for predicting the ROI [10,11]. The pre-processing of images enables to improve the quality of image for further detailed knowledge extraction. It involves the removal of unwanted noise and surplus bodies in the image. The types of noises observed are high-intensity labels which need to be removed to understand the ROI.
The pre-processing of images mainly involves scaling the image, removal of unwanted noise, deleting other small objects, and finally, predicting the ROI. The presence of noise can greatly affect the accuracy of feature extraction. Thus, the removal of noise plays a vital role in image pre-processing. All X-ray images contain some amount of noises. Several techniques are applied for the elimination of noise in the images [12]. The techniques employed for reduction of noise broadly fall under two domains as follows:
• Frequency domain • Spatial domain.
In a frequency domain filter, the Gaussian filter is applied on the gray-scale image mammography. The Gaussian filter removes noise as well as blurs the edges [12,9]. Initially, all images are in the spatial domain. A discrete Fourier transform (DFT) [10,13] is applied to convert the image to the frequency domain. This mainly involves a 2D DFT transform which produces an output which is the same size as the input, for example, y=fft2(x).
Gaussian smoothening is applied to the image to remove noise by the method of convolution. As Gaussian filtering makes the image blurred, a high-pass filter is used to invert the same. For this purpose, a Wiener filter is used.
The Wiener filter implements a high local smoothing if the variance is small, whereas it provides a low smoothing if the variance is calculated to be large. For this reason, the Wiener filter is also known as “minimum mean square error filter” [12]. The implementation of Wiener filter involves mainly predicting the power spectral density. Here, a low-pass filter is used to remove noise by the method of compression, and a high-pass filter is used to remove the blurredness of the image by the method of deconvolution [14]. The ROI in medical imaging is the boundary of a tumor defined on an image or in a volume, for the purpose of measuring its size [15]. Fig. 3 represents the different images of mammograms after applying Gaussian and Wiener filtering.
ROI can be computed using the local thresholding which is the easiest and convenient methodology. According to this method, every value of the pixel in the image is compared to other value to get the highest intensity value. This highest intensity pixel is marked as white spots in the image.
FEATURE EXTRACTION
Feature extraction refers to producing relevant information from images which help in solving other computational task related to certain applications. Thus, feature extraction can be further defined as follows: 1. The general neighborhood operation result computed from an image
2. Specific structural or textural properties of the image that can help
in predicting results.
Some of the textural features can be extracted using the gray-level co-occurrence matrix (GLCM) [16] matrix. MATLAB provides a built-in function to produce this matrix. The GLCM is an mxn matrix where m=n (no of gray levels). Each element p(i,j) represents the relative frequency with which 2 pixels are separated by a pixel distance which occur with an intensity j. From the GLCM matrix, various textural features can be extracted. In this paper, a set of 6 GLCM descriptors are measured, namely, energy, correlation, homogeneity, contrast, entropy, and inverse difference moment (IDM).
There are different features that can be extracted from mammograms [17]. These include the structural, statistical, and textural features [9]. The following equations/formula are used for the computation of features. Here, p(i,j) refers to the set of quantized gray values of the images.
Mean
The mean, m, refers to the central tendency of a probability distribution in the image in pixels [9]. Equation 1 refers to the computation of mean value as follows:
= =
µ =
∑∑
M Ni 1 j 1
1 p(i,j)
MN (1)
Standard deviation (SD)
The mean square variation of gray pixel value p(i,j) from its mean value is referred to as the SD. The square root of variance is normally expressed as the SD. It is determined using the Equation 2 as follows: Fig. 1: Typical mammogram images. (a) Normal, (b) benign, and
(c) malignant
c b
a
Fig. 2: Computer-aided diagnosis system pipeline
Fig. 3: (a-c) Mammograms of original, Gaussian, and Wiener filtered applied images
c b
The gray-level contrast measure is described as the relative smoothness. The smoothness is determined using the Equation 3 as follows:
= − + σ1 2
R 1
1 (3)
Where σ is the standard deviation of the image.
Entropy
The textural features of an image can be described using a statistical value called entropy. The Equation 4 depicts the formula for entropy.
−
Pr (probability of the kth gray level) = Zk/m*n (Zk refers to the number
of pixels with the kth gray level).
L is the number of gray levels.
Skewness
The asymmetric degree of a pixel distribution in the specified window around its mean is referred to as skewness. Equation 5 can be used for calculating the skewness.
The peakness or flatness of a probability distribution relative to normal distribution provides the measure of kurtosis (K) of an image. The conventional definition of kurtosis is represented in the Equation 6 as follows:
The RMS provides the arithmetic mean of the squares of the mean values (along each row or column). The RMS value is given by the Equation 7 as follows:
IDM represents the texture of the image. Its value ranges from 0 to 1, where 0.0 represents highly textured image, and 1.0 represents untextured images. Equation 8 expresses IDM as follows:
=
The difference in intensity values between a pixel and its neighbor over the whole image is called as contrast. The contrast is calculated using the following Equation 10:
=
∑
− 2i,j
C |i j| p(i,j) (10)
Correlation
Correlation defines how two pixel values are dependent to each other
on a linearly considering the whole image. It ranges from −1 to 1. The
equation 11 shows the calculation of correlation.
− µ − µ
which represents the partial probability density function.
Homogeneity
The uniformness of distribution elements of GLCM to its diagonals, which ranges from 0 to1, is referred to as homogeneity of the image. It is calculated using Equation 12 as follows:
=
Equation 13 explains the computation of variance which is the square root of SD.
=
Var SD (13)
Where SD is the standard deviation.
These features are then processed to understand the most contributing feature for predicting cancer. This method is known as feature selection. Such features are taken for the further study.
CLASSIFICATION
Classification is defined as the process of dividing the new observation (test data set) to categories based on the model created by classifying the training data set. It is an instance of supervised learning and maps input to a specified category. A classifier is defined as the algorithm that implements classification. The features extracted from mammograms are used as input to the SVM classifier. SVM classifier is widely used in the recent research. SVM provides a high degree of generalization. They are best suited for binary classification. The two processes involved are:
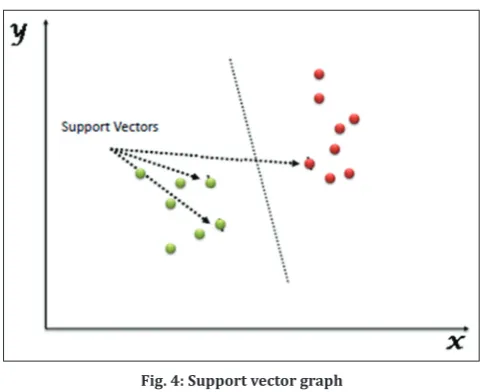
The SVM algorithm constructs a hyperplane that is used to segregate the input points such that the highest number of points is on the same side of one of the classes, and at the same time, it also maximizes the distance of each class to that hyperplane. Fig. 4 depicts the support vector classification.
Another classifier widely used for classifying image is the KNN classifier [18]. KNN creates a model from the experience of previous training patterns. The model is created from the input test data and classifies the dataset [19] as malignant or benign, using majority voting among the nearest k neighbors. The k nearest neighbors use the algebraic formulas such as the distance metric like correlation, Euclidian distance to compute values for the classification.
The stochastic gradient descent (SGD) is a simple but efficient approach to discriminative learning of linear classifiers. SGD acquired popularity in the recent era, in the context of large-scale learning, in the field of text classification, and natural language processing. On applying SGD classifier on the dataset, a high accuracy of 88.67% was obtained. The main advantage of using this classifier is that it has the capacity to classify with more than 105 examples and generates more than 105
features. The disadvantages of SGD include as follows:
• The number of hyperparameters involved is huge, thus involving
plenty of iterations.
• SGD is sensitive to feature scaling.
RESULT ANALYSIS
The SVM classifier was proved to produce the maximum accuracy of about 88.67% considering 13 features including both statistical and textural features. The features taken for the study are mean, IDM, energy, entropy, RMS, correlation, homogeneity, variance, skewness, range, contrast, kurtosis, and smoothness. The dataset included the values for the 322 images of the MIAS dataset. The classification was carried out with 80% training set and 20% as the test dataset. The accuracy was recorded as 88.67%. When the same was classified using a KNN classifier, the accuracy recorded was only 79.24%. This makes the SVM classifier to be an accurate classifier for the classification of image extracted features. Fig. 5 explains the classification accuracy of different classifiers.
Mammographic risk scoring
Mammographic risk scoring refers to the representation of the mammograms to the risk of cancer [20]. There are various scales to represent the various levels of the spread of cancerous tissues in the body. One such method is the breast imaging reporting and data system (BI-RADS) [21,22]. This categorizes the mammograms to 7 different types (0-6). The classification of the mammograms is made by the radiologists by taking into account the amount of calcium deposits seen from the mammograms and also considering the
ultrasonic scan of the breasts. The American College of Radiology introduced the BI-RADS scale that granted the standard scale to classify the images benign or malignant. BI-RADS classification is as discussed in Table 1.
CONCLUSION
CAD is one of the most common methods for the detection of cancer with mammograms, and it involves minor human intervention [18]. The breast cancer [23] detection mainly involves three major steps. Step 1 involves the identification of ROI from the mammograms by the method of image segmentation. This enables to find the region with calcium deposits as the region with a tumor. Step 2 involves the dataset creation containing the features required for the study of cancer by the process of feature extraction. Feature selection helps in identifying the attributes that contribute to our study. There are different types of features extracted from mammograms that include statistical, structural, and textural features [9]. Step 3 classification to segregate mammograms as benign, malignant, and normal tissues. The KNN and SVM [16] classifiers were implemented to classify images based on the features extracted. It was proved that SVM provided the maximum accuracy of classification comparatively with 88.67% accuracy. This proves that the SVM is a better classifier for classifying extracted features. A wide range of study is progressing in the field of cancer as this disease cause a high threat of human life in this era.
REFERENCES
1. Reddy DR, Kalyani G, Pradeep K, Asif MD, Kartheek D, Gangabhavani M. The survey of cancer patients in the region of Guntur: Based on hospital registry. Int J Pharm Pharm Sci 2017;9(2):228-32. 2. Chen Y, Jiang H, Li C, Jia X, Ghamisi P. Deep feature extraction and
classification of hyperspectral images based on convolutional neural networks. IEEE Trans Geosci Remote Sens 2016;52(10):6508-20. 3. Tan M, Zheng B, Leader JK, Gur D. Association between changes in
mammographic image features and risk for near-term breast cancer development. IEEE Trans Med Imaging 2016;35(7):1719-28.
4. Spanhol FA, Oliveira LS, Petitjean C, Heutte L. A dataset for breast cancer histopathological image classification. IEEE Trans Biomed Eng 2016;63(7):1455-62.
Fig. 4: Support vector graph
Fig. 5: Classification accuracy
Table 1: BI-RADS classification Category Definition
0 Additional imaging evaluation and/or comparison to prior mammograms is needed
1 Negative
2 Benign (non-cancerous) finding
3 Probably benign finding follow-up in a short-time frame is suggested
4 Suspicious abnormality - biopsy should be considered 5 Highly suggestive of malignancy
7. Song L, Hsu W, Xu J, van der Schaar M. Using contextual learning to improve diagnostic accuracy: Application in breast cancer screening. IEEE J Biomed Health Infor 2016;20(3):902-14.
8. Xu J, Xiang L, Liu Q, Gilmore H, Wu J, Tang J, et al. Stacked sparse auto encoder (SSAE) for nuclei detection on breast cancer histopathology images. IEEE Trans Med Imaging 2016;35(1):119-31.
9. Romero A, Gatta C, Camps-Valls G. Unsupervised deep feature extraction for remote sensing image classification. IEEE Trans on Geosci Remote Sens 2016;54:1349-55.
10. Alaa AM, Moon KH, Hsu W, van der Schaar M. Confident care: A clinical decision support system for personalized breast cancer screening. IEEE Trans on Multimed 2016;18:1942-57.
11. Adel El-Shazli AM, Youssef SM, Elshennawy M. Computer-aided model for breast cancer detection in mammograms. Int J Pharm Pharm Sci 2016;8:31-4.
12. El-Shazli AM, Youssef SM, Elshennawy M. Computer-aided model for breast cancer detection in mammograms. Int J Pharm Pharm Sci 2016;8:31-4.
13. Sellami L, Sassi OB, Chtourou K, Hamid AB. Breast cancer ultrasound images sequence exploration using BI-RADS features extraction: Towards an advanced clinical aided tool for precise lesion characterization. IEEE Trans Nano Biosci 2015;14(7):740-55.18. 14. Bahrami H, Porter E, Santorelli A, Gosselin B, Popovi´c M, Rusch LA.
histopathology image analysis: a review. IEEE Trans Biomed Eng 2014;61(5):1400-1.
17. Sfakianakis S, Bei ES, Zervakis M, Vassou D, Kafetzopoulos D. On the identification of circulating tumor cells in breast cancer. IEEE J Biomed Health Inform 2014;18(3):773-82.
18. Lakshmanan MN, Harrawood BN, Agasthya GA, Kapadia AJ. Simulations of breast cancer imaging using gamma-ray stimulated emission computed tomography. IEEE Trans Med Imaging 2014;33(2):546-55.
19. Ganesan K, Acharya UR, Chua CK, Min LC, Abraham KT, Ng KH. Computer-aided breast cancer detection using mammograms: a review. IEEE Rev Biomed Eng 2013;6:77-98.
20. Pradeep N, Girisha H, Sreepathi B. Feature extraction of mammograms. Int J Bioinform Res 2012;4(1):241-4.
21. Zyout I, Qader IA. Classification of macro classification clusters via pso-knn heuristic parameter selection and GLCM features. Int J Comput Appl 2011;31(2):34-9.
22. Panda RN, Panigrahi BK, Patro MR. Feature extraction for calcification of micro calcifications and mass lesions in mammograms. Int J Comput Sci Netw Secur 2009;9(5):255-69.