ABSTRACT
GILLESPIE, KEVIN. Systems Genetics of Lung Response in the Collaborative Cross: A Comparative Analysis. (Under the direction of David Aylor.)
© Copyright 2016 by Kevin Gillespie
Systems Genetics of Lung Response in the Collaborative Cross: A Comparative Analysis
by Kevin Gillespie
A thesis submitted to the Graduate Faculty of North Carolina State University
in partial fulfillment of the requirements for the Degree of
Master of Science
Functional Genomics
Raleigh, North Carolina 2016
APPROVED BY:
Dahlia Nielsen Zhao-Bang Zeng
David Aylor
DEDICATION
BIOGRAPHY
ACKNOWLEDGEMENTS
TABLE OF CONTENTS
LIST OF TABLES . . . vii
LIST OF FIGURES. . . .viii
Chapter 1 INTRODUCTION . . . 1
1.1 Comparing eQTL studies . . . 1
1.2 Collaborative Cross . . . 2
1.3 Attractive features of the population . . . 3
1.4 AAD Previous Work . . . 3
1.5 FLU Previous Work . . . 4
1.6 Approach . . . 5
1.7 Specific Goals . . . 6
Chapter 2 MATERIALS & METHODS . . . 8
2.1 Expression Arrays . . . 8
2.2 Genotyping Arrays . . . 9
2.3 eQTL Mapping . . . 9
2.4 Allele Effect Patterns . . . 10
2.5 Gene Set Analysis . . . 10
Chapter 3 RESULTS . . . 12
3.1 Expressed Genes . . . 12
3.2 AAD eQTL . . . 13
3.3 FLU eQTL . . . 13
3.4 Shared eQTL . . . 17
3.5 Allele Effects Comparisons . . . 18
Chapter 4 DISCUSSION . . . 21
4.1 Functional enrichment within gene sets . . . 21
4.2 Trans-eQTL Bands . . . 22
4.3 Shared eQTL after AEP comparison . . . 23
4.4 Extent of eQTL sharing between these studies . . . 24
BIBLIOGRAPHY . . . 26
APPENDICES . . . 29
Appendix A QTL Mapping . . . 30
A.1 Hematology . . . 30
A.2 Peak conditioning . . . 30
A.3 Conditioning for Sample Batches . . . 31
A.4 Removing Outliers . . . 31
A.5 Manhattan plots . . . 31
Appendix B Insufficient samples lead to overfit data . . . 33
B.1 Uncharacteristic AEP . . . 33
B.2 Pseudo counts . . . 35
Appendix C Differential expression . . . 36
C.1 Response Groups . . . 36
C.2 Differentially expressed genes . . . 36
C.3 Results . . . 37
Appendix D Conditional correlation analysis . . . 38
D.1 FLU trans-eQTL . . . 38
D.2 Conditioning onMx1locus . . . 40
D.3 Results . . . 40
Appendix E Modulated modularity clustering . . . 41
E.1 Modulated Modularity Clustering . . . 41
LIST OF TABLES
LIST OF FIGURES
Figure 1.1 Analysis Process . . . 7
Figure 3.1 Global plot for eQTL in both AAD and FLU studies . . . 14
Figure 3.2 Partitioning of genes from individual experiments through analysis . . . 16
Figure 3.3 Example of matching AEP . . . 18
Figure 3.4 Example of inverted AEP . . . 19
Figure A.1 Manhattan plot of log(RBC Diameter Width) . . . 32
Figure B.1 Addition of simulated PWK mice . . . 34
Figure D.1 Conditional Correlation scan of gene downstream of Mx1 . . . 39
Figure E.1 MMC of AAD differential expression . . . 42
CHAPTER
1
INTRODUCTION
We utilized identical methods to perform expression Quantitative Trait Locus (eQTL) mapping in two studies of mice from the Collaborative Cross (CC) that were exposed to either Influenza A (IAV) or House Dust Mite (HDM). The eQTL detected in these two studies were compared, and their intervals and the associated gene were used to measure the number of eQTL that were unique to an experimental condition or shared between them. We performed functional annotation on the downstream genes associated with eQTL specific to one of three major groups, the Associated Airway Disease experiment (AAD), the Influenza experiment (FLU), and genes downstream of eQTL that had the same interval in both experiments.
1.1
Comparing eQTL studies
1.2. COLLABORATIVE CROSS CHAPTER 1. INTRODUCTION
which eQTL are shared between lung responses to different experimental conditions. Attempts to compare multiple sets of eQTL results with one another are more rare. Studies have attempted to detect regulatory regions that are shared between immune responses triggered from different environmental insults, but have been limited to comparisons between cell types.[6–9]Studies have also shown that 50% of the cis-eQTL between two different tissues can be shared.[10]Studies have also attempted to reconcile shared associations from multiple diseases as well. In the area of Irritable Bowel Diseases (IBD) work analyzing shared regulatory modules of Crohn’s disease and ulcerative colitis have uncovered new modules of shared susceptibility.[11]The Genotype-Tissue Expression (GTEx) project was started through the National Institute of Health (NIH) common fund, and is an example of a resource — currently in development — that attempts to catalog these relationships between gene expression variation and genetic variation in humans. The project uses tissues gathered from deceased donors to obtain gene expression and genotype information, which is used to perform eQTL analysis in each tissue type collected. With this information, and the medical records of the donors, this resource allows us to assess many of the common variants associated with changes in gene expression that could influence susceptibility to many complex human diseases.[12]These types comparisons are interesting when considering complex diseases with similar etiologies. The assumption is that if the pathology of diseases are similar, the regulatory architecture may be as well. These studies illustrate the existence of common variants within a single cell type between environmental insults, and that there are shared modules of susceptibility between disease pathologies. There is, however, less information as to the extent to which regulatory variants are shared between disease pathologies. Here we describe one such comparison of eQTL detected between mice of incipient lines of a RIL panel, the Collaborative Cross (CC).
1.2
Collaborative Cross
We selected two specific studies in order to minimize the ways that design, subject and treatment may confound the results. The two studies analyzed here are in mice of the incipient lines to the CC RIL population. These CC mice are not fully inbred, being on average 6.7 generations into the inbreeding process they display an average homozygosity of 84.1% across their genomes.[3, 13, 14] The advantages of this population are similar to those found in the Collaborative Cross.
1.3. ATTRACTIVE FEATURES OF THE POPULATION CHAPTER 1. INTRODUCTION
replicative as well, and allows the same genotype to be tested against multiple experimental condi-tions multiple times.[3, 15]This is of particular interest to our specific goal of making comparisons between eQTL experiments. It is diverse because, as mentioned above, it uses lines from all three major subspecies of mice, but they are also equal in that the lines are all made of roughly the same number of genetic regions from each founder strain.[3, 15]These qualities make this panel an ideal population to investigate complex traits with low heritability, such as disease susceptibility, and were an important factor in selecting the two studies to be described below.
1.3
Attractive features of the population
The two studies, the Associated Airway Disease (AAD) arm and the Influenza A (FLU) arm were selected from the four arms of an initial set of studies in the CC, because they overcome some of the limitations of comparative analysis.[16]The mice in each study were genetically similar and used the same tissue, Bronchoalveolar Lavage (BAL), for RNA sampling.[3, 17–20]While the analysis methods of these studies differed, here, they will be re-analyzed in an identical fashion to minimize technical noise.[16]For these reasons a comparative analysis between these two sets of data should be effective in allowing us to address the extent of shared eQTL between these experimental lung insults. It will also allow us to better understand the suites of genes that define AAD and IAV immune responses.
1.4
AAD Previous Work
1.5. FLU PREVIOUS WORK CHAPTER 1. INTRODUCTION
[3, 19]This same pattern has been observed in all of the analysis here as well.
This study also observed two regions on chromosome 2 where there were clusters of eQTL that were very far away from the gene they influenced. These regions where expression patterns for many genes are all associated with the same genomic locus are referred to as trans-bands. Within the trans-band centered at 147.6Mb were genes enriched for genes found in the QTT analysis and therefore important to eosinophil count. Additionally, they found that two of the founder strains (A/J and C57BL/6J) were nearly identical at alleles across the trans-band region.[19]
Finally, this analysis sought to characterize any eQTL within a previously defined QTL on chro-mosome 11 for eosinophil count. They used conditional correlation analysis to assess which eQTL might be candidates responsible for the eosinophil QTL. A candidate eQTL should reduce the LOD score of the target QTL when variation at the eQTL locus is controlled for. The gene that contributed the greatest LOD drop wasTlcd2, which is negatively correlated with eosinophil count. Therefore, it was considered a candidate negative regulator of eosinophil recruitment.[19]A second study of the AAD experiment a conditional correlation test of probes within a previously observed QTL for CXCL1 on Chr 7 (Dpc1) concluded that a variant in the gene,Zfp30, within this region is the eQTL underlyingDpc1.[20]
1.5
FLU Previous Work
The FLU studies sought to characterize the pre-CC mice responses to exposure to Influenza A PR8. Similarly to the AAD studies they profiled a number of phenotypes and gene expression. They performed differential expression analysis between subsets of the most extreme responding mice in the experiment. These mice were either in a group with high day 4 weight loss and immunohisto-chemical staining or had low scores for these measures. They chose the top up regulated and down regulated genes to perform eQTL analysis. From these 2,671 transcripts they discovered 21 that had eQTL associated. The group went on to experimentally verify expression changes driven by 17 of these eQTL via qPCR.[17]This small set largely agreed in expression levels with the observed allele effects.
1.6. APPROACH CHAPTER 1. INTRODUCTION
Additionally, they characterized the eight founder genetic backgrounds atMx1gene. The found a specific allele variant, that caused an amino acid substitution (Gly83Arg), corresponding to the CAST/EIJ founder strain that does not confer the viral replication inhibition yet still protects against weight loss. They found that A/J, 129S1/SvImJ and NOD/ShiLtJ all had the same 2kb deletion as the C57BL/6J founder. This haplotype rendersMx1non-functional. WSB/EiJ also had a non-functional gene, but this was due to a nonsense mutation within exon 10.
The group then characterized CC variation at another significant QTL, referred to asHrI2, located on chromosome 7. They selected 99 mice that had a non-functionalMx1gene, based on inferred founder state, and performed WGCNA on the 60 mice RNA extracts from this group that produced usable microarray expression data. This analysis produced 11 modules, where 8 modules were enriched for T-cell and signaling processes as well as inflammatory response. They performed this same process for two other host responses to IAV HrI QTL. One QTL contributed control to the variation in pulmonary edema, termedHrI3, and was located on chromosome 1. The last QTL detected,HrI4, contributed to variation in airway neutrophils on chromosome 15. None of the modules produced by WGCNA were found to associate with these QTL and could not be used to for GO term enrichment.
In order to further reduce the likely interval around significant QTL peaks the investigators set out to correlate QTL allele effect patterns by separating the founders into two groups based on largest distance between groups. They then excluded SNPs where the members of the causative SNP do not agree with the predicted pattern. In this way they reduced the interval for bothHrI3
andHrI4dramatically, which reduced the number of causal genes within the region. They used the same process forHrI2, but in this example the groups were separated into three groups an increased resistance group (A/J), a susceptibility group (129S1/SvImJ) and all the other founders were considered intermediate. In this case they looked for SNPs that discriminate both A/J and 129S1/SvImJ from the rest of the founders. This allowed them to identify genes that had associated SNPs within the QTL interval for either founder or that were shared between them.[18]This process of excluding markers that don’t agree with the allele effect patterns estimated in the mapping process is a very important feature of the CC that allows us to assess the support of a shared eQTL in the current analysis.
1.6
Approach
1.7. SPECIFIC GOALS CHAPTER 1. INTRODUCTION
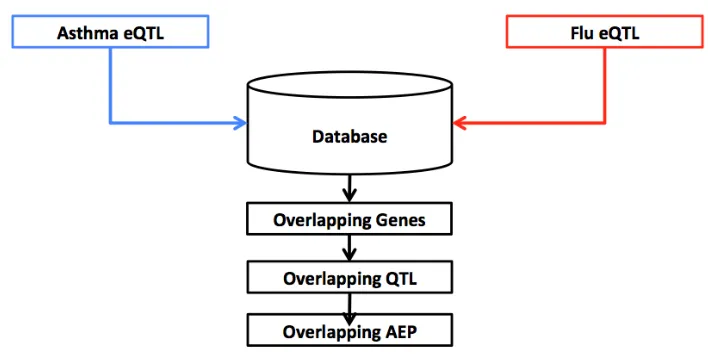
important considerations before the analysis is performed. The analysis scheme described below is depicted in Figure 1.1. Briefly, the data from both studies will be curated, to attempt to minimize sources of heterogeneity and prepare them for our specific analysis, eQTL mapping will then be performed and the results will be obtained from each study. We separate the results by their estimated intervals, the likely region where an eQTL effect exists, to separate those that overlap in both studies or are discrete to a single study. Each of the sets of genes, that have eQTL associated, is used as a separate gene set for functional annotation analysis for GO terms and pathway enrichment. This gives us an idea of what types of genes are being influenced by the eQTL detected in either or both studies. The eQTL that have overlapping intervals will have their allele effect patterns compared as well. One of the advantages of the CC population is that QTL mapping is done in a way that allows us to observe the allelic effects of the eight founder strains at each significant eQTL association. These allele effects can then be grouped, based on their effect on the trait, into high or low groups. When these groups and the correlation between the individual effects match it suggests that the two eQTL are potentially a single eQTL, while non-matching patterns suggest the opposite is true, and there are likely multiple eQTL within the overlapping region. Using this as a second filter we can make a better estimate of the true extent of shared eQTL between the two lung responses.
1.7
Specific Goals
1.7. SPECIFIC GOALS CHAPTER 1. INTRODUCTION
Figure 1.1Analysis Process
CHAPTER
2
MATERIALS & METHODS
2.1
Expression Arrays
2.2. GENOTYPING ARRAYS CHAPTER 2. MATERIALS & METHODS
2.2
Genotyping Arrays
The principle investigators also graciously provided the genotype information in the two expression studies. All the mice were assayed on either the A or B version of the Mouse Diversity Array. Both of these arrays contain over 180k SNPs.[3, 14, 17, 19]The AAD study was assayed on both, so the missing markers were imputed between the two arrays.[21]This allele information from the genotyping microarrays was then processed, previously, using the HAPPY R package.[22]
Briefly, the genotype allele information from each study was provided along with a Hidden Markov Model (HMM), containing the probabilities that an allele originated from one of the eight founders, to a forward-backward algorithm that generates a set of 8 emission state probabilities at each marker for each mouse.[22]Regions where the emission state probabilities are essentially constant for all the mice in a study were reduced to representative intervals.[3]This process produced genotype information for 27,039 and 12,100 marker intervals in the AAD and FLU study respectively. All these steps were previously performed in the independent analyses, and the results were here processed into a 3D array that the DOQTL software can interpret.
2.3
eQTL Mapping
To perform eQTL analysis on gene expression data, the expression array data was quantile normal-ized. A kinship matrix was created by calculating the relatedness of each mouse’s genotype to the other mice in the experiment. A covariate matrix was created that included the sex of each mouse. It can hold additional information if it is available and useful, which is described in. (Appendix 4)
The DOQTL R package was used to perform the eQTL scans.[23, 24]A nominal scan was per-formed to generate nominal LOD score for each marker interval for each probe in the expression array. 5,000 additional permutation scans were performed to generate a significance threshold for the discrimination of significant LOD score associations in the nominal scan. This also facilitated the calculation of adjusted p-values for those significant peaks that are greater than the permuted threshold.
For each significant peak in the nominal scan a 95% Bayesian Credibility Interval (CI) was constructed. This interval represents the region most likely to contain the position contributing control for the quantitative trait. This interval, an associated LOD score, an adjusted p-value and the gene the eQTL was associated with are used as a summary. The top 500 eQTL, judged by having the smallest adjusted p-value and greatest LOD score, were used as gene sets for functional analysis.
2.4. ALLELE EFFECT PATTERNS CHAPTER 2. MATERIALS & METHODS
subdivided into those that were very near their associated gene, termed cis-eQTL, and those that were far away from their associated gene, termed trans-eQTL. Both sets of associated genes were analyzed for functional significance.
2.4
Allele Effect Patterns
Allele effect patterns (AEP) reflect the estimated effect on expression of having the allele from the corresponding haplotype. We generated plots of these effects across a specific eQTL interval when the estimated intervals overlapped in the two studies. These AEP were compared and separated based on a set of criterion described below. The correlation of the eight allele effects between experiments was used to discriminate those comparisons that were inverted (values near -1) and comparisons that likely match (values near 1). An inverted comparison implies that the same founder strain has opposing effects in each study, while a matching effect implies the two effects synergistic. Those comparisons whose correlation is near 0 are termed ambiguous. These effects are too nebulous for us to obtain quality groupings and so they are censored from this study. Next, silhouette widths were assess for different k-means clustering of the effects (k= [2-7]). The k that minimized the interquartile distance and maximized the mean of the silhouette widths was selected as the appropriate cluster number. Silhouette widths measure the cohesion of the cluster compared to other clusters. A high value for each silhouette implies appropriate clustering, whereas many widths that are very low implies an inappropriate k value. The effects are separated this way into two or three groups based on kmeans clustering with (k=2 or 3). Any more than three groups become difficult to score and were left out of this analysis. This step creates two or three groups of effects in either high and low, or high, intermediate and low groups respectively. If there is sufficient evidence for more than 3 clusters the comparison is considered ambiguous. If the clusters do not agree in the comparison then it is considered a non-match.
The use of allele effects provides a way of excluding overlapping intervals where the effects between studies do not match. It has been illustrated in the previous work in the pre-CC that we can reduce a single interval be excluding those positions that do not agree with the estimated effects.[3, 18]Here we apply the same rational to refute the idea that an eQTL is the same in both studies if the corresponding AEP do not match between them.
2.5
Gene Set Analysis
2.5. GENE SET ANALYSIS CHAPTER 2. MATERIALS & METHODS
CHAPTER
3
RESULTS
3.1
Expressed Genes
3.2. AAD EQTL CHAPTER 3. RESULTS
3.2
AAD eQTL
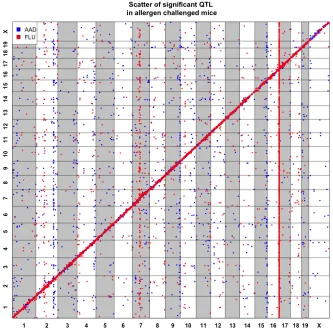
The AAD study produced 6,971 eQTL for 5,031 genes (5,031/9,612; 52.34%), shown in blue in figure 3.1. We found, just as in the previous study, that the majority of eQTL in this analysis were cis-eQTL (> 90%). In total there were 6,317 cis-eQTL associated with 4,717 genes, and 651 trans-eQTL associated with 610 genes. For the 500 genes with the largest adjusted p-values, the GO terms leukocyte and lymphocyte mediated immunity were significantly over-represented (q-value=0.00289, 0.00544). There was also enrichment for antigen processing and presentation (q-value=0.0489)
Additionally, trans-eQTL bands were observed on chromosomes 2, 9, and 15, blue vertical clusters in figure 3.1. Each of these bands contained more than 50 trans-eQTL under the control of a single region. The trans-eQTL band at chromosome 2 had been previously described to be associated with eosinophil QTT.[19]It contained 102 trans-eQTL and was enriched for GO terms related to cell death (q-value=0.0226) and DNA binding (q-value=0.00478). The trans-bands on chromosome 9 and 15 were also analyzed for functional annotation enrichment. Chromosome 9 contained 64 trans-eQTL and was significantly enriched for chemokine signaling and showed over-representation for GO terms like interleukin15 production as well as CD4 receptor binding (all q-value<0.01). The 56 trans-eQTL within the chromosome 15 trans-eQTL band contained no significant enrichments after FDR.
3.3
FLU eQTL
3.3. FLU EQTL CHAPTER 3. RESULTS
Figure 3.1Global plot for eQTL in both AAD and FLU studies
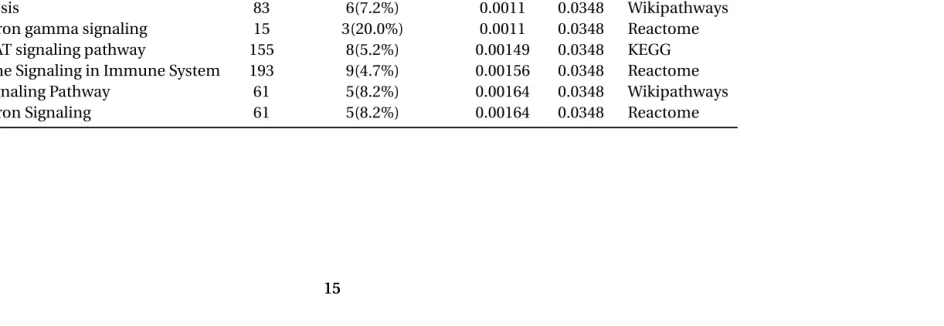
Table 3.1Functional Annotation Mx1
This table illustrates pathways overrepresented from the top 300 genes within the chromosome 16 trans band in the FLU data. There is strong representation for interleukin signaling, Interferon signaling and Jak-STAT signaling, all pathways important for immune and inflammatory responses.
Pathway Set Candidates Contained P-value Q-value Source
Regulation of IFNG signaling 11 3(27.3%) 0.000417 0.0348 Reactome
IL-3 Signaling Pathway 100 7(7.0%) 0.000514 0.0348 Wikipathways
Transcriptional misregulation in cancer 180 9(5.0%) 0.000956 0.0348 KEGG Cytokine-cytokine receptor interaction 266 11(4.3%) 0.00098 0.0348 KEGG
Apoptosis 83 6(7.2%) 0.0011 0.0348 Wikipathways
Interferon gamma signaling 15 3(20.0%) 0.0011 0.0348 Reactome
Jak-STAT signaling pathway 155 8(5.2%) 0.00149 0.0348 KEGG
Cytokine Signaling in Immune System 193 9(4.7%) 0.00156 0.0348 Reactome
IL-4 signaling Pathway 61 5(8.2%) 0.00164 0.0348 Wikipathways
3.3. FLU EQTL CHAPTER 3. RESULTS
The noticeable clustering of trans-eQTL around chromosome 16, depicted in red in figure 3.1, correspond to a well-known master regulator of influenza infection,Mx1. a mid-sized GTPase, which is involved in protecting against viral replication. This position alone contained 2,018 trans-eQTL that coordinate the expression of 1,722 downstream genes. 33.94% of all genes had an eQTL located atMx1. Gene set analysis on this trans-band confirms it’s strong association with immune response processes (Depicted in table 3.1). Additional trans-bands on chromosome 2 and 7, shown in red vertical clusters in figure 3.1, were also assessed for annotations. Chromosome 2 contained 42 trans-eQTL and was overrepresented for transport genes (q-value<0.01), and chromosome 7 contained 114 trans-eQTL and was overrepresented for antigen processing and ubiquitination (q-value<0.05).
Figure 3.2Partitioning of genes from individual experiments through analysis
3.4. SHARED EQTL CHAPTER 3. RESULTS
3.4
Shared eQTL
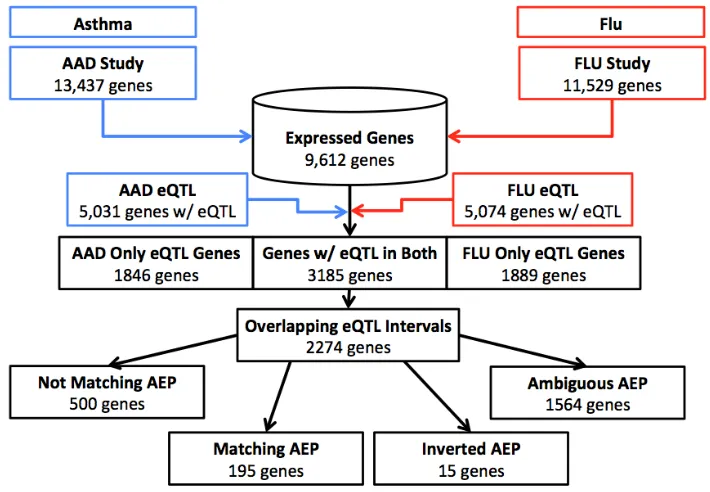
The results of both independent eQTL analyses were compared and eQTL that were observed in both studies were assessed. There were 6,920 genes (71.99%) that had eQTL in at least one of the studies. Only 1,846 and 1,889 genes had eQTL in only the AAD or FLU study respectively. The genes within these two groups were mostly from the trans-bands (AAD=30.6% and FLU=55.6%) observed during the independent mapping of the eQTL. There were 984 eQTL, 41.13% of the eQTL only in the FLU study, that originate from theMx1locus. There were significantly more genes (3,185) that had at least one eQTL in both studies than would be expected in a population of 9,612 genes by chance (p-value=2.09e-49).
When we compared the eQTL intervals of the shared genes, we found that only 2,281 genes also shared an interval. This step removed 904 genes, and indicates that there are fewer shared eQTL regions than there are shared genes between studies. Of these genes, 2,274 are genes with cis-eQTL and 7 are genes for trans-eQTL. There were significantly more cis-eQTL observed with matching intervals than would be expected given the number of cis-eQTL observed in either study (p-value=2.21e-32). This significantly large number of cis-eQTL could be the result of the distinct trans-bands observed in each experiment. It was expected that there would be more cis-eQTL since many genes in both studies will have nearby eQTL. The distinct trans-bands contributed to this overrepresentation of cis-eQTL overlaps as well. With a third of the eQTL in the FLU study being associated with theMx1trans-band it is especially unsurprising that there are fewer shared trans-eQTL. These genes correspond to 2,974 and 2,525 eQTL respectively for AAD and FLU studies, where discrepancies are found where two eQTL were discovered for the same gene. The enrichment for GO terms associated with this subset of genes were for peptide antigen binding (q-value<0.05) and the lysosome KEGG pathway (q-value<0.05).
The other 903 genes that were shared between studies, but did not share the same eQTL interval, were compared. These genes that were not colocalized to the same eQTL position were in most cases due to a trans-eQTL in one experiment associated with a cis-eQTL for the same gene in the separate study (>98%). 643 genes had trans-eQTL forMx1in the FLU study matching with a cis-eQTL in the FLU study. One example of these is theFcer1ggene, which codes for the high-affinity IgE receptor. This gene had a cis-eQTL near its location on chromosome 1 in the AAD study, but in the FLU Study, it had a trans-eQTL near the position of the well-known IAV resistance geneMx1, which could indicate its upstream influence on the expression ofFcer1g.
3.5. ALLELE EFFECTS COMPARISONS CHAPTER 3. RESULTS
3.5
Allele Effects Comparisons
Allele effect pattern comparisons were made to assess whether eQTL observed in both studies are supported at the allelic level. AEP that were not ambiguous were considered either matching, not matching, or inverted. The gross majority of these comparisons resulted in non-match classifier as shown in figure 5. Only about 27.2% (193/708) of the comparisons had matching AEP. This indicates our previous report of significant overlaps in eQTL only extend to their constructed intervals and overrepresent the real number of shared variants between insults. Those AEP that don’t match suggest that the region that is shared contain multiple positions contributing control to the gene in different conditions. Matching AEP could indicate support of the same locus being involved in both studies. While inverted and non-matching effects could indicate the presence of multiple variants from the same founder strain.
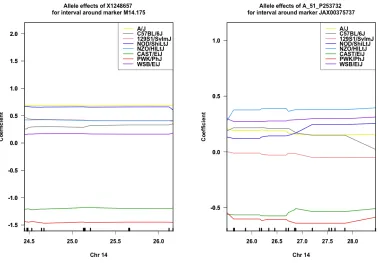
Figure 3.3Example of matching AEP
This figure illustrates and example of shared eQTL with matching allele effects in both studies. These types of results indicate that, likely, the same regulatory element is responsible for both associations.
3.5. ALLELE EFFECTS COMPARISONS CHAPTER 3. RESULTS
inflammation. CAST/EiJ and PWK/PhJ founder strains are associated with reduced levels ofIl17rd
expression. While the other strains group together and appear to influence higher expression of theIl17rdgene. This information implies that this gene is important in both insults, and that this same eQTL interval exerts control on the expression of the gene in both insults. The fact that in both experiments the same founder strain drives this association indicates that they may both in fact be driven by the same causal variant.
The Bottomly et al. paper concludes that there were three poorly characterized genes within the flu dataset that were important to resistance to IAV infection.[17]One of these uncharacterized genes,BC022687, serves as a second example of matching AEP. The same eQTL interval associated with this gene was observed in the AAD study as well.[19]This same eQTL interval, associated with
BC022687, is detected in both datasets of the current analysis as well.
Figure 3.4Example of inverted AEP
This figure illustrates and example of shared eQTL with inverted allele effects in both studies. These types of results indicate that, likely, different regulatory elements are responsible for both associations, but that the same founder strain harbors the effects.
3.5. ALLELE EFFECTS COMPARISONS CHAPTER 3. RESULTS
CHAPTER
4
DISCUSSION
4.1
Functional enrichment within gene sets
We assessed a number of gene sets that were uniquely controlled by one of the two experimental conditions. Three main groups of genes were analyzed for functional enrichment. These groups include differentially expressed genes (Appendix-C), trans-bands, and genes downstream of eQTL intervals that are found in only one of the two studies. The enrichments produced from these groups had members that often indicated immune response and in some cases were unique to either AAD or IAV. The example of the chromosome 16 trans-band forMx1clearly indicates an influenza infection response being mounted in these animals. Functional enrichment at AAD study trans-bands, such as the one on chromosome 9 indicate cell communication GO terms such as IL-15 production.
4.2. TRANS-EQTL BANDS CHAPTER 4. DISCUSSION
you are actually performing a filtering for gene expression that is uniquely varying with a genomic region, which will results in distinct patterns difficult to cluster.
Because of this difficulty we compared these datasets to ascertain genes with eQTL discrete to an insult before gene set analysis. These results, where common eQTL between studies are removed, showed better enrichment during gene set analysis. This makes sense, by removing eQTL common to multiple insults we expect to distill those eQTL that are specific to an insult. There were some high quality enrichments to note. The FLU eQTL, for instance, were enriched for Influenza A response pathways at a q-value<0.05, which supports the notion that there is an over-representation of genes involved with host response to flu within the set of flu specific eQTL. Additionally, AAD eQTL were enriched for leukocyte and lymphocyte mediated immunity (q-value<0.05).
There were some interesting enrichments observed within the two studies as well that support some emerging new systems related to these diseases. Cilia are important first defenses against respiratory insults. The secretion of ligands that bind to the surface of virions and allergens prevent these from interacting with the cells themselves and immobilize the particle in the mucosal film of the alveolar epithelium.[29]These cilia also play an important role in clearing this mucous from the lungs and thus clearing some of the particles contained within.[29]There were enrichments within the AAD study specific eQTL that implicate cilial formation and morphology as significant ontologies. Enrichment for collagen pathways reinforces the AAD pathology of collagenitis. Concurrent eQTL in both studies for the geneBC022687link cilia morphology and formation to effects in both AAD and FLU studies. The FLU study eQTL appeared to show enrichment for the insulin pathway as well as type II diabetes mellitus. These associations agree with the literature that indicates more severe influenza infections and higher susceptibility in mice that have characteristics of type II diabetes.
[30]Both studies showed consistent enrichment for metabolic processes. These processes have been implicated previously in differences in response to insults.[31]The immune system and all the cell types that play a role in its function are tightly regulated, and so it is unsurprising that subtle perturbations can contribute to substantial differences in response.
4.2
Trans-eQTL Bands
In this study trans-bands could be employed to classify an AAD or IAV response. These bands, by their definition, are clusters of associations of many gene expression traits with a single genomic locus. The biological hypothesis behind these trans bands is that they are regions associated with large-scale regulation of the expression of the genome. The example presented here are the 3 trans bands characterized on chromosomes 2, 9, and 15 in the AAD eQTL scans. Genes in these trans-bands were clearly associated with signaling and classic immune response signaling pathways.
4.3. SHARED EQTL AFTER AEP COMPARISON CHAPTER 4. DISCUSSION
at the well-defined master regulator gene,Mx1, which lies on chromosome 16 and has been well characterized previously.[32]This trans-band alone contributed a great deal of the eQTL in the FLU study (30.9%) and almost all of the trans-eQTL (75.8%). This helps to explain why a significant number of genes were observed that had eQTL in both experiments, before we delved into comparing the intervals and AEP. 903 of the genes that had eQTL in both studies did not have eQTL at the same interval. More than 70% of these genes with different intervals in the different experiments were a result of trans-eQTL forMx1in FLU that corresponded to a cis-eQTL in the AAD study, and even more fall into this group when we consider trans-eQTL for AAD that matched anMx1localized eQTL for the same gene (78.7%). The above example of the IgE receptor,Fcer1g, illustrates this with the AAD eQTL on chromosome 1 and the FLU eQTL on chromosome 16 near the IAV resistance geneMx1. This association is supported by observations of increased IgE levels in virus-infected individuals.[33, 34]
Not only were the signals within these trans-bands enriched for treatment specific ontologies. They also served as unique identifiers to either study. The only near overlap were the two trans-bands on chromosome 2 in both studies, but the trans-band in the AAD study is more distal on the chromosome than in the FLU study indicating that their intervals do not overlap. The existence of these treatment specific trans-bands alone allows us to discriminate between exposures. This is an important factor biologically in that these distinct large subsets of genes are under the regulatory control of distinct loci dependent on environmental conditions.
4.3
Shared eQTL after AEP comparison
In this analysis we detected more than 2000 genes which had eQTL in both experiments that colocalized to the same genomic region. These genes could be considered core genes influencing both lung immune responses. However, because we do not have BAL RNA extracts from control mice we can not be sure that all of these genes are relevant to lung immune response. It is possible that some of these shared eQTL would actually be shared in a control group as well. These would represents variation in these gene expression not explained by either treatment. We would expect these eQTL to be mostly cis-eQTL for the control case, and some of those cis-eQTL would likely have an overlap with those shared between the two test exposures. An analysis of the eQTL in a control group of mice would give us some information about which of our shared eQTL are independent of treatment. It would be interesting to also compare the allele effects between this control group and the two experimental conditions. This would give us additional information to assess whether the two observed experimental eQTL were the same variant or different variants.
4.4. EXTENT OF EQTL SHARING BETWEEN THESE STUDIES CHAPTER 4. DISCUSSION
common variants are shared between two complex diseases. Previous studies have shown these overlaps between treatments in dendritic cells.[6, 8]Here we present a comparison between BAL recovered from related mice to address the extent of sharing between AAD and IAV pathologies.
For those eQTL intervals that overlapped between studies it was important to observe the allele effect patterns. It is well established that cis-regulatory regions cluster within the upstream promoters of genes.[35]Therefore, it is not enough to simply find overlapping eQTL intervals. The AEP provide us with a way of giving support or opposition to the presence of a single variant between studies. The example above ofIl17rdillustrates a potentially true variant associated with response in two different insults, because the eQTL intervals overlap and the AEPs match between insults. Previous literature has implicated deficiencies in its expression to increased induction of NF-ΚB,
Il-6 and keratinocyte chemoattractant (KC).[36]These results and the biological implication seem to imply that this same eQTL is important in both experimental conditions. This could imply that these mice have less neutrophil recruitment due to the lower expression of this required receptor. Neutrophil recruitment is an important and balanced process for combating foreign invaders. Too much recruitment can result in increased inflammation and damage to the host while too few neutrophils may not adequately protect and clear invaders.[36–38]
The matching AEP for the uncharacterizedBC022687gene is also an interesting result that implies a single eQTL in both insults. The gene is also annotated asCspp1, and is associated with spindle fiber formation. Other studies have shown that deficiencies in this gene contribute to poor ciliogenesis and impaired sonic hedgehog,SHH, signaling.[39]This could potentially help explain the purpose of this shared eQTL, as signaling between cells is important for both innate and adaptive immune responses.[37, 38]
4.4
Extent of eQTL sharing between these studies
4.4. EXTENT OF EQTL SHARING BETWEEN THESE STUDIES CHAPTER 4. DISCUSSION
that lowered expression reduced viral titers and inhibited virion formation.[40]In the context of these two results it is interesting that there is this apparent inversion. This could indicate that different positions, but the same founder allele contribute to the observed associations. There is less evidence in support of the same locus variant causing both up and down regulation dependent on the treatment. Model cases can be imagined of more complex interactions at the locus, such as a regulatory motif that has context dependent effects on gene expression. However, the more likely reason is that while the same founder strain is driving effects in both conditions, the observed expression levels, in either study, are the result of different regulatory loci within the detected interval. This interpretation is further supported by the observation that CAST/EiJ and PWK/PhJ and WSB/EiJ founder strains alleles are driving expression differences for many of the detected eQTL. All three strains are derived from wild caught mice, while the other five strains originate from inbred laboratory strains[3, 13]. The fact that the majority of matching allele effects were for the wild-derived founder strain may further over estimate the extent of shared eQTL, because this may imply that some matching AEP may obscure multiple eQTL.
BIBLIOGRAPHY
1. Brem, R. B., Yvert, G., Clinton, R. & Kruglyak, L. Genetic Dissection of Transcriptional Regulation in Budding Yeast.Science296,752–755.ISSN: copiado para ARQUIVO (2002).
2. Albert, F. W. & Kruglyak, L. The role of regulatory variation in complex traits and disease.Nature Reviews Genetics16,197–212.ISSN: 1471-0056 (2015).
3. Aylor, D. L.et al.Genetic analysis of complex traits in the emerging Collaborative Genetic analysis of complex traits in the emerging Collaborative Cross.Genome Research21,1213– 1222.ISSN: 1549-5469 (2011).
4. Huang, W.et al.Genetic basis of transcriptome diversity in Drosophila melanogaster. Proceed-ings of the National Academy of Sciences of the United States of America112,E6010–9.ISSN: 1091-6490 (2015).
5. West, M. A. L.et al.Global eQTL mapping reveals the complex genetic architecture of transcript-level variation in Arabidopsis.Genetics175,1441–1450.ISSN: 00166731 (2007).
6. Fairfax, B. P.et al.Innate Immune Activity Conditions the Effect of Regulatory Variants upon Monocyte Gene Expression.Science343,1246949.ISSN: 0036-8075, 1095-9203 (2014).
7. Fu, W., O’Connor, T. D. & Akey, J. M. Genetic architecture of quantitative traits and complex diseases.Current opinion in genetics & development23,678–83.ISSN: 1879-0380 (2013).
8. Lee, M. N. H. M. N.et al.Common Genetic Variants Modulate Pathogen-Sensing Responses in Human Dendritic Cells.Science343,1246980.ISSN: 1095-9203 (2014).
9. Peters, J. E.et al.Insight into Genotype-Phenotype Associations through eQTL Mapping in Multiple Cell Types in Health and Immune-Mediated Disease.PLoS Genetics12.ISSN: 15537404. doi:10.1371/journal.pgen.1005908(2016).
10. Leonardson, A.et al.Genetics of gene expression and its effect on disease.Nature452,423–8.
ISSN: 1476-4687 (2008).
11. Lees, C. W., Barrett, J. C., Parkes, M. & Satsangi, J. New IBD genetics: common pathways with other diseases.Gut60,1739–1753.ISSN: 0017-5749 (2011).
12. Lonsdale, J.et al.The Genotype-Tissue Expression (GTEx) project.Nature Genetics45,580–585.
ISSN: 1061-4036 (2013).
13. Threadgill, D. W., Miller, D. R., Churchill, G. a. & de Villena, F. P.-M. The collaborative cross: a recombinant inbred mouse population for the systems genetic era.ILAR journal/National Research Council, Institute of Laboratory Animal Resources52,24–31.ISSN: 1930-6180 (2011).
BIBLIOGRAPHY BIBLIOGRAPHY
15. Churchill, G. a.et al.The Collaborative Cross, a community resource for the genetic analysis of complex traits.Nature genetics36,1133–1137.ISSN: 1061-4036 (2004).
16. Han, B. & Eskin, E. Interpreting Meta-Analyses of Genome-Wide Association Studies.8.doi:10.
1371/journal.pgen.1002555
(2012).17. Bottomly, D.et al.Expression Quantitative Trait Loci for Extreme Host Response to Influenza A in Pre-Collaborative Cross Mice.G3: Genes|Genomes|Genetics2,213–221.ISSN: 2160-1836 (2012).
18. Ferris, M. T.et al.Modeling Host Genetic Regulation of Influenza Pathogenesis in the Collabo-rative Cross.PLoS Pathogens9,e1003196.ISSN: 1553-7374 (2013).
19. Kelada, S. N. P.et al.Integrative genetic analysis of allergic inflammation in themurine lung. American Journal of Respiratory Cell and Molecular Biology51,436–445.ISSN: 15354989 (2014).
20. Rutledge, H.et al.Genetic Regulation of Zfp30, CXCL1, and Neutrophilic Inflammation in Murine Lung.Genetics198,735–745.ISSN: 0016-6731 (2014).
21. Kelada, S. N. P.et al.Genetic Analysis of Hematological Parameters in Incipient Lines of the Collaborative Cross.G3: Genes|Genomes|Genetics2,157–165.ISSN: 2160-1836 (2012).
22. Mott, R, Talbot, C. J., Turri, M. G., Collins, a. C. & Flint, J. A method for fine mapping quantitative trait loci in outbred animal stocks.Proceedings of the National Academy of Sciences of the United States of America97,12649–12654.ISSN: 0027-8424 (2000).
23. Gatti, D. M.et al.Quantitative Trait Locus Mapping Methods for Diversity Outbred Mice. G3: Genes|Genomes|Genetics4,1623–1633.ISSN: 2160-1836 (2014).
24. Shabalin, A. A. Matrix eQTL: Ultra fast eQTL analysis via large matrix operations.Bioinformatics
28,1353–1358.ISSN: 13674803 (2012).
25. Huang, D. W., Sherman, B. T. & Lempicki, R. A. Systematic and integrative analysis of large gene lists using DAVID bioinformatics resources.Nature Protocols4,44–57.ISSN: 1754-2189 (2008).
26. Huang, D. W., Sherman, B. T. & Lempicki, R. A. Bioinformatics enrichment tools: Paths toward the comprehensive functional analysis of large gene lists.Nucleic Acids Research37,1–13.
ISSN: 03051048 (2009).
27. Kamburov, A., Stelzl, U., Lehrach, H. & Herwig, R. The ConsensusPathDB interaction database: 2013 Update.Nucleic Acids Research41,793–800.ISSN: 03051048 (2013).
BIBLIOGRAPHY BIBLIOGRAPHY
29. Tilley, A. E., Walters, M. S., Shaykhiev, R. & Crystal, R. G. Cilia dysfunction in lung disease. Annual review of physiology77,379–406.ISSN: 1545-1585 (2015).
30. Reading, P. C., Allison, J, Crouch, E. C. & Anders, E. M. Increased susceptibility of diabetic mice to influenza virus infection: compromise of collectin-mediated host defense of the lung by glucose?J Virol72,6884–6887.ISSN: 0022-538X (1998).
31. Gerriets, V. A. & Rathmell, J. C. Metabolic pathways in T cell fate and function.Trends in Immunology33,168–172.ISSN: 14714906 (2012).
32. Salomon, R.et al.Mx1 gene protects mice against the highly lethal human H5N1 influenza virus.Cell Cycle6,2417–2421.ISSN: 15384101 (2007).
33. Suzuki, S, Suzuki, Y, Yamamoto, N, Matsumoto, Y, Shirai, A & Okubo, T. Influenza A virus infection increases IgE production and airway responsiveness in aerosolized antigen-exposed mice.The Journal of allergy and clinical immunology102,732–40.ISSN: 0091-6749 (1998).
34. Yamamoto, Net al.Dendritic cells are associated with augmentation of antigen sensitization by influenza A virus infection in mice.European journal of immunology30,316–26.ISSN:
0014-2980 (2000).
35. Gompel, N., Prud’homme, B., Wittkopp, P. J., Kassner, V. A. & Carroll, S. B. Chance caught on the wing: cis-regulatory evolution and the origin of pigment patterns in Drosophila.Nature
433,481–487.ISSN: 0028-0836 (2005).
36. Mellett, M.et al.Orphan receptor IL-17RD tunes IL-17A signalling and is required for neu-trophilia.Nature Communications3,1119.ISSN: 2041-1723 (2012).
37. Holgate, S. T. Innate and adaptive immune responses in asthma.Nat. Med.18,673–683.ISSN: 1546170X (2012).
38. Newton, A. H., Cardani, A. & Braciale, T. J. The host immune response in respiratory virus infection: balancing virus clearance and immunopathology.Seminars in Immunopathology
38,471–482.ISSN: 18632300 (2016).
39. Shaheen, R.et al.Mutations in CSPP1, encoding a core centrosomal protein, cause a range of ciliopathy phenotypes in humans.American Journal of Human Genetics94,73–79.ISSN: 00029297 (2014).
40. Watanabe, T.et al.HHS Public Access.16,795–805 (2015).
APPENDIX
A
QTL MAPPING
A.1
Hematology
QTL analysis is centered around the analysis of variance for a phenotypic trait at markers scattered throughout the genome of individuals in an experiment, and because of this fact we must assess whether our traits conform to a roughly Normal distribution in order for the tests to reflect real results. To this end we plotted histograms and performed Shapiro-Wilk tests of each phenotype as a qualitative and quantitative approach to assessing normality. After analysis we selected proper transforms between (raw (untransformed), log, and square root) for each phenotype based on maximizing the score of W in the Shapiro-Wilks test between the above transformation scalars.
A.2
Peak conditioning
A.3. CONDITIONING FOR SAMPLE BATCHES APPENDIX A. QTL MAPPING
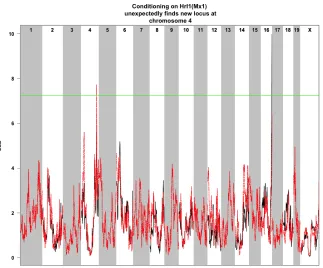
We successfully suppressed the peak in this interval, but the results yielded no new QTL. In fact a previously observed QTL peak for RDW vanished when conditioning for the MCV peak thus leading us to the conclusion that this peak is likely just an artifact of a second locus that is potentially in LD with this peak for MCV.
A.3
Conditioning for Sample Batches
A second concern was that of batch effects, since not all samples were collected or analyzed on the same day, we wanted to perform scans were we included an additive covariate for samples within the same batch. The resulting scans were only subtly different than the pervious scans of the transformed data. After this we sequentially dropped batches from the analysis (approximating a Drop-D permutation). This further confirmed that the peak for RDW was an artifact as the peak could be lost depending on the batches that were actually used in the scan.
A.4
Removing Outliers
We performed analyses similar to above with phenotype files where outliers had been removed and this again yielded no new QTL and did not significantly change the results of scans except for again suppressing the peak for RDW on Chr1 again further indicating that it was in fact an artifact.
A.5
Manhattan plots
After creating the scans we decided to also use manhattan plots to visualize the scans. An example of this type of plot is depicted in figure A.1 These plots had the added advantage of allowing us to highlight individual SNPs of particularly high association with a peak along the genome. This made it easier to select the most likely SNPs to control for in subsequent conditional scans and to ascertain the genotypic state of individuals in order to do post-hoc tests of allele effects.
A.6
Results
A.6. RESULTS APPENDIX A. QTL MAPPING
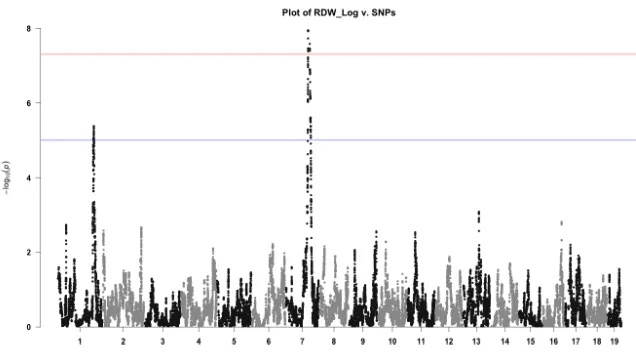
Figure A.1Manhattan plot of log(RBC Diameter Width)
This plot depicts a manhattan plot generated from a scan of RBC diameter width. There is one clear QTL on chromosome 7, near the same region of a mean cell volume (MCV) QTL, and another suggestive peak on chromosome 1. The advantage of this type of plot is that we can highlight individual SNPs of particular interest at the position of QTL.
APPENDIX
B
INSUFFICIENT SAMPLES LEAD TO
OVERFIT DATA
B.1
Uncharacteristic AEP
An issue that we encountered when performing some QTL analysis on a set of CC mice that were provided from collaborator was the issue of too few samples. The study attempted to explore QTL associated with a number of phenotypic parameters. The issue was noticed when observing AEP for significant peaks in the nominal scan. The allele effect corresponding to the PWK/PhJ and WSB/EiJ founders had uncharacteristically sharp spikes greatly exceeding the range of commonly observed allele effects. This is illustrated in figure B.1.A To address this strange issue we went back to look at the input data.
B.1. UNCHARACTERISTIC AEPAPPENDIX B. INSUFFICIENT SAMPLES LEAD TO OVERFIT DATA
Figure B.1Addition of simulated PWK mice
B.2. PSEUDO COUNTS APPENDIX B. INSUFFICIENT SAMPLES LEAD TO OVERFIT DATA
B.2
Pseudo counts
To verify that this lack of representation of a founder contributes to an overfit mode and thus results in inaccurate estimates of the beta coefficient associated with the last of the eight founder states I introduced simulated mice. These mice were created to be entirely PWK/PhJ inbred mice and have an average phenotypic value, so they are not the mice driving QTL detection, and re-scan the genomes. With the addition of a few of these simulated mice, where there were previously no PWK/PhJ haplotypes successful controlled the wild estimations of the WSB/EiJ coefficient (Figure B.1.B). While it is odd that the coefficient corresponding to the WSB/EiJ founder strain was the coefficient to be characteristic a careful consideration of linear regression explains the phenomena. Generally, each beta coefficient tries to minimize the sum of square errors (SSE) for a sample. However, since there is no data for the estimation of the effect of the PWK/PhJ allele. The variance of the estimates are large leading to rapid large changes to the correspondingβ-coefficient. Because
APPENDIX
C
DIFFERENTIAL EXPRESSION
C.1
Response Groups
Differential expression was assessed in each study. In each study mice were separated into high and low response group. In the AAD study low response mice had log10(eosinophil count)>5.5 and log(il5+1)>5.0. The low response group of mice had log10(eosinophil count)<4 and log(il5+1)< 1.5. The FLU mice were separated similarly to the methods of Bottomly et al.[17]Briefly, the high response group had immunohistochemical (IHC) staining scores of more than 4 and a day 4-weight loss of greater than 15
These groups were used as contrasts in the limma R package to perform differential expression analysis.[41]Those probes in either array that had greater than 1.5 Fold Change were chosen as differentially expressed and the top 300 in each study were assessed for gene set overrepresentation. Additionally, the overlap of differentially expressed genes was made into a gene set.
C.2
Differentially expressed genes
C.3. RESULTS APPENDIX C. DIFFERENTIAL EXPRESSION
expressed based on the associated p-values. This could be a result of the complex architecture under-lying the AAD responses. Regardless, within this set there is significant enrichment for annotation corresponding to inflammatory immune response. The FLU expression data were also analyzed for differential expression, and more than 2,667 genes were found to be differentially expressed (FC> 1.5). The top 300 of these differentially expressed genes showed strong enrichment for IAV response GO terms and pathways.
C.3
Results
APPENDIX
D
CONDITIONAL CORRELATION ANALYSIS
D.1
FLU trans-eQTL
One of the issues observed with the first pass analysis of the Flu dataset was that the split between cis- and trans- eQTL was almost 1:1. This is atypical of eQTL analysis, which generally shows a large proportion of cis-eQTL. However, historically eQTL studies of external perturbations, like viral infection, have produced higher proportions of trans- eQTL. Most of the excess of trans-eQTL in this study (2,054) were found on Chromosome 16 close to a well known Inuenza resistance master regulatorMx1. This region was previously observed in Bottomly et al.[17]and the founder allele effects at this locus were grouped by Ferris et al.[18]Sometimes referred to asHrI1(Host resistance to Inuenza 1)Mx1is thought to be the main gene driving this locus signal.[18]A second locus
D.1. FLU TRANS-EQTL APPENDIX D. CONDITIONAL CORRELATION ANALYSIS
Figure D.1Conditional Correlation scan of gene downstream of Mx1
D.2. CONDITIONING ONMX1LOCUS APPENDIX D. CONDITIONAL CORRELATION ANALYSIS
D.2
Conditioning on
Mx1
locus
There were 5,277 detected eQTL in this analysis. Of the total eQTL, 2868 (54.35%) were found to reside on the chromosome where the gene they correlate with is found. These eQTL are termed cis-eQTL and the low percentage was unexpected. To understand this a scatter plot of the total collection of eQTL was performed. In this plot we see a few regions where there are a large number of trans-eQTL. This may help to explain the high number of trans-eQTL, since we knowMx1is strongly tied to resistance to Influenza A, which is located in the trans-band on chromosome 16. In fact, there were 1782 trans-eQTL on chromosome 16, which is 75.67% of the total number of trans-eQTL. Conditional Scan There were 3,908 detected eQTL in this analysis. Of the total eQTL, 3,100 (79.33%) were cis-eQTL. To further compare these results to the previous ones we created another scatterplot of cis- versus trans- eQTL. The main differences between the original scan and this one were a signifcant reduction in trans- eQTL on bothHrI1andHrI2, which are on chromosomes 16 and 4 respectively. There was also a noticeable increase in trans- eQTL on chromosome 4.
D.3
Results
APPENDIX
E
MODULATED MODULARITY
CLUSTERING
E.1
Modulated Modularity Clustering
E.2. AAD EXAMPLE APPENDIX E. MODULATED MODULARITY CLUSTERING
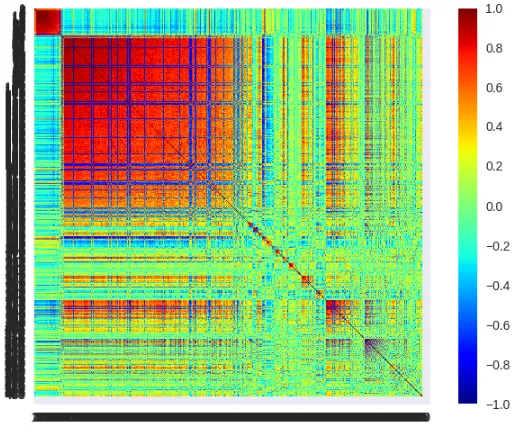
Figure E.1MMC of AAD differential expression
This heatmap was generated from gene expression that had greater than 1.5 FC when performing differen-tial expression analysis on high and low response groups in the AAD study. 300 genes were clustered and the results are the above correlated modules.
E.2
AAD Example
For both datasets using MMC with the top 300 genes that had greater than 1.5 FC, as described in the differential expression analysis appendix, yielded good quality clustering. The modules were large, but within them were genes that were all had highly similar annotation after gene set analysis. Some of the enrichments in some modules contained genes that we would expect to see associated with the diseases. Some modules in the AAD study had distinct members of immune response pathways, however few of the modules had significant numbers of members for significant enrichment in gene set analysis.
E.2. AAD EXAMPLE APPENDIX E. MODULATED MODULARITY CLUSTERING
Figure E.2MMC of AAD eQTL
E.2. AAD EXAMPLE APPENDIX E. MODULATED MODULARITY CLUSTERING