Miscibility Study of Nematic Liquid Crystal
with Cholesteric Liquid crystal
Dr.Rita Gharde
1, Mrs.Manisha G. Bhave
2Assistant Professor, Department of Physics, University of Mumbai, Santacruz (E), Mumbai, Maharashtra, India1
Research Student, Department of Physics, University of Mumbai, Santacruz (E), Mumbai, Maharashtra, India2
Abstract: Liquid crystals are characterized by high molecular orientation order in their mesomorphic states. The
mixture of liquid crystals influences the molecular orientation of liquid crystal compound consequently affecting their physical properties. In this paper, the main focus is on the study of the mixtures of Nematic liquid crystal and Cholesteric liquid crystal in different proportions. We have used Differential scanning calorimetry (DSC) technique to measure the Phase transition temperatures. Fourier Transform Infrared Spectroscopy (FTIR) and Ultraviolet–Visible (UV) spectroscopy are used to analyze the relative concentration of liquid crystals in the mixtures and their spatial distribution.The values of pitch for Cholesteric liquid crystal and the mixtures were calculated from ordinary refractive indices. Because of its low phase transition temperatures and less requirement of energy, the mixture of Cholesteric chloride with Cholesteryl oleate in 30%+70% proportion holds promise in the optical as well as non-optical applications of liquid crystals.
Keywords: Liquid Crystal (LC), Differential scanning calorimetry (DSC), Fourier Transform Infrared Spectroscopy
(FTIR), Ultraviolet Visible (UV) Spectroscopy, Pitch.
I. INTRODUCTION
Liquid crystals have become a consumer product with many everyday applications. A liquid crystal is a mesophase which has partially or completely lost the long range order of ordinary crystals, but still possesses one or more dimensional long range orientational order of certain anisometric units. [1], [2],[3] The mixture of liquid crystals bring the melting point down which helps or gives wide applicability of its use in various applications. These mixtures show phase transition temperatures and other physical properties which are different from their constituents.[4],[5]. In the present study the main focus is on the miscibility of Nematic liquid crystal and Cholestaric liquid crystal. Arnold,Sackman and Demus developed the miscibility rules which can be summarized as follows. [6], [7], [8], [9]. i) If two LCs are miscible, they are isomorphic and therefore belong to the same type of mesophase,
ii) If two LCs are isomorphic, they need not be necessarily miscible.
When two compounds are isomorphic within a certain mesophse, both their thermal transition temperatures and corresponding thermodynamic parameters exhibit continuous dependence on their components. This means that both the components of mixtures behave like an ideal solution. Therefore, by knowing the transition temperatures and thermodynamic parameters of the parent compounds, we can apply the equations of Schroeder and Van Lar(equation 1)to predict the phase diagram of the mixtures.
F1 = {1- {ΔH10T2 (T-T1)/ΔH20T1 (T-T2)}………….Equation1
F1=Molar fraction of components
T10CandΔH10 are the transition temperature and enthalpy change for pure component A.
T20CandΔH20 are the transition temperature and enthalpy change for pure component B.
T0C is the transition temperature corresponding to the molar fraction F1.
T0C should be lower than T2 0
C and higher than T1 0
C. (T1 0
C <T0C <T2 0
C)
A phase diagram that exhibits a higher or lower transition temperatures than the maximum or minimum T20C or
T10C respectively violets the temperature criteria. The negative, positive or linear dependence of T0c vs F1 is
II. RELATED WORK
In studying liquids crystals, we often want to expand the range of certain phases so the phase is more stable.[11] We also to alter the physical properties such as viscosity. An easy way to do this is to dope the liquid crystal with another liquid crystal.[12]The mixtures help in realignment of the liquid crystal molecules which can have a large effect on the electrooptical properties of a liquid crystal.[13],[14] .The previous researchers studied various properties of the liquid crystal mixtures using different techniques.V.S,Chandel,A.K.Singh,S.Manohar,J.P.Shukla and R.Manoher[15] studied phase transitions in binary mixture of Cholesteric liquid crystals. Their main focus is on different phases of liquid crystal mixtures. They not only observed new phases in the mixtures but also found higher thermal stability in the mixtures. Authors [16] measured dielectric, refractive, elastic and viscous properties of the HBLCMs.The mixtures measured high optical and dielectric anisotropies and relatively low rotational viscosities. This has applications in different kinds of liquid crystal electro-optical devices with low response times, operating in visible and near infrared regions. PK Mukherjee[17] studied the mixtures of HBAB {p-[(p-hexyloxy-benzylidene)-amino] benzonitrile} and CBOOA [N-p-cyanibenzylidene-p-n-octyloxyaniline].The mixtures exhibited a two phase region where both smectic-A and nematic phase coexists. is discussed by means of Landau formalism. The problem of the first or second order nature of the nematic-smectic-A phase transition is explored. General Landau theory for coupled orientational, translational order parameters and concentration is developed by the author to discuss the reason for this two phase region. Authors [18] formulated two exemplary high birefringence and low clearing temperature Liquid crystal mixtures, using the laterally substituted isothiocyannato tolane compounds. They observed decrease in the melting point (below 200C) in the mixtures. The temperature derivative of the mixtures was enhanced in the mixtures.
III.LIST OF CHEMICALS ANDSAMPLE PREPARATION
The present study was done using Nematic liquid crystal, Cholesteric liquid crystal and their mixtures in four different proportions. (Both the samples were procured from ALDRICH)
Sample A: Name of the sample: Cholesteryl oleate (Nematic phase) Molecular formula: C45H78O2; Melting point: 480C.
Sample B: Name of the sample: Cholesteryl chloride (Cholesteric phase) Molecular formula: C27H45Cl1; Melting point: 960C.
Mixtures of the samples were prepared in the different proportions. 5A + 5B: 50% of sample A & 50% of sample B
4A + 6B: 40% of sample A & 60% of sample B 3A + 7B: 30% of sample A & 70% of sample B
2A + 8B: 20% of sample A & 80% of sample B The two samples were first weighed accurately using analytical microbalance in the required proportions. Then the
mixture was stirred enough to ensure thorough and complete mixing. A small amount of this homogeneous mixture in powder form was sandwiched between two cover slips and the sides were sealed by non conducting tape. When the sample slide is heated, at a particular temperature the sample melts and spreads uniformly between the bottom and top cover slip.
IV.EXPERIMENTALTECHNIQUES
The essential tools used in present study are Differential scanning calorimetry (DSC), Fourier Transform Infrared Spectroscopy (FTIR), Ultraviolet Visible (UV) Spectroscopy and ordinary refractive indices using multiwavelength Abbe refractometer
1 Differential scanning calorimetry (DSC)
nearly at the same temperature throughout the experiment. The temperature of the sample holder increases linearly as a function of time. Even small changes in thermodynamic quantities at transitions between mesophases can be detected by DSC.The result of a DSC experiment is a curve of heat flux versus temperature or versus time. Most liquid crystal to liquid crystal transitions are discontinuous. Such transitions are revealed by larger peaks.
2 Fourier Transform Infrared Spectroscopy (FTIR)
FTIR is a powerful tool for identifying types of chemical bonds in a molecule by producing an infrared absorption spectrum that is like a molecular fingerprint. The FTIR spectroscopy detects the vibration characteristics of chemical functional groups in the sample.[10] When infrared light interacts with matter, chemical bonds will stretch, contract and bend. The chemical functional group absorbs IR radiation in a specific wave number range. It is a chemical analytical technique that measures the infrared intensity vs wavelength of light. The IR is divided into three regions i.e. far infrared ( 4 – 400 cm-1 ) , mid infrared ( 400 – 4000 cm-1 ) and near infrared (4000 – 14000 cm-1 ) It can be applied to the analysis of types of chemical bonds i.e. functional groups.IR spectroscopy works because chemical bonds have specific frequencies at which they vibrate corresponding to energy levels. From the recorded FTIR spectra various functional groups of different samples can be identified.
3 Ultraviolet Visible (UV) Spectroscopy
UV spectroscopy is an accurate and powerful procedure to analyze a substance. It measures the absorption, transmission and emission of ultraviolet and visible light by matter. Absorption of ultraviolet or visible light causes electron to move from lower to higher energy levels. Because the spectrum of an atom or molecule depends on its electron density level, it is useful for identifying unknown substances.
4 Determination of pitch from RI
Liquid crystals are birefringent in nature. When the light enters liquid crystals it splits into an ordinary ray and an extraordinary ray. The ordinary ray moves faster than the extraordinary ray. The cholesteric liquid crystals consist of thin birefringent layers normal to the optic axis and each one is turned through a small angle with respect to its neighbours.Because of this turn each linear component of the light experiences a change in refractive index while passing from one layer to the next .The changes will be an increase for the fast and a decrease for the slow component. By measuring the refractive index of ordinary ray (no)forthegivenwavelengthoflight(λ),pitch(P)oftheCholesteric
liquid crystal and the mixtures can be calculated using the relation,
………Equation2 If d is the spacing between thin birefringent layers of the cholesteric liquid crystals then
V. RESULTSANDDISCUSSION
1 Differential scanning calorimetry (DSC)
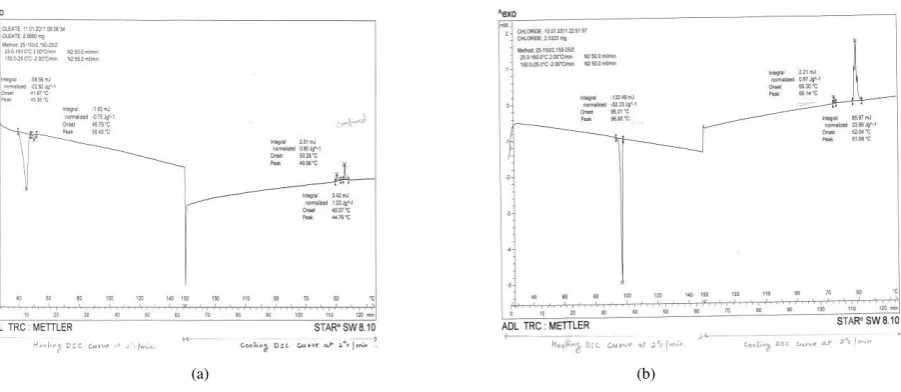
Fig.1. DSC Thermograph of (a) sample A (b) sample B
The fig 1. (a) and 1. (b) show the DSC thermographs for pure Cholesteryl Oleate and pure Cholesteryl Chloride respectively. The fig 1.a indicates the peaks at 45.350 C,50.430 C while heating and at 49.960 C,44.760 C while cooling. These are the phase transition temperatures for Cholesteryl Oleate. Similarly from fig 1.b 96.950 C,65.140 C,51.080C are the phase transition temperatures(PTT) for Cholesteryl Chloride. Similarly the phase transition temperatures for all the mixtures are measured from their respective DSC thermographs. The phase transition temperatures for A,B and their mixtures are presented table 1.The phase transition temperatures which are different than the pure Cholesteryl Oleate or pure Cholesteryl Chloride are indicated by the * on the top of the value. Also there is an increase in the value of heat absorbed for the mixtures.
Table 1
Sample A Sample B Sample5A+5 B Sample4A+6B Sample 3A+7B Sample2A+8 B
Peak
o C
Heat Jg-1
Peak
o C
Heat Jg-1
Peak
o C
Heat Jg-1
Peak
o C
Heat Jg-1
Peak
o C
Heat Jg-1
Peak
o C
Heat Jg-1
Heating Heating Heating Heating Heating Heating
45.35 -22.82 96.95 -52.33 40.15* -4.18 38.19* -5.55 39.78* -4.90 39.68* -1.17
50.43 -0.75 47.94* -0.28 48.02* -0.36 47.88* -0.2479 47.81* -0.12
95.35* -0.31 93.07* -2.66 91.83* -6.05 96.77 -18.77
Cooling Cooling Cooling Cooling Cooling Cooling
49.96 0.90 65.14 0.87 50.57 0.82 49.53 0.14 54.93* 0.92 58.30* 0.87
44.76 1.33 51.08 33.96 40* 13.27
50 55 60 65 70 75 80 91
92 93 94 95 96
97 Maximum PTT vs Mixture
M
a
xim
u
m
PT
T
% Concentration of B in Mixture
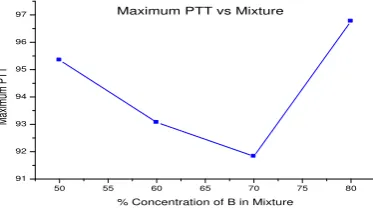
Fig.2 Maximum PTT in 0C Vs Concentration of B in Mixture (Maximum PTT: A = 50.430C, B = 96.950C)
Fig.2 indicates the values of maximum PTTS for all the mixtures. From the figure it is clear that the maximum phase transition temperature reaches minimum for the mixture 3A+7B. In the mixture of Cholesteryl Oleate and Cholesteryl Chloride, Chloride imparts optical activity to Oleate. The helix undergoes distortion thereby changing the pitch, resulting in the phase change. The maximum PTT for 5A+5B,4A+6B,3A+7B,2A+8B is less than that for the sample B.The maximum PTT for Sample B is 96.950 C which reduces to 91.830 C in the mixture 3A+7B.
2 Fourier Transform Infra-red Spectroscopy (FTIR)
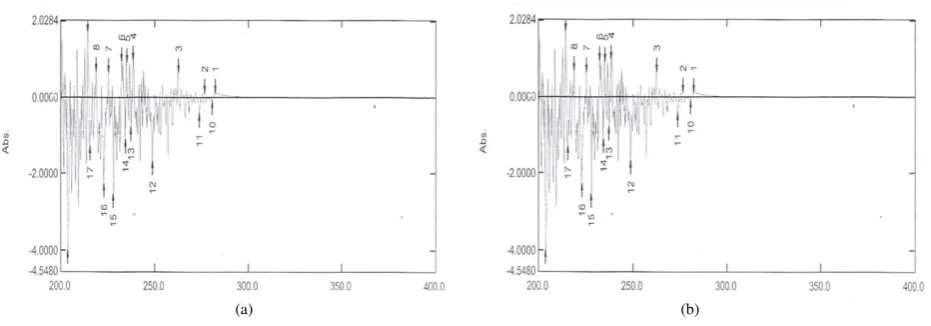
The fig.3 (a) and 3(b) show the FTIR graphs for pure Cholesteryl Oleate and the mixture 2A+8B respectively. From similar such FTIR graphs for sample B, 5A+5B, 4A+6B and 3A+7B , the values of the wavelengths with intensities for A, B, 5A+5B, 4A+6B, 3A+7B, 2A+8B are measured.
Fig.3: FTIR of (a) sample A,(b) sample 2A+8B
The wavelengths for different mixtures correspond to the wavelengths found either in sample A or in sample B or in both. The wavelengths which are found in all the mixtures are presented in table 2.The corresponding functional groups are identified and are also presented in the same table.
Table 2.: Wavelength, Intensity and Fu nctional grou p of A,B, 5A+5B, 4A+6B, 3A+7B, 2A+8B
Wavelength cm-1
Intensity for A
Intensity for B
Intensity for 5A+5B
Intensity for 4A+6B
Intensity for 3A+7B
Intensity for 2A+8B
Functional group
1 622.07 89.87980 90.62116 83.95854 75.13262 80.77960 Alkyl
Halide
2 698.26 86.36297 86.43396 79.49562 68.64833 75.91160
3 799.53 92.28832 76.36168 75.96584 67.87760 52.91806 61.44698
4 827.5 73.10736 78.79862 68.98070 54.37551 59.04991 Alkene
5 842.93 95.31636 _ 85.65219 78.79334 68.54327 76.85237
6 869.93 65.83800 80.22726 69.30085 54.71814 55.69348
7 881.51 78.11814 84.63236 74.89840 63.05371 66.08648
8 924.91 93.00774 87.74038 82.42069 73.01078 81.80713
9 959.63 93.14064 _ 74.58066 66.10171 50.64335 57.88395
10 1005.92 79.82349 72.45523 66.02169 50.63188 61.38835 Alcohol
11 1111.05 89.84302 83.09068 77.40827 65.78659 75.28553
12 1170.84 78.866666 89.11001 63.24916 63.03365 46.88258 65.99710 Ester
13 1217.14 81.58184 74.73960 68.23200 54.28905 64.14933
14 1245.1 86.06778 74.48194 69.35154 55.73544 67.94371
15 1255.71 85.93209 74.73650 68.98513 55.71534 67.02671
16 1294.29 86.78953 78.93704 72.75366 60.34057 69.98025
17 1333.83 74.74161 72.50887 64.36438 49.37273 56.36189 Alkyl
Halide
18 1378.2 58.44308 58.65336 52.07526 34.20830 41.11425
From Table 2 we can conclude that though the wavelengths are common, the intensities of absorption for the mixtures are different. This is because the sample molecules selectively absorb radiation of specific wavelengths which causes the change in the dipole moment. Consequently, the vibrational energy levels of sample molecules transfer from ground state to excited state. The frequency of the absorption peak is determined by the vibrational energy gap. The number of absorption peaks is related to the number of vibrational freedom of the molecule. The intensity of absorption peaks is related to the change of dipole moment and the possibility of the transition of energy levels. So the less value of the intensity of absorption indicates the stability in the structure. The mixture 3A+7B has less value of the intensity of absorption. This indicates that the mixture3A+7B has more stability amongst all the mixtures of A and B.
WhenaliquidcrystalmoleculeabsorbsIR,it’schemicalbondsvibrate,thebondscanstretch,contract and bend. From the FTIR graphs for sample A, B, 5A+5B, 4A+6B and 3A+7B,2A+8B the values of the stretching in the wavelengths are measured and indicated in table 3.The corresponding bonds are also given in the same table.
Table 3: Stretching between wavelengths and bond present in 5A+5B, 4A+6B, 3A+7B, 2A+8B
Sample Stretching between wavelengths cm-1 Bond present
5A+5B 1735.04cm-1 and 2851.33 cm-1 C=C
4A+6B 1735.04 cm-1 and 2850.91 cm-1 C=C
3A+7B 1735.04 cm-1 and 2851.88 cm-1 C=C
Fig4: Bond line formulae for (a) A, (b) B
The bond line formula for A as shown in Fig4 (a) indicates the presence of double bond(C=C),Alkenes and Easter(moity).Similarly the bond line formula for B indicates the presence of Halide(Chloride) and double bond(C=C). The double bond(C=C) is present in both the samples A and B which is also present in the mixtures as indicated in Table3.This confirms the miscibility of the two liquid crystals under study.
3 Ultraviolet – Visible (UV) Spectroscopy
The fig5 (a) and 5(b) show the UV for pure Cholesteryl Oleate and the mixture 5A+5B respectively.
Fig.5: UV of sample (a) A, (b) 5A+5B
The measurements of the absorbance peak and the corresponding wavelength range from UVs of A, B, 5A+5B,4A+6B, 3A+7B and 2A+8B are presented in table 4.
Table 4: Absorbance peak and Wavelength for A, B, 5A+5B, 4A+6B, 3A+7B, 2A+8B (λ:Wavelength, Abs: Absorbance)
Sample A Sample B Sample5A+5B Sample4A+6B Sample 3A+7B Sample2A+8B
λ Abs λ Abs λ Abs λ Abs λ Abs λ Abs 282.2 0.1133 276.8 0.3401 279.8 0.2623 283 0.3497 282.2 0.2114 282.8 0.1376 276.4 0.1179 256 0.5596 264.6 0.7092 279.4 0.1924 274.4 0.4022 265 0.4974 262.4 0.6642 244.6 1.0548 245.8 0.5092 276.2 0.1985 265.6 0.4429 253.4 0.6523 238.6 1.0006 240.4 1.9052 243 0.5905 266.4 0.5728 249.4 0.5349 246 1.1259 235 0.9257 229.8 1.1094 233 1.2798 261 0.2984 235.8 1.2412 240.6 0.5023 232.4 0.9540 220.2 1.7083 256.6 0.0865 221. 0.9436 233 0.6452 225.2 0.6710 208.4 1.7689 254.4 0.2718 205 0.7672 214.8 1.0292
Sample A: Cholesteryl Oleate (Nematic phase)
Sample B: Cholesteryl Chloride (Cholesteric phase)
(a) (b)
218.8 0.6801 250.2 0.5359 209.2 0.6941
214.2 1.7340 245.4 0.8767 206.6 1.4804
241.6 1.1084 202.8 0.2238
225.8 1.6348
Table 5 gives the wavelength range and the wavelength of maximum absorption for A, B, 5A+5B, 4A+6B, 3A+7B and 2A+8B.
Table 5: Wavelength range and longest wavelength for A, B, 5A+5B, 4A+6B, 3A+7B, 2A+8B
50 55 60 65 70 75 80
205 210 215 220 225 230 235 240
Longest wavelength vs Sample
L
o
n
g
e
s
t
wa
v
e
le
n
g
th
% concentration of B in Mixture
Fig.6: Longest Wavelength vs Concentration of B in Mixture
When light passes through the sample, energy from the light is used to promote an electron from a bonding or non-bonding orbital into one of the empty anti-non-bonding orbitals.Since the wavelength range of absorption for all samples is between 200nm to300nm, the molecule must contain either pi- bonds or atoms with non-bonding orbital. Similarly highly delocalized systems in a molecule are often responsible for absorbing light in the visible region. The absorption over a range of wavelengths rather than at fixed one suggests the continuous change in the gaps between the orbitals.This is because of the rotations and vibrations in the molecule are continuously changing the energies of the orbitals. This greater delocalization lowers the energy gap between the highest occupied molecular orbital and the lowest unoccupied pi -anti-bonding orbital. Because of which it needs less energy to promote an electron and so a longer wavelength of light is absorbed.Fig.6 indicates that the mixture 3A+7B absorbs the longer wavelength of light amongst all the mixtures. So the mixture 3A+7B will utilize less energy from the source.
4 Determination of pitch from RI
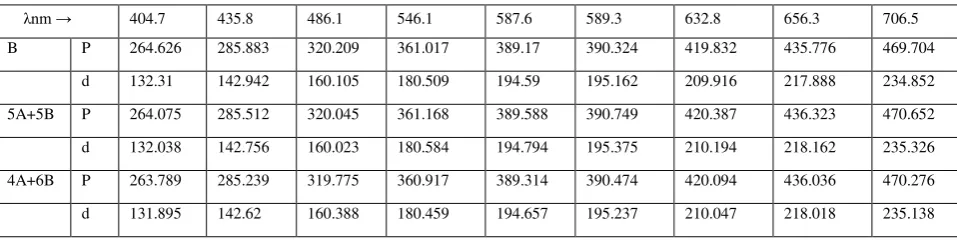
The values of pitch (P nm) and the spacing between thin birefringent layers (d nm) of the cholesteric liquid crystal B and mixtures 5A+5B,4A+6B,3A+7B,2A+8B at temperature 300C are calculated from equation 2 and equation 3.They are presented in the table 6.
Table 6: Pitch of B, 5A+5B, 4A+6B, 3A+7B, 2A+8B (P= pitch, λ=wavelengthofthelightused.)
λnm→ 404.7 435.8 486.1 546.1 587.6 589.3 632.8 656.3 706.5
B P 264.626 285.883 320.209 361.017 389.17 390.324 419.832 435.776 469.704
d 132.31 142.942 160.105 180.509 194.59 195.162 209.916 217.888 234.852
5A+5B P 264.075 285.512 320.045 361.168 389.588 390.749 420.387 436.323 470.652
d 132.038 142.756 160.023 180.584 194.794 195.375 210.194 218.162 235.326
4A+6B P 263.789 285.239 319.775 360.917 389.314 390.474 420.094 436.036 470.276
Wavelength range of absorption (nm)
Longest wavelength of absorption (nm)
A 214.2 - 282.2 214.2
B 229.8 - 276.8 240.4
5A+5B 208.4 - 279.8 208.4
4A+6B 225.8 - 283 225.8
3A+7B 205 - 282.2 235.8
3A+7B P 263.589 284.917 319.433 360.486 388.876 390.04 419.768 435.767 469.747
d 131.795 142.459 160.217 180.243 194.438 195.02 209.884 217.884 234.824
2A+8B P 266.133 287.497 321.886 362.821 391.097 392.255 421.83 437.787 471.919
d 133.067 143.749 160.943 181.411 195.549 196.128 210.92 218.894 235.960
The calculated values of pitch for all the mixtures match with the value of the pitch of cholesteric liquid crystal (sample B). For all the wavelengths, the value of pitch is minimum for the mixture 3A+7B.Also; the distance between the two successive layers of the mixture 3A+7B is minimum amongst all the values.
VI. CONCLUSION
We studied the miscibility of Nematic liquid crystal with Cholesteric liquid crystal, with increasing concentration of Cholesteryl Chloride in the mixtures. The transition temperatures obtained by Differential scanning calorimetry (DSC) were found to change depending on the proportion of the constituents. Lower transition temperatures were obtained when Cholesteric chloride is mixed with Cholesteryl Oleate in 30%+70% proportion indicating stabilizing effect of pitch of Cholesteric Chloride in the mixture. The Fourier Transform Infra-red Spectroscopy (FTIR) and Ultraviolet – Visible (UV) Spectroscopy techniques confirmed the miscibility of the two liquid crystals. The stability of the mixture 3A+7B was also confirmed by these techniques. The pitch and the spacing between thin birefringent layers is reduced in the mixture 3A+7B.So we can conclude that among all four mixtures studied by us, the mixture of Cholesteryl Oleate and Cholesteryl Chloride in 30%+70% proportion is more stable. Because of its low phase transition temperatures and less requirement of energy, the mixture of Cholesteric chloride with Cholesteryl oleate in 30%+70% proportion holds promise in the optical as well as non-optical applications of liquid crystals.
ACKNOWLEDGEMENT
I would like to thank Dr.Anuradha Mishra, Head, Department of the Physics, University of Mumbai and Dr.G.V,Rao ,I/C Principal, Siddharth College for their support.
REFERENCES
[1] S.Chandrasekhar, Liquid Crystals, Cambridge Uni. Press, Cambridge, London, (1977).
[2] N.H.Hartshone and A.Stuart, Crystals and Polarizing Microscope, Edward Arnold Publishers Ltd. London (1970). [3] P.J.Collings and M.Hird, Introduction to Liquid Crystals (Chemistry and Physics). Taylor and Fransic Ltd., London (1997). [4] S.J.Gupta,ProceedingsofDAESSPPPPS’98KurukshetraUniversityKurukshetra(1998).
[5] Gupta S. J., Gharde R. A. and Tripathi A. R. Laser Crystals, Glasses and Non linear Materials Growth and Characterization, (Proceedings of SPIE, USA), Vol. 4970, 2003, p89.
[6] Arnold H and Sackmann H Z, Phys Chem,213 137 (1960).
[7] DemusD,DielesandSackmannHZ,’Advancesinliquidcrystals’:6,editatedbyG.H.Brown(London: Academic),1(1983).
[8] Krigbaum W R,J Appl Polym Sci,Appl Polym Symp,41 105 (1985).
[9] Sackmann H Z and Demus D,Mol Cryst Liq Cryst,21 239 (1973).
[10] D.L.Beduhn and R.L.White.Appl.Spectrosc. 40,628 (1986).
[11] T.J. Dingemans, C-D. Poon, E.T. Samulski, H. Uehara, and J. Hatano, Liq. Cryst. 24(2), 247 (1998). [12] S. Jaradat, N.W. Roberts, Y. Wang, L.S.Hirst, and H.F. Gleeson, J. Mater. Chem. 16, 3753 (2006). [13] S-S. Seomun, T. Gouda, Y. Takanashi, K. Ishikawa, and H. Takezoe, Liq. Cryst. 26 (2), 151 (1999). [14] M.A. Osipov and D. Guillon, Phys. Rev. E 60 (6), 6855 (1999).
[15] Vishal Singh Chandel1, Avneesh Kumar Singh2, Shashwati Manohar3, Jagdeesh Prashad Shukla2, and Rajiv Manohar2.Phase Transitio n Study of Binary Mixture of Cholesteric Liquid Crystals Journal of Advanced Research in Physics 3(2),021203 (2012).
[16] Edward Nowinowski-Kruszelnicki1*, Jerzy Kedzierskl1,Zbigniew Raszewski1,Leszek Jaroszewicz1,RomandDabrowski1,Marek
Kojdecki1,Wiktor Piecek1,Pawel Perkowski1,Katarzyna Garbat1,Marek Olifierczuk1. High birefringence liquid crystal mixturesfor electro-optical devices.
[17] PK Mukherjee Molecular Crystals and Liquid Crystals Science and Technology. Section A. Landau Theory of Nematic-Smectic-A Transition in a Liquid Crystal Mixture - 1998.