University of Windsor University of Windsor
Scholarship at UWindsor
Scholarship at UWindsor
Electronic Theses and Dissertations Theses, Dissertations, and Major Papers
9-25-2018
Design of a Global Supply Chain for the Unexpected
Design of a Global Supply Chain for the Unexpected
Jessica Olivares Aguila University of Windsor
Follow this and additional works at: https://scholar.uwindsor.ca/etd
Recommended Citation Recommended Citation
Olivares Aguila, Jessica, "Design of a Global Supply Chain for the Unexpected" (2018). Electronic Theses and Dissertations. 7551.
https://scholar.uwindsor.ca/etd/7551
This online database contains the full-text of PhD dissertations and Masters’ theses of University of Windsor students from 1954 forward. These documents are made available for personal study and research purposes only, in accordance with the Canadian Copyright Act and the Creative Commons license—CC BY-NC-ND (Attribution, Non-Commercial, No Derivative Works). Under this license, works must always be attributed to the copyright holder (original author), cannot be used for any commercial purposes, and may not be altered. Any other use would require the permission of the copyright holder. Students may inquire about withdrawing their dissertation and/or thesis from this database. For additional inquiries, please contact the repository administrator via email
Design of a Global Supply Chain for the Unexpected
by
Jessica Olivares Aguila
A Dissertation
Submitted to the Faculty of Graduate Studies
through the Industrial and Manufacturing Systems Engineering Graduate Program in Partial Fulfillment of the Requirements for
the Degree of Doctor of Philosophy at the University of Windsor
Windsor, Ontario, Canada
Design of a Global Supply Chain for the Unexpected
by
Jessica Olivares Aguila
APPROVED BY:
______________________________________________ S. E. Moussa, External Examiner
University of Guelph
______________________________________________ R. Caron
Department of Mathematics and Statistics
______________________________________________ Z. J. Pasek
Department of Mechanical, Automotive and Materials Engineering
______________________________________________ H. ElMaraghy
Department of Mechanical, Automotive and Materials Engineering
______________________________________________ W. ElMaraghy, Advisor
Department of Mechanical, Automotive and Materials Engineering
iii
DECLARATION OF CO‐AUTHORSHIP / PREVIOUS
PUBLICATION
I. Co‐Authorship
I hereby declare that this thesis incorporates material that is result of joint research of the author and her supervisor Prof. Waguih ElMaraghy. This joint research has been submitted to Journals and Conferences that are listed below.
I am aware of the University of Windsor Senate Policy on Authorship, and I certify that I have properly acknowledged the contribution of other researchers to my thesis, and have obtained written permission from Prof. Waguih ElMaraghy to include the above material(s) in my thesis.
I certify that, with the above qualification, this thesis, and the research to which it refers, is the product of my own work.
II. Declaration of Previous Publication
This thesis includes four original papers that have been previously published/submitted for publication in peer‐reviewed journals and conferences, as follows:
Thesis
Chapter Publication title/full citation Publication status* 3 Olivares Aguila, J., and W. ElMaraghy. 2018.
"Simultaneous global supply chain and product architecture design considering natural hazard exposure and geographical facility location."
Procedia CIRP 72:533‐8. doi:
https://doi.org/10.1016/j.procir.2018.03.040.
Conference proceeding (published)
4 Olivares Aguila, J., and W. ElMaraghy. 2018. "Structural complexity and robustness of supply chain networks based on product architecture." International Journal of Production Research:1‐18. doi: 10.1080/00207543.2018.1489158.
Journal (published)
5 Olivares Aguila, J., and W. ElMaraghy, “Supply chain disruption analysis: A system dynamics approach.”
iv 6 Olivares Aguila, J., and W. ElMaraghy, “Supply chain
resilience and structure: An evaluation framework.”
ProcediaManufacturing
Conference proceeding (accepted)
I certify that I have obtained a written permission from the copyright owner(s) to include the above published material(s) in my thesis. I certify that the above material describes work completed during my registration as a graduate student at the University of Windsor.
v
ABSTRACT
Supply chains (SCs) play a crucial role in business operations and economies around the
globe. They are in constant change and face challenges such as recurrent risks and disruption
risks. The disruptive risks tend to cascade and propagate upstream and downstream of the
disruption point. Due to the difficulty of calculating probabilities of disruptions, many
decision makers prefer to underestimate disruptive risks. Losses of billions of dollars are
accounted for each year due to the disruptive risks. These losses highlight the importance
and need of having decision support systems and tools that can aid to design, model and
analyze SCs that can cope with disruptions and their effects through all the stages.
This research aims at developing new methods for designing and analyzing SCs that are
prepared for unexpected events. It provides new insights into the methods to estimate the
impact of possible disruptions during designing and planning stages. It further proposes
complexity, robustness and resilience measures which facilitate the comparison between
different SC designs in different scenarios. The significance of this research is to provide more
stable production environments and develop the capability to prepare for unexpected events.
Particular focus is given to natural disasters due to the magnitude and variety of impacts they
could cause. Hence, a mathematical programming model that designs SCs and product
architectures is proposed. The objective function is to minimize the disaster risk score of
natural disasters (which depends on the geographical location of each SC entity and its
associated “World Risk Index”). Also, a goal programming model is derived from the initial
model. The goal programming model allows the inclusion of the decision‐makers’ risk
attitudes and costs to balance the decisions. The results obtained from the model showed that
the SC and product architecture designs affect each other. Additionally, it was demonstrated
vi To achieve harmonious designs between SCs and products while remaining robust and
controlling complexity, a novel methodology to assess structural SC complexity and
robustness is presented using network analysis. This methodology includes the evaluation of
different product architectures. Consequently, managers can choose the SC/product
architecture that has a balanced level of complexity and robustness. It is worth noting that
complexity and higher costs are needed to protect against disruptions. Moreover, the results
demonstrated that the modular architecture is preferable as it has a balanced level of
complexity and robustness.
To analyze the dynamic behaviour of the SCs, a system dynamics framework is introduced to
evaluate the impacts of disruptions in assembly SCs. Consequently, a pragmatic tool that
provides organizational support is proposed. This framework enables the examination of full
and partial disruptions and the incorporation of expediting orders after a disturbance. The
SC performance indicators are the output of the proposed model. These indicators make the
comparison between different scenarios easy. The usage of the framework and the findings
can serve to define disruption policies, and assist in the decisions relating to the SC design.
After running several scenarios, it was determined that the disruptions happening in the
downstream levels have more impacts on the SC performance than the disruptions in the
upstream levels. Hence, the disruption policies for the downstream levels should have higher
priority. Moreover, it was demonstrated that expediting after disruptions could affect more
the already damaged SC performance.
Finally, to evaluate the SC performance and costs when facing disruptions, an index to assess
SC resilience cost is provided. The metric considers the fulfilment rate in each period of each
SC entity and its associated cost. This index allows comparison between different scenarios
vii
DEDICATION
ToGod
Fortheprivilegeofgivingmethislife
TomyMomandDad
Fortheirinfiniteloveandsupportthroughmylife
TomyBrotherandmyNephews
Fortheirloveandendlessjoythattheyhavebroughttomylife
TomyLifePartner
viii
ACKNOWLEDGEMENT
Firstly, I would like to extend my sincere gratitude to my dissertation advisor, Professor Waguih ElMaraghy, for giving me the opportunity to collaborate with him, for his guidance, encouragement, time and effort throughout the course of this research. His endless support has benefited my research tremendously.
I would like to thank the committee members for their feedback and constructive comments leading to significant improvements in this dissertation. Special thanks to Professor Hoda ElMaraghy for her comments and suggestions during committee meetings as well as Intelligent Manufacturing Systems (IMS) Centre meetings. My sincere thanks also go to Professor Zbigniew J. Pasek for his guidance, suggestions and challenging questions. Many thanks to Professor Richard Caron for providing valuable feedback and recommendations.
I would also like to thank my current and former colleagues at the Intelligent Manufacturing Systems (IMS) Centre for their help and support; many thanks to Dr. Mohamed Abbas, Mr. Mostafa Moussa, Mr. Ashraf Abou Tabl, Mr. Sufian Aljerophani and Mr. Boris Novakovic.
My best and sincere thanks to Alejandro Vital Soto for all his support, help, guidance, patience, encouragement and love. To my parents, family and friends for being always there for me. None of this would be possible without you.
ix
TABLE OF CONTENTS
DECLARATION OF CO‐AUTHORSHIP / PREVIOUS PUBLICATION ... III
ABSTRACT ... V
DEDICATION ... VII
ACKNOWLEDGEMENT ... VIII
LIST OF FIGURES ... XIV
LIST OF TABLES ... XVII
LIST OF ABBREVIATIONS ... XX
CHAPTER 1. INTRODUCTION ... 1
1.1 Motivation ... 1
1.2 Supply Chain Network Design ... 2
1.3 Manufacturing Supply Chains... 3
1.4 Engineering Problem Statement ... 3
1.5 Research Scope ... 4
1.6 Research Gaps and Novelty ... 4
1.7 Research Plan ... 6
1.8 Thesis Hypothesis ... 6
CHAPTER 2. LITERATURE REVIEW ... 8
2.1 Overview ... 8
2.2 Definition of Key Terms ... 8
2.2.1. Supply chain networks ... 8
2.2.2. Risk, uncertainty and unexpected ... 8
2.2.3. Disruptive events ... 9
2.2.4. Classification of risk ... 9
2.2.5. Global Supply Chain for the Unexpected (GSCU) ... 10
x
2.2.7. Bullwhip and ripple effect ... 10
2.2.8. Product architecture ... 10
2.3 Concurrent Product and Supply Chain Design ... 11
2.3.1. Research gap ... 12
2.4 Structural Complexity and Robustness in SC ... 13
2.4.1. Research gap ... 15
2.5 Supply Chain Disruption Analysis using System Dynamics ... 16
2.5.1. Research gap ... 18
2.6 Supply Chain Resilience Measures ... 19
2.6.1. Research gap ... 21
CHAPTER 3. SIMULTANEOUS GLOBAL SUPPLY CHAIN AND PRODUCT ARCHITECTURE DESIGN ... 22
3.1 Overview ... 22
3.2 Introduction ... 22
3.3 Natural Disaster Risk Assessment ... 24
3.4 Simultaneous Design of Global Supply Chains and Product Architecture under Natural Disaster Risk ... 25
3.4.1. The model for the minimization of the total supply chain risk score (SCRS) ... 25
3.5 Case Study ... 29
3.5.1. Case study results ... 32
3.6 Risk‐Attitudes and Cost Considerations ... 34
3.7 Goal Programming Formulation ... 34
3.8 Case Study with Risk‐Attitudes and Cost Considerations ... 36
3.8.1. Goal programming results ... 38
3.9 Strategic Insights ... 41
xi CHAPTER 4. STRUCTURAL COMPLEXITY AND ROBUSTNESS OF SUPPLY CHAIN NETWORKS
BASED ON PRODUCT ARCHITECTURE ... 44
4.1 Overview ... 44
4.2 Introduction ... 44
4.3 Supply Chain Topological Complexity and Robustness Framework ... 46
4.4 Network Complexity Indicators ... 48
4.4.1. Supply chain size ... 49
4.4.2. Supply chain density ... 49
4.4.3. Supply chain cycles ... 50
4.4.4. Supply chain paths ... 50
4.4.5. Supply chain decision points ... 51
4.5 Network Robustness Indicators ... 51
4.5.1. Maximum direct diffusion after disruption ... 52
4.5.2. Maximum speed of disruption propagation ... 53
4.5.3. Maximum high‐risk intermediary ... 53
4.6 Overall Network Measures: Complexity and Robustness ... 54
4.7 Cost Analysis ... 55
4.8 Case Study ... 57
4.9 Results and Discussion ... 64
4.9.1. Structural Supply Chain Complexity (SSCC) ... 64
4.9.2. Structural Supply Chain Robustness (SSCR) ... 65
4.9.3. Cost analysis and trade‐offs analysis ... 67
4.9.4. Ideal supply chain structure ... 67
4.10 Summary ... 68
CHAPTER 5. SUPPLY CHAIN DISRUPTION ANALYSIS: A SYSTEM DYNAMICS APPROACH .... 70
5.1 Overview ... 70
xii
5.3 The Supply Chain System Dynamics Framework (SCSD) ... 72
5.3.1. The model ... 73
5.3.2. Mathematical formulations ... 75
5.3.2.1 Structure of demand and order fulfilment ... 77
5.3.2.2 Structure of backlogged orders ... 78
5.3.2.3 Structure of capacity disruption ... 79
5.3.2.4 Structure of expediting ... 81
5.3.2.5 Structure of order quantity ... 81
5.3.2.6 Structure of order quantity for the raw materials ... 82
5.3.2.7 Structure of transportation ... 84
5.3.2.8 Structure of cost, trade, pricing and profit ... 85
5.4 Model Validation ... 92
5.5 The Decision Support Package ... 97
5.6 Scenarios ... 98
5.7 Results ... 98
5.7.1. Effect of individual partial disruptions ... 99
5.7.2. Effect of individual partial disruptions with expediting ... 100
5.7.3. Effect of individual full disruptions ... 102
5.7.4. Effect of individual full disruptions with expediting ... 103
5.7.5. Effect of simultaneous full disruptions ... 104
5.7.6. Effect of non‐simultaneous full disruptions ... 105
5.7.7. Trade‐off analysis between cost and service level ... 106
5.8 Summary ... 107
CHAPTER 6. RESILIENCE MEASUREMENT ... 109
6.1 Overview ... 109
xiii
6.3 Supply Chain Resilience Index (SCRI) ... 111
6.4 Case Study ... 113
6.5 Results ... 114
6.6 Summary ... 116
CHAPTER 7. CONCLUSION ... 117
7.1 Overview ... 117
7.2 Summary ... 117
7.3 Limitations ... 119
7.4 Novelties and Contributions ... 120
7.5 Significance ... 121
7.6 Future Work ... 121
7.7 Conclusion ... 122
REFERENCES ... 125
APPENDIX A: COMPLEXITY AND ROBUSTNESS MEASURES ... 131
APPENDIX B: SYSTEM DYNAMIC FRAMEWORK SETUP ... 136
xiv
LIST OF FIGURES
Figure 1.1 Supply chain design framework (Chopra and Meindl 2007). ... 2
Figure 1.2 Research map. ... 6
Figure 2.1 Product Architectures. ... 11
Figure 3.1 IDEF0 of the mathematical model for the simultaneous design. ... 22
Figure 3.2 World Risk Index Map 2016 (Comes et al. 2016). ... 24
Figure 3.3 Potential supply chain structure. ... 29
Figure 3.4 Different configurations for a modular product architecture. ... 30
Figure 3.5 Product configuration for scenario 2. ... 31
Figure 3.6 Optimal product architecture and supply chain configuration. ... 32
Figure 3.7 Optimal configuration for scenario 1. ... 33
Figure 3.8 Product configuration and optimal SC for S2. ... 34
Figure 3.9 Product configuration and SC for scenarios S1‐A and S1‐B. ... 39
Figure 3.10 Product configuration and SC for scenario S1‐C. ... 40
Figure 4.1 SC Matrix and vectors representation. ... 48
Figure 4.2 Network Complexity Indicators. ... 51
Figure 4.3 Network Robustness Indicators. ... 54
Figure 4.4 SC topological complexity and robustness framework. ... 56
Figure 4.5 Integral and modular product architecture for bulldozer. Adapted from (Nepal, Monplaisir, and Famuyiwa 2012). ... 58
Figure 4.6 Modular‐customized product architecture for bulldozer. ... 58
Figure 4.7 SC configuration for integral (I1). ... 59
Figure 4.8 SC configuration for integral (I2). ... 59
xv
Figure 4.10 SC configuration for modular (M2). ... 61
Figure 4.11 SC configuration for modular (MC1). ... 62
Figure 4.12 SC configuration for modular (MC2). ... 63
Figure 4.13 Ideal characteristics for less complexity and more robustness in SC. ... 68
Figure 5.1 Top view of the SC model ... 75
Figure 5.2 Policy structure of the end‐echelons. ... 76
Figure 5.3 Policy structure of the middle‐echelons. ... 76
Figure 5.4 Structure of demand, order fulfilment and backlogged orders. ... 79
Figure 5.5 Structure of capacity disruption. ... 79
Figure 5.6 Structure of expediting and order quantity. ... 82
Figure 5.7 Structure of order quantity for the raw materials. ... 83
Figure 5.8 Structure of transportation. ... 85
Figure 5.9 Structure of cost, pricing and profit. ... 86
Figure 5.10 The stock and flow diagram of the distribution centre. ... 88
Figure 5.11 The stock and flow diagram of the assembly plant. ... 89
Figure 5.12 The stock and flow diagram of the supplier tier‐1. ... 90
Figure 5.13 The stock and flow diagram of the supplier tier‐2. ... 91
Figure 5.14 Base case, daily inventories for all SC echelons. ... 93
Figure 5.15 Scenario 1, daily inventories for each SC echelon. ... 93
Figure 5.16 Scenario 2, daily inventories for each SC echelon. ... 95
Figure 5.17 Scenario 3, daily inventories for each SC echelon. ... 95
Figure 5.18 Scenario 4, daily inventories for each SC echelon. ... 96
Figure 5.19 Scenario 5, daily inventories for each SC echelon. ... 96
xvi
Figure 5.21 Effect of individual partial disruptions on SC performance. ... 100
Figure 5.22 Effect of individual partial disruptions with expediting on SC performance. ... 101
Figure 5.23 Effect of individual full disruptions on SC performance. ... 102
Figure 5.24 Effect of individual full disruptions with expediting on SC performance. ... 104
Figure 5.25 Effect of non‐simultaneous full disruptions on SC performance. ... 105
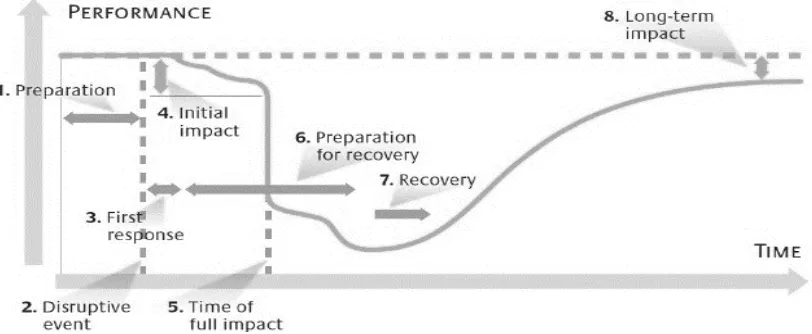
Figure 6.1 The disruption profile (Sheffi and Rice Jr 2005). ... 109
Figure 6.2 Resilience triangle (Tierney and Bruneau 2007). ... 110
Figure 6.3 Comparison of the resilience of two systems (Vugrin et al. 2010). ... 111
Figure 6.4 System impact (SI) and recovery effort (RE) areas. ... 112
Figure 6.5 Supply chain case study (adapted from (Carvalho et al. 2012)). ... 113
Figure 6.6 Results of company resilience indices for each scenario. ... 115
Figure 6.7 SCRI results for each scenario/approach. ... 115
Figure 7.1 Supply chain design and analysis methodologies. ... 117
Figure B.1 Effect of simultaneous full disruptions on SC performance. ... 142
xvii
LIST OF TABLES
Table 2.1 Research gap of risk consideration in the concurrent design. ... 13
Table 2.2 Research gap of product architecture in the complexity and robustness analysis.15 Table 2.3 Research gap in the system‐dynamic analysis for supply chain disruptions. ... 19
Table 2.4 Research gap in resilience measures. ... 21
Table 3.1 Notations and definitions for the model. ... 26
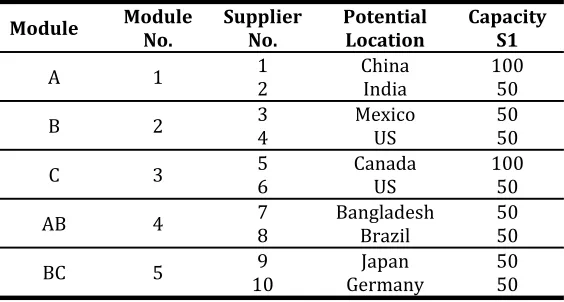
Table 3.2 Modules and supplier data for base case. ... 29
Table 3.3 Plants and DC data. ... 30
Table 3.4 Bill of materials of each product architecture in each plant for base case. ... 30
Table 3.5 WRI for each country from (Comes et al. 2016). ... 31
Table 3.6 Modules and supplier data for Scenario 1 (S1). ... 31
Table 3.7 Module and supplier data for S2. ... 32
Table 3.8 Bill of materials of each product architecture in each plant for S2. ... 32
Table 3.9 Results for base case scenario. ... 33
Table 3.10 Results for scenario 1. ... 33
Table 3.11 Results for scenario 2. ... 34
Table 3.12 Notations for the goal programming model. ... 35
Table 3.13 Scenarios and weights for the goal programming model. ... 37
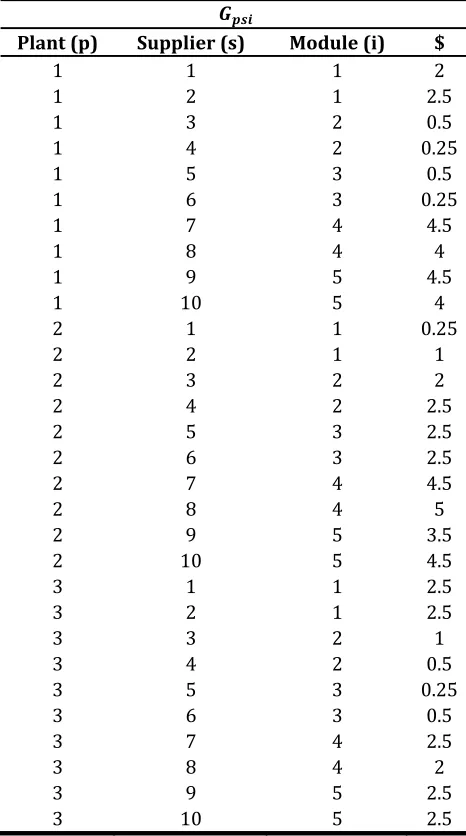
Table 3.14 Cost of producing and shipping from suppliers. ... 37
Table 3.15 Cost of shipping from distribution centres. ... 38
Table 3.16 Cost of producing and shipping from plants. ... 38
Table 3.17 Cost of opening facilities. ... 38
xviii
Table 3.19 Results of scenario 1 under different risk‐attitudes. ... 39
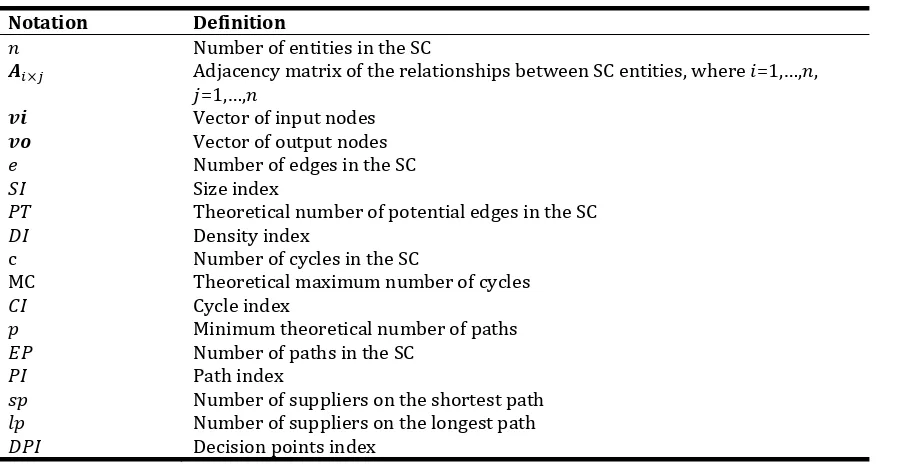
Table 4.1 Definition of notations. ... 46
Table 4.2 Edge table of I1W & I2W configurations. ... 60
Table 4.3 Edge table of M1W & M2W configurations. ... 61
Table 4.4 Edge table of MC1W configuration. ... 62
Table 4.5 Edge table of MC2W configuration. ... 63
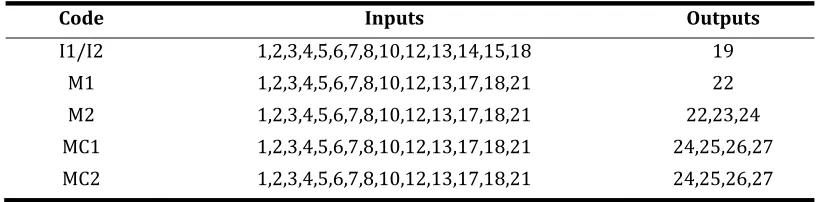
Table 4.6 Input and output nodes for each SC configuration. ... 64
Table 4.7 Comparison of complexity and robustness indices. ... 65
Table 4.8 Costs and trade‐offs analysis. ... 67
Table 5.1 Definition of notations. ... 73
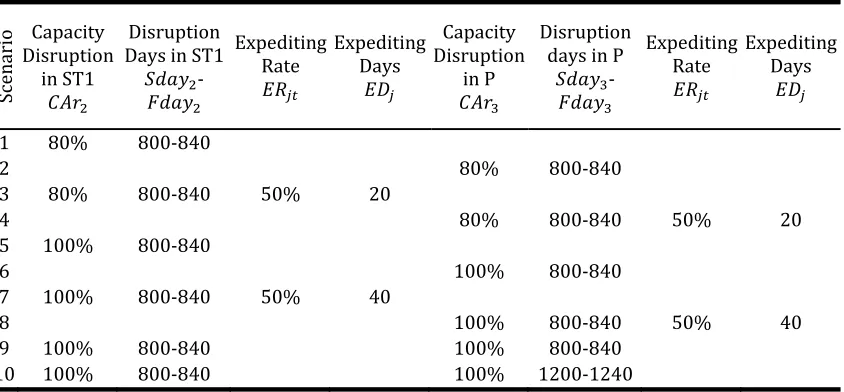
Table 5.2 Scenarios for model validation. ... 94
Table 5.3 Scenarios to analyze the impact of disruptions and expediting. ... 98
Table 5.4 Cost and service level analysis in partial disruptions. ... 106
Table 5.5 Cost and service level analysis in full disruptions. ... 106
Table 6.1 TSP, RE and SI Costs. ... 115
Table A.1 Entropy results and comparison of ranks. ... 133
Table A.2 Notations for the evaluation model of (Han and Shin (2016)) (Eq. A.2 to A.5). ... 134
Table A.3 Robustness results with different combinations of and . ... 134
Table A.4 Ranking comparison. ... 135
Table B.1 Parameter settings for base case scenario. ... 136
Table B.2 Model notations in AnyLogic. ... 137
Table B.3 Model notations in AnyLogic continued. ... 138
Table B.4 Effect of disruptions on SC performance (scenario 1 – scenario 4). ... 139
xix Table B.6 Effect of disruptions on SC performance (scenario 6 – scenario 10). ... 140
xx
LIST OF ABBREVIATIONS
CRI Company Resilience Index
FR Fulfilment Rate
IDEF0 Function modelling methodology which refers to “Icam DEFinition for Function Modeling" where ICAM is an acronym for "Integrated Computer Aided Manufacturing.”
ILP Integer Linear Programming
GP Goal Programming
GSCU Global Supply Chain for the Unexpected
RDR Recovery‐Dependent Resilience Cost
RE Recovery effort
SC Supply Chain
SCRS Total Supply Chain Risk Score Model
SCC Total Supply Chain Cost Model
SCSD Supply Chain System Dynamics Framework
SCRI Supply Chain Resilience Index
SD System Dynamics
SSCC Structural Supply Chain Complexity
SSCR Structural Supply Chain Robustness
SSCWR Structural Supply Chain Weighted Robustness
TSP Target System Performance
1
CHAPTER 1.
INTRODUCTION
1.1 Motivation
Customer requirements, global competition and new technologies have created a fast‐ changing supply chain environment. Hence, companies trying to maximize profits or minimize costs tend to choose strategies like outsourcing, offshoring and reducing the supply base (Nepal, Monplaisir, and Famuyiwa 2012). These globally distributed supply chains (SCs) face new challenges and uncertainties. Events in the SC can range from identified and certain, usually called “known‐known” situations, to unidentified and uncertain, usually called “unknown‐unknown” situations. These challenges and uncertainties are also reflected in the product design. Consequently, companies select product architectures that allow adaptation to fulfil the needs of different customer segments. As a result, companies are looking to increase robustness and resilience in the SC. However, they are trying ways to devise ways to diminish its complexity as well.
In the literature, many efforts have been devoted to examining SC risks, disruptions and mitigation strategies; just a few of these works, though, are based on quantitative methods. Traditional risk‐assessment methods are based on the identification of probabilities and the impact of the disruptions, e.g., (Knemeyer, Zinn, and Eroglu 2009). However, as pointed out by Simchi‐Levi et al. (2015), low‐probability and high‐impact events such as natural disasters are difficult to predict, and historical data is limited or nonexistent. Additionally, decision‐ makers tend to focus on operational costs and underestimate the impacts of the unexpected events.
Companies trying to reduce their risks look for insurance solutions that can help them to cope with unexpected situations. According to Munich Re (2017), in 2017, there were overall losses of 340 billion dollars due to relevant natural events worldwide. From these losses, 138 billion dollars were insured. Risks are becoming more complex and for that reason, companies buy insurance to provide financial relief (which is expensive and normally designed for non‐catastrophic or high‐frequency low‐impact events) or look ways to minimize possible event impacts.
2 (e.g. redundancies like inventories and backup suppliers) and the scale and speed of recovery strategies need to be considered (Sokolov et al. 2016). Hence, the SC structure, as well as dynamics, can be analyzed.
To address the challenges that the SCs face on a daily basis, innovative methodologies that can help to design, model and analyze SCs and the potential disruptions are needed. As a result, managers will be willing to invest in SC designs that support robustness and resilience although the benefits of those investments are not immediate.
This research is motivated by the need for methodological and pragmatic tools that will facilitate the decision‐making process of preparation, response and recovery from unexpected events. Even though the literature has attracted researches in the field of SC disruptions, there are still significant gaps in the literature. This research analyzes existing methods and builds on them to provide novel methodologies that can be useful to SC practitioners.
1.2 Supply Chain Network Design
Supply chain network design mainly deals with strategic decisions that are usually long‐term such as the number, location and capacities of the SC entities. According to Chopra and Meindl (2007), global network design decisions are carried out in four phases as shown in Figure 1.1.
3 In the framework presented by Chopra and Meindl (2007), in the first phase, a definition of the supply chain strategy is made. The SC strategy identifies the capabilities that the SC network must have to support the competitive strategy. In the second phase, regions which are going to be considered, their potential roles and approximate capacities are identified. As a result, a list of geographic regions that seem to be promising for consideration for the setup of the SC network is provided. In the third phase, desirable potential sites are selected within each region where facilities are to be located. In the last phase, a precise location and capacity allocation for each facility is decided.
Once the SC network design is fixed, planning is needed to set up policies that maximize the SC surplus that can be generated over the planning horizon given the constraints established during the strategic or design phase. Planning establishes parameters within which a SC will function over a specified period of time. In the planning phase or tactical decision level, companies must include uncertainty in demand, exchange rates and competition over this time horizon in their decision. As a result of the planning phase, companies define a set of operating policies that govern short‐term operations (Chopra and Meindl 2007).
1.3 Manufacturing Supply Chains
Manufacturing is concerned with the transformation of materials into items of greater value by processing or assembling. The discrete manufacturing industries produce parts and systems like automobiles, computers, machinery and the component parts from which these products are assembled (Groover 2007). The manufacturing supply chains consist of all the parties involved directly or indirectly in providing the products. These manufacturing SCs are complex infrastructures with various layers of intermediate suppliers that orchestrate the movement of parts and components between those layers. The manufacturing supply chains are usually comprised of geographically dispersed facilities and capabilities. Generally, each product line has its own supply chain, although the same facilities or capabilities are used in multiple product lines, hence multiple supply chains (National Research Council 2000).
1.4 Engineering Problem Statement
4 low‐impact situations could deteriorate supply chain performance, low‐frequency high‐ impact disruptions could damage the supply chain for an indefinite period. Hence, decision management tools to design and analyze supply chains that are prepared to overcome unexpected events are required.
1.5 Research Scope
Supply chains addressed in this dissertation are primarily discrete manufacturing SCs that are globally distributed. Service supply chains and e‐supply chains are not studied. The considered supply chains produce mainly assembly products (e.g., auto parts, electronics, appliances, etc.). The supply chain scope of application includes new and existing SC networks. The design level of the dissertation is mainly strategic and tactical. In the strategic design, the setup of SC entities within the supply chain network is limited to regional facility locations (specifically countries). In the strategic level of decision, risk–attitudes of the decision makers are considered to design the supply chain configuration and product architecture. Moreover, product architecture design is considered, but not their product variants. Additionally, natural disasters are analyzed in more detail due to the magnitude of the consequences that they could cause. Through this research, the supply chain configuration is structurally designed. The different suppliers, locations and quantities produced and shipped are determined. Moreover, structural SC complexity and robustness are analyzed.
The dynamic analysis is considered at the tactical level. Analysis of the SC performance when facing a generic shock is represented as a time delay. Operational risks as demand, forecast, lead‐time or trade risks are not discussed in this research. Moreover, the representation of an assembly process in the system dynamics model is integrated. However, the implications of this process are not analyzed.
1.6 Research Gaps and Novelty
This subsection briefly highlights the research gaps in the literature depending on the application developed and explains the novelty in each section.
5 literature focusing on this topic, e.g. (Nepal, Monplaisir, and Famuyiwa 2012; Rezapour, Hassani, and Farahani 2015; Gan and Grunow 2016; Baud‐Lavigne, Agard, and Penz 2016). However, most of these works disregard the risk that the supply chains face when operating in a global context.
In this research, an integer linear mathematical programming model is proposed to design the supply chain and the product architecture simultaneously. The novelty of this model is the inclusion of the exposure and vulnerability towards natural disasters. Additionally, risk‐ attitudes of the decision makers are considered.
In the second section of this dissertation, a method to evaluate structural supply chain complexity and robustness is presented. This section intends to identify patterns that could increase complexity and robustness. While several works have been trying to address simultaneously or independently complexity and robustness, these topics have been studied episodically (Ivanov and Sokolov 2013; Bode and Wagner 2015; Sokolov et al. 2016; Monostori 2016). Furthermore, the inclusion of the product architecture in the analysis is mainly disregarded.
In this research, a framework to analyze the structural complexity and robustness of supply chain networks based on product architecture is proposed. The framework facilitates comparison between different supply chain configurations and product architectures.
In the third section of this research, a decision support system based on system dynamics is described to evaluate the impacts of possible disruptions. System dynamics have been widely used to address complex problems. In supply chain, several authors have been using this methodology to evaluate policies and strategic decisions (Mehrjoo and Pasek 2015; Wu, Blackhurst, and O’grady 2007). Moreover, system dynamics has been used to evaluate specific disruptions in a planning period (Wilson 2007; Huang et al. 2012; Bueno‐Solano and Cedillo‐Campos 2014).
In this research, disruptions are allowed to happen in different supply chain echelons, with different disruption durations, with full and partial disruptions and with the option of production expediting. The proposed pragmatic tool is intended to be used by managers to plan disruption policies and support decision making.
6 proposed in the literature, e.g. (Barroso, Machado, Carvalho, and Cruz Machado 2015; Spiegler, Naim, and Wikner 2012; Soni, Jain, and Kumar 2014), the available measures only evaluate enablers, performance or cost. In this research, the proposed metric considers the supply chain performance (fulfilment rate) and the associated cost to accomplish that performance in a single metric. The provided supply chain resilience index allows the comparison of different scenarios of different supply chains. For more detailed literature survey, refer to chapter 2.
1.7 Research Plan
This research is presented in seven chapters, in four of the seven chapters different decision tools are introduced. A research map is outlined in Figure 1.2. All the models proposed in this dissertation are intended to be used independently. However, they could be used together as an integral tool.
Figure1.2Researchmap.
1.8 Thesis Hypothesis
“Concurrentlyintegratingtheproductarchitecturewiththesupplychaindesignand
includingconjointanalysesofstructuralanddynamiccharacteristicscouldresultin
robustsupplychainsthatarepreparedfortheunexpected”
8
CHAPTER 2.
LITERATURE REVIEW
2.1 Overview
This chapter provides an overview of previous research relevant to the theme of this dissertation: supply chain design for the unexpected. Emphasis is particular given to four subsections. The first relates to the simultaneous design of supply chains and product architectures. The second relates to the structural complexity and robustness of supply chains. The third section refers to the quantification of supply chain disruptions using system dynamics. Finally, the fourth section reviews the literature regarding resilience measures in supply chain. These reviews also identify gaps in the literature that lead to the formulation of this research. Moreover, this chapter defines terms that will be employed in this dissertation.
2.2 Definition of Key Terms
The goal of this section is to provide a quick overview of the terms and definitions that are used in this dissertation.
2.2.1.
Supply
chain
networks
Supply chains or supply chain networks are organized firms that their main purpose is to satisfy the customer requirements. They involve all the parties that participate directly or indirectly, from raw material suppliers, producers, distribution centres, retailers, transporters and customers (Chopra and Meindl 2007).
2.2.2.
Risk,
uncertainty
and
unexpected
Risk: It is defined as the fear of loss or devaluation of an important asset (Heckmann, Comes,
9 purpose, supply chain risk is considered as defined by Heckmann, Comes, and Nickel (2015): “Supply chain risk is the potential loss for supply chain in terms of its target values of efficiency and effectiveness evoked by uncertain developments of supply chain characteristics whose changes were caused by the occurrence of triggering‐events”.
Uncertainty: Refers to a situation which involves imperfect or unknown information. The
probability of its occurrence is not known, and the results of this situation are unknown. This type of situation in the supply chain can emerge from the global environment.
Unexpected: Refers to the possibility of any triggering event or the miss of any event that
could cause any variance in the targeted value of the supply chain. The unexpected is the whole view of uncertainties and risks not depending on their level of impact. Because even when the probabilities of occurrence are available, external factors can change the path of an expected outcome.
2.2.3.
Disruptive
events
In the literature, different terms are used synonymously to refer to triggering events. For instance, disturbances, disruptions, disasters, hazards and crisis (Heckmann, Comes, and Nickel 2015). However, some of these synonyms can be classified according to their impacts and if they are controllable. In this research, these terms are used to describe situations that destabilize the usual performance in the supply chain.
2.2.4.
Classification
of
risk
10 risk, inventory risk and capacity risk. In this research, the focus is on low‐frequency high‐ impact events such as natural disasters.
2.2.5.
Global
Supply
Chain
for
the
Unexpected
(GSCU)
Refers to a holistic concept where the domain of Global Supply Chain considers unexpected situations. As a result, GSCU includes all the problems related to the SC and the activities developed to achieve competitive advantages in different environments even in those where information is not available. The primary goal of this domain is to achieve a strategic fit between customer priorities and capabilities in any supply chain environment. GSCU considers the structural and dynamic perspectives of SCs.
2.2.6.
Risk
attitudes
Risk appetite or attitude reflects the degree that the decision maker is willing to accept in pursuing its objectives (Schlegel and Trent 2016). Risk can be classified according to the utility theory depending on the risk attitude of the decision maker as risk‐averse, risk‐seeking and risk‐neutral. These perspectives may influence decision makers and lead to different solutions (Heckmann, Comes, and Nickel 2015).
2.2.7.
Bullwhip
and
ripple
effect
Bullwhip effect is related to operational risks, for instance, demand fluctuation where there is a magnification of variability in orders in the SC. The bullwhip effect impacts critical parameters and performance of the SC. The recovery of this effect is usually in the short term. On the other hand, the ripple effect is the propagation of disruptions in the SC, and it is related to disruptive risks, for example, natural disasters. In the ripple effect, structure, critical parameters and output performance are affected in the middle to long‐term (Ivanov, Dolgui, and Sokolov 2015).
2.2.8.
Product
architecture
11 classified into integral and modular, as per Figure 2.1. Integral architecture is the scheme by which functional elements are shared by physical elements. In contrast, in a modular architecture, each function is delivered by a separate element. Additionally, there is the platform design approach that is considered as an extension of the modular design (Gu 2014).
Figure2.1ProductArchitectures.
2.3 Concurrent Product and Supply Chain Design
12 module substitution possibilities. Likewise, the paper developed by Chiu and Okudan (2014) studied the impact of different modularity levels, they used minimization of total cost and minimization of lead time as the objective functions.
Case studies that analyze risks and the potentials of the concurrent design to mitigate different risks have been barely studied in the literature. For instance, Khan, Christopher, and Creazza (2012) investigated how product commonality is related to supply chain integration and the risk of technological knowledge leakage. Lau et al. (2010) highlighted the importance of information sharing but also the potential information risk across the supply chain. Hoetker, Swaminathan, and Mitchell (2007) analyzed the benefits of the concurrent design in the presence of supplier failure risk. These case studies showed the need to consider risk at the strategic level of decisions. However, none of them proposed a methodology that includes risk.
Several works have been dealing with the concurrent design of a product and its corresponding SC. In the existing research, common objectives are the minimization of total costs (ElMaraghy and Mahmoudi (2009), Ivanov and Sokolov (2013), Nepal, Monplaisir, and Famuyiwa (2012), Baud‐Lavigne, Agard, and Penz (2016), Chiu and Okudan (2014)), maximization of profits (Rezapour, Hassani, and Farahani (2015), Gokhan, Needy, and Norman (2010)), and other aspects.
2.3.1.
Research
gap
13 Table2.1Researchgapofriskconsiderationintheconcurrentdesign.
ObjectiveFunction Ri sk cons id er at ion No risk consideration Author Minimize cost Maximize pr ofit Qua lity/ Pric e Minimize lea d time
Fine, Golany, and Naseraldin (2005) X X X
ElMaraghy and Mahmoudi (2009) X X
Nepal, Monplaisir, and Famuyiwa (2012) X X
Rezapour, Hassani, and Farahani (2015) X X X
Baud‐Lavigne, Agard, and Penz (2016) X X
Chiu and Okudan (2014) X X X
Gokhan, Needy, and Norman (2010) X X
2.4 Structural Complexity and Robustness in SC
In the literature, mainly two approaches have been used to analyze complexity. The first uses information as a measure of uncertainty. Based on this concept, an entropy measure was developed by Shannon (2001). This measure has been widely used in different areas to assess complexity. The second approach uses the information content, and it is based on axiom 2 of the axiomatic design theory, as presented by Suh (1999). Additionally, there are analyses based on empirical methods, heuristics and statistics.
Several authors have analyzed structural SC complexity. For example, Wang et al. (2010) presented a complexity measure for assembly SCs based on Shannon’s entropy. They considered the SC structure, product variety level and mix ratios. Allesina et al. (2010) assessed network organization and network complexity using eight ecological entropic indices. Similarly, Arkhipov and Ivanov (2011) proposed a complexity measure based on entropy. Moreover, Isik (2011) used entropy to evaluate structural complexity and operational complexity. Cheng, Chen, and Chen (2014) examined structural complexity considering the degree of order and diversity. Modrak and Bednar (2016) used structural and axiomatic design based measures as well as graphical and numerical correlations.
14 2014), several papers have used metrics based on network theory. This approach offers potentials to identify patterns and draw inferences from the entities relationships in the process.
A design is robust if the network is able of providing steady value creation under different scenarios for a specific period (Klibi, Martel, and Guitouni 2010). Several authors have used graph theory to reveal the relationship between robustness and network properties. For example, Basole and Bellamy (2014) and Kim, Chen, and Linderman (2015) analyzed the supply chain network, the impact of disruptions and resilience. They demonstrated a relevant association between network structure and the likelihood of a disruption and risk diffusion. Hearnshaw and Wilson (2013) underlined network properties of efficient SCs. Nair and Vidal (2011) examined how robustness is affected by network topology. Likewise, Zhao et al. (2011) analyzed random and targeted disruptions of supply networks. They studied how supply topologies that come from different growth models affect supply resilience. Brintrup, Ledwoch, and Barros (2016) developed a structural analysis of the network topology and a simulation analysis in disrupted scenarios to get statistical properties. Similarly, Han and Shin (2016) proposed a robustness evaluation method considering disruption propagation. Adenso‐Díaz, Mar‐Ortiz, and Lozano (2017) analyzed how different design factors affect robustness in targeted and random disruptions.
To mitigate the impacts of a supply chain disruption, Kamalahmadi and Mellat‐Parast (2016) developed a two‐stage mixed integer programming model for a flexible sourcing strategy under supply and environmental risk. Lin, Huang, and Yeh (2014) proposed a minimal paths algorithm to evaluate network reliability. Lin et al. (2017) evaluated system reliability and the probability that a multistage SC can fulfil the demand. Ivanov, Pavlov, and Sokolov (2016) used the genome method to analyze the reliability of SC structures and identify critical suppliers. Ojha et al. (2018) developed a holistic measurement based on Bayesian networks for predicting risk propagation.
15 performance indicators included connectivity coefficient as a robustness measure, and complexity as an efficiency measure and others measures. Monostori (2016) evaluated robustness with two measures, betweenness centrality and factor R.Additionally, complexity was estimated with the vertex degree and the network entropy.
2.4.1.
Research
gap
Interest about structural complexity and robustness in SC have increased during the last years. However, most of these studies are carried out separately. There is a lack of literature regarding how structural SC complexity and robustness are affected by the product architecture, as shown in Table 2.2. The need of a practical analysis tool to estimate robustness and complexity has been pointed out by several researchers (Ivanov, Dolgui, et al. (2017); Dolgui, Ivanov, and Sokolov (2018)). Hence, there is the need to develop a methodology that jointly assesses structural SC complexity and robustness and at the same time considers the product architecture.
Table2.2Researchgapofproductarchitectureinthecomplexityandrobustnessanalysis.
Author Com p lex it y Rob u st ne ss Prod uct archi tecture
Wang et al. (2010) X
Allesina et al. (2010) X
Arkhipov and Ivanov (2011) X
Isik (2011) X
Cheng, Chen, and Chen (2014) X
Modrak and Bednar (2016) X
Basole and Bellamy (2014) X
Kim, Chen, and Linderman (2015) X
Nair and Vidal (2011) X
Zhao et al. (2011) X
Han and Shin (2016) X
Ivanov and Sokolov (2013) X X
Bode and Wagner (2015) X X
Sokolov et al. (2016) X X
16
2.5 Supply Chain Disruption Analysis using System Dynamics
Supply chains are dynamic and complex systems because of the number of entities involved and the interactions between them. While mathematical models are not able to accommodate the dynamics of the supply chain, simulation has been used to support supply chain decisions.
A typical method to analyze dynamic systems from the viewpoint of the whole systems is System Dynamics (SD). SD methodology is a modelling method presented by Jay Forrester in 1950. This modelling allows complex system analysis to design more effective policies and organizations (Sterman 2000). SD is based on the system thinking, where decisions are not affected in a linear manner. Contrary, a circular effect will occur. SD uses feedback loops, called causal loops as the heart of the methodology. These causal loops identify and display processes and the interaction between them. So, the behaviour of the whole system is recognized. It is important to mention that this kind of methodology is ideal at the strategic level of decisions. It is not suitable for optimization or to get a match point‐by‐point to the actual system. The relationships between variables define the system structure.
Several works have used SD to design policies and analyze SC behaviour when it faces different uncertainties and the bullwhip effect. For instance, Özbayrak, Papadopoulou, and Akgun (2007) investigated the supply chain performance under different scenarios, i.e., demand uncertainty, unreliable suppliers, different lead times and information sharing. They pointed out that the supply chain that manages enriched information observes reductions in inventory levels through all the echelons. Cheng, Chiou, and Tai (2008) analyzed the effect of disruptions in a three‐echelon TFT‐LCD industry and determined that this industry is sensitive to capacity planning and they pointed out the need of sharing information instantly, completely and correctly to diminish the risk of over‐production. Campuzano, Mula, and Peidro (2010) used fuzzy estimations of demand in a two‐stage system dynamic simulation model, showing the bullwhip effect and the amplification of the inventory variance.
17 with specified probabilities was presented by Ghadge et al. (2013). That research provided the predicted impact regarding cost and time according to specified input conditions. Mehrjoo and Pasek (2015) presented a framework to analyze managerial policies for perishable products in a three‐echelon SC under three different kind of risks: risk of delays, forecast and inventory. Additionally, they used the Conditional Value at Risk (CVaR) to measure the risk of the supply chain. As a conclusion, they stated that the supply chain risk is more sensitive to scenarios where the lead time of all SC stages changes at the same time.
Another work, dedicated mainly to the bullwhip effect analysis was the one presented by Langroodi and Amiri (2016). This work analyzed oscillation in demand, variation in price, changes in costs and the simultaneous occurrence of them in a five‐echelon supply chain. Their primary objective was the minimization of cost to choose the policy. They stated that this could lead to having a considerable lead time.
Other research publications focus specifically on disruptions. For instance, Wilson (2007) evaluated the impact of transportation disruption between two‐echelon in a five‐echelon supply chain. This study demonstrated that the disruptions that are closer to the consumer have a more significant impact on the supply chain performance. A two‐echelon supply chain is used to analyze the use of backup suppliers when facing a disruption (Huang et al. 2012). They observed the inventory amplification after disruption, and they concluded that the longer the supply disruption is, the heavier the inventory fluctuation is. Bueno‐Solano and Cedillo‐Campos (2014) used system dynamics to study the effects of terrorist acts on the performance of a global supply chain. They highlighted the increase in inventory as a result of increased security measures on international borders. Ivanov, Pavlov, et al. (2017) presented a hybrid linear programming – system dynamics model for reconfiguration plans in a closed loop supply chain that is affected by gradual deterioration and variable recovery cost and time. They showed that the consideration of gradual capacity recovery leads to a minimization of return flows.
18 concluded that information sharing helps to improve supply chain resilience regarding backlog and duration.
Some studies have used other simulation paradigms to analyze supply chain disruptions. For instance, Schmitt et al. (2017) examined and considered disruptions in multi‐echelon SCs using agent‐based modelling. This analysis was focused on the first echelon and last echelon in the SC, and the impact of strategies like expediting and adaptive ordering. On the one hand, they concluded that expediting could hurt the already damaged system. This phenomenon occurs due to the increment in the inventory because of variation in order quantity and frequency of the orders. On the other hand, they advised that adapting ordering with order‐ up‐to policies are a promising mitigation tool. Discrete‐event simulation has also been used in several works in the supply chain disruption context. For example, Carvalho et al. (2012) presented a simulation study for a three‐echelon assembly SC that considered a disturbance that affects transportation of material between two SC entities. They used flexibility and redundancy as mitigation strategies and observed the disruption impact on lead time ratio and total cost.
2.5.1.
Research
gap
19 Table2.3Researchgapinthesystem‐dynamicanalysisforsupplychaindisruptions.
Author Full disru p ti on Pa rtia l disru p tio n Expe dit in g Assembly ec helon Simulatio n parad igm Disruptiontype
Özbayrak, Papadopoulou, and Akgun
(2007) SD Demand, supply & lead time
Cheng, Chiou, and Tai (2008) SD Demand
Campuzano, Mula, and Peidro (2010) SD Demand
Spiegler, Naim, and Wikner (2012) X SD Generic disruption
Ghadge et al. (2013) X SD Generic disruption
Mehrjoo and Pasek (2015) SD Lead time, forecast & inventory
Langroodi and Amiri (2016) SD Demand, price & cost
Wilson (2007) X SD Transportation
Huang et al. (2012) X SD Generic disruption
Bueno‐Solano and Cedillo‐Campos (2014) X SD Border disruption
Ivanov, Pavlov, et al. (2017) X X SD Capacity disruption
Schmitt et al. (2017) X X X AB Generic disruption
Carvalho et al. (2012) X X DE Transportation
2.6 Supply Chain Resilience Measures
Resilience is a concept that has been used in ecology, sociology, psychology and economy to denote the ability to absorb changes. In SC, it was defined by Ponomarov and Holcomb (2009) as the adaptive capability of the SC to be prepared for unexpected events, to respond and to recover to its original state. Similarly, Pettit, Fiksel, and Croxton (2010) defined supply chain resilience. They not just considered the ability to survive, but they also considered the ability to grow in the face of turbulent change. Tierney and Bruneau (2007) presented the resilience triangle for critical infrastructure systems. It represents the loss of functionality from damage and disruption, as well as the restoration and recovery pattern over time.
20 Some approaches to quantify the resilience in the supply chain are available in the SC literature. Soni, Jain, and Kumar (2014) proposed a supply chain resilience index that is modelled using graph theory. They considered resilience enablers (agility, collaboration, information sharing, etc.) and their interrelationships. In that approach, the included enablers are subjective to the survey respondent firms. Another method to assess the resilience and the ‘greenness’ in the supply chain was presented by Azevedo et al. (2013). They proposed an index that evaluates the company green behaviour and the company resilient behaviour (sourcing strategies, strategic stock, flexible transportation, etc.).
Supply chain performance measures have been used as a proxy to evaluate resilience in SC. For instance, Carvalho et al. (2011) used the fulfilment rate. Barroso, Machado, and Machado (2011) and Carvalho et al. (2012) used a lead‐time ratio and SC total cost. Cardoso et al. (2015) proposed eleven indicators to assess supply chain resilience. Four of them about network design indicators, four related to network centralization and three related to operational indicators (net present value, customer service level and investment).
A resilience metric that captures individual metrics of recovery, impact, profile length and the time‐dependent deviation‐weighted sum was proposed by Munoz and Dunbar (2015). They presented a linear weighted‐sum aggregate index. Additionally, they used structural equation modelling to calculate the weights for each metric. In that research, they left aside the performance loss because it is highly correlated with the other metrics.
Spiegler, Naim, and Wikner (2012) considered as a SC resilience measure the integral of time multiplied by the absolute error (ITAE). The latter measure is commonly used in control engineering and corresponds to the best response and recovery with the lowest deviation from the target (readiness).
21 Additionally, Vugrin et al. (2010) proposed the resilience costs for infrastructure and economic systems. They defined the resilience costs as a function of the sum of the system impact (SI) plus the total recovery effort (TRE) multiplied by a weighting factor, α, to assign relative significance. It is relevant to mention that system performance during the disruption in the SC will depend on the recovery strategy chosen. If a mitigation strategy is available, the system impact will be smaller. Conversely, if there is a reactive strategy, the system impact will be more significant.
2.6.1.
Research
gap
Uncertainties in SC will always exist. Hence, we have to learn to handle this kind of situations. However, we need to balance the desired performance and the cost to achieve this resilient supply chain within specified limits. The available approaches for measuring resilience in SC are directly evaluating the SC performance and its enablers. However, some of these approaches are not considering the economic system impact and the economic recovery effort (SC resilience cost), as shown in Table 2.4. For that reason, in this research, a supply chain resilience index is presented to evaluate the SC resilience cost.
Table2.4Researchgapinresiliencemeasures.
Author Quali tative mea sur e Quantitat ive me asu re SC per for m ance SC re si lie n ce cost Measure
Soni, Jain, and Kumar (2014) X Agility, collaboration, information sharing, etc.
Azevedo et al. (2013) X Resilient behaviour
Carvalho et al. (2011) X X Fulfilment rate
Barroso, Machado, and Machado (2011) X X Lead time and SC total cost
Carvalho et al. (2012) X X Lead time and SC total cost
Cardoso et al. (2015) X X NPV, customer service level and investment
22
CHAPTER 3.
SIMULTANEOUS GLOBAL SUPPLY CHAIN AND
PRODUCT ARCHITECTURE DESIGN
3.1 Overview
In this section, an integer linear programming model is presented to simultaneously design the supply chain and product architecture. Figure 3.1 provides an overview of the mathematical model. The main expected outputs are the SC structure and the product architecture and the quantities produced and shipped from each SC entity as shown in Figure 3.1. The distinctive characteristic of our model is the inclusion of natural hazard exposure and vulnerability depending on geographical facility location. Additionally, the decision maker’s risk‐attitudes are considered as presented in the model of section 3.7.
Figure3.1IDEF0ofthemathematicalmodelforthesimultaneousdesign.
3.2 Introduction
23 Product and supply chain designs have been under study for decades. Both designs usually have been carried out as a sequential process. However, to achieve harmonious designs, matching both processes is needed.
During the last years, the concurrent design of product architecture and supply chain networks has started to attract attention. Several mathematical models have been presented. However, there is a scarcity of models that consider the geographical location of the supply chain and their risk of natural disasters. Zones that have increased exposure and vulnerability towards natural disasters will be prone to more significant impact. Additionally, if the location zone of the disrupted supplier does not have recovery capabilities, the effects of those disruptions can be worsened.
In this paper, natural disasters are considered because they can cause facility disruption, transportation disruption, supply disruption and maybe information system disruption. These situations justify the necessity of including the natural disaster risk of the geographical location of the SC facilities at the strategic decision level. The incorporation of a risk factor when designing the supply chain should be done without overlooking the product configuration. Since the product architecture selected will affect the number of suppliers and production centres.
Low‐probability and high‐impact events such as natural disasters are difficult to predict (Simchi‐Levi et al. 2015), hence analytics to enable decisions should be carried out with the available information. For instance, humanitarian supply chains can operate in disrupted areas. They use available information to be aware of the exposure and vulnerability of specific regions or countries. Starting with this idea, we believe that SCs can be designed using information about exposure and vulnerability towards natural disasters to decrease their risk.
In this paper, a mathematical model for decision making is developed to design the supply chain and product configurations concurrently. We achieve this by reformulating the integer linear programming model (ILP) proposed by ElMaraghy and Mahmoudi (2009) to include geographical location information of each facility and its corresponding risk.
24 considering natural hazards risk. Section 3.5 contemplates a case study; it discusses the results and the managerial implications of the results. Section 3.6 describes decision‐maker risk attitudes and the conflict of costs. Section 3.7 presents a goal programming model that considers risk attitudes and cost. Section 3.8 analyzes a case study and shows the results. Section 3.9 presents managerial insights. Finally, section 3.10 summarizes this chapter and proposes future research avenues.
3.3 Natural Disaster Risk Assessment
There have been a few attempts to assess risk and vulnerability towards natural hazards on a global scale. One of them was the Disaster Risk Index (DRI). The DRI was developed by the United Nations Development Program (Peduzzi et al. 2009). It was created focusing on disaster mortality. As a result, the classification of countries was provided. A second attempt to assess natural hazard risk was the Natural Disaster Hotspots (Dilley 2005) that was developed by the World Bank. It was focused on disaster mortality and economic losses. Another attempt to assess risk and vulnerability on a global scale was the World Risk Index (WRI) (Welle and Birkmann 2015). The WRI considered exposure and vulnerability of societies towards natural hazards (cyclones, droughts, earthquakes, floods and sea‐level rise). The WRI was developed as collaborative research between members of the University of Stuttgart for the Bündnis Entwicklung Hilft (The Alliance Development Works) and with the collaboration of the Institute for Environment and Human Security of the United Nations University (UNU‐EHS). This index calculated the risk for 171 countries considering exposure, vulnerability, coping capacities and adapting capacities. It ranks the countries according to the disaster risk as per Figure 3.2. The WRI has been used in politics, science and civil society to draw attention to the importance of disaster preparedness (Welle and Birkmann 2015).
25 The WRI highlights the risk of becoming a victim of a disaster. Each country is rated according to the disaster risk. The disaster risk refers to a combination of potential prone countries and the social, economic and ecological conditions within the respective countries. The WRI calculates the disaster risk by multiplying vulnerability with exposure to natural hazards (Welle and Birkmann 2015).
3.4 Simultaneous Design of Global Supply Chains and Product
Architecture under Natural Disaster Risk
As mentioned by Simchi‐Levi, Schmidt, and Wei (2014), it is almost impossible to determine the probability of black‐swan events. However, we can examine the exposure and vulnerability of specific regions that will potentiate the impact of this kind of events.
In this research, the information provided by the WRI is used to design the supply chain and product architectures simultaneously. The use of the WRI is intended to plan for disasters and to minimize their impacts. It is important to mention that the usage of the WRI is not designed to avoid the establishment of facilities in riskier countries. It is intended to make adequate preparation and consider in advance possible mitigation strategies.
The WRI is considered to design the supply chain and the product architecture. The reason we included the WRI is that in the presence of a natural disaster, not just the factories will not be available to produce. Also, facilities and infrastructures will be most probably affected. As a result, people in the affected areas will not be able to attend to work, roads will be closed, and perhaps IT systems and electricity will not be available.
3.4.1.
The
model
for
the
minimization
of
the
total
supply
chain
risk
score
(SCRS)
26 characteristics of qualitative criteria (Infrastructure and natural disaster risks), specifically the World Risk Index. The WRI is used to weight the location of a facility in each country in the supply chain.
An ILP model is presented to be used as a tool for decision making at the strategic level. All the notations used in this model are compiled in Table 3.1. The assumptions considered are the following:
The network consists of a four supply chain echelons (supplier, manufacturer, distributor centre and customer).
The model is considered as a single period because at the strategic level managers are targeted to cover a particular market share, they are not interested in tactical design as the level of inventory.
All the model parameters can be estimated.
Multiple products are considered. Possible product architectures are predetermined in advance.
Potential location of suppliers, assemblers, plants and distribution centres are predetermined depending on production capabilities.
Products move to the next echelon as soon as they are produced. Lead times and transportation time are not considered.
Costs are not considered.
Demand for all customers is always fulfilled.
The World risk index is available for the considered country.
Table3.1Notationsanddefinitionsforthemodel.
Notation Definition Indices
Modules 1, … ,
Products 1, … ,
Potential suppliers upstream 1, … ,
Potential plants 1, … ,
Potential distribution centres 1, … ,
Customers 1, … ,
Potential product configurations 1, … ,
Parameters
Number of modules Number of products
Number of potential suppliers