ABSTRACT
DANBY, SEAN JAMES DENNISON. Experimental Quantification of Transient Stretch Effects from Vortices Interacting with Premixed Flames. (Under the direction of Dr William Roberts.)
The understanding of complex premixed combustion reactions is paramount to the development of new concepts and devices used to increase the overall usefulness and capabilities of current technology. The complex interactions which occur within any modern practical combustion device were studied by isolating a single turbulent scale of the turbulence-chemistry interaction. Methane-air flame equivalence ratios (φ = 0.64, 0.90, and 1.13) were chosen to observe the mild affects of thermo-diffusive stability on the methane-air flame. Nitrogen was used as a diluent to retard the flame speeds of the φ = 0.90, and 1.13 mixtures so that the undisturbed outwardly propagating spherical flame kernel propagation rates, drf/dt, were approximately equal. Five primary propane
equivalence ratios were utilized for investigation: φ = 0.69, 0.87, 1.08, 1.32, and 1.49. The choice of equivalence ratio was strategically made so that the φ = 0.69/1.49 and φ = 0.87/1.32 mixtures have the same undiluted flame propagation rate, drf/dt. Therefore, in
Accompanying high-speed chemiluminescence imaging measurements, instantaneous pressure measurements were obtained to give a more detailed
understanding of the effect of vortex strength on the overall flame speed and heat release rate over an extended time scale and to explore the use of a simple measurement to describe turbulent mixing. Further local flame- vortex interface analysis was conducted using non-invasive laser diagnostics, such as particle image velocimetry and planer laser induced fluorescence of the OH radical. The dependence of heat release rate on
temperature provides an estimation of the strain rate dependence of the reaction rate. Findings include a direct effect of stretch rate on temperature along the flame
Experimental Quantification of Transient Stretch Effects from Vortices Interacting with Premixed Flames
by
Sean James Danby
A dissertation submitted to the Graduate Faculty of North Carolina State University
in partial fulfillment of the requirements for the Degree of
Doctor of Philosophy
Aerospace Engineering
Raleigh, North Carolina
2008
APPROVED BY:
________________________ ________________________
William Roberts Tarek Echekki
Chair of Advisory Committee
________________________ ________________________
Dedication
Dedicated to my parents, whose unwavering support throughout the years has provided me
Biography
Born in Lakenheath, England in 1978, Sean was the son of an Air Force pilot and at the
age of only three months, took his first trip in an airplane; specifically a C-130 military
transport, to Ramstein AFB in Germany. After two years in Germany, Sean was brought to
where he considers home; Alamogordo, New Mexico. As he matured, he developed an
interest in aircraft, evident by the large number of plastic models hanging from the ceiling in
his room. Also as a young child, Sean was fascinated by fire and thanks to an ingenious
remedy by his parents where he was allowed to conduct a supervised pyromaniac release,
had his fire-loving tendencies subdued before significant damage could be done to people or
property.
Throughout high school, Sean developed an interest in science and math. His biology
teacher, Kevin Blackstone presented a fascinating microcosm, where concentration gradients
and surface tension rule. Sean enjoyed this topic so much, he decided to pursue it further in
college, however the allure of machines had not been satisfied and within one month of
attending his undergraduate institution, he changed his major to mechanical engineering.
Graduating from New Mexico Tech within four years, (a full year and a half above the
average) Sean decided to pursue further education. Accepted to North Carolina State
University in the Fall of 2002, the challenges of graduate school became evident on the first
day of class with Dr Hassan Hassan’s fluid mechanics course. Though it was a challenge,
Sean’s successful completion of this course showed him the significant differences between
pursue a thesis in computational combustion. He successfully completed his Master’s degree
with Dr Tarek Echekki in the fall of 2004 in mechanical engineering with a minor in
mathematics.
Congruently when completing his master’s degree in the Fall of 2004, Sean started
research on his PhD work with Dr William Roberts. Fortunate to have Dr Stephen Marley
willing to assist him in the preparatory stages of his research, Sean was able to progress
relatively quickly to assemble the complex task at hand. Plagued by uncooperative
equipment, much of the research was forced in unplanned directions. Thanks to the
dedication of Dr Roberts and Dr Tiegang Fang, Sean’s research was able to continue and
Acknowledgements
This work would not have been possible without the help of a large number of people.
First I’d like to thank my committee for being a part of this procedure and taking time out of
their busy schedules to oversee this process in such a professional manner. I would like to
specifically thank Dr Tarek Echekki for the extensive guidance during my master’s program
at State and the continued advice through my PhD. I would also like to thank Dr William
Roberts for providing an excellent project and being a very capable researcher with immense
knowledge, which he would never hesitate to share with me. Finally I would like to thank Dr
Drake and Dr Fansler from GM R&D for their extensive knowledge and assistance through
advice and equipment.
I would also like to thank my colleagues at the AERL. First, the extensive help of Dr
Stephen Marley, who patently took time out of his last semester to help explain the
intricacies of this experimental process and without whom I would have spent significantly
more time learning. Also, I would like to thank Dr Tiffany Yelverton for always brining a
sense of humor to the lab and making work a lot of fun. Furthermore I would like to thank
Ranjith Kumar Abhinavam Kailasan for bringing an excellent world perspective to my life
and allowing me to see things differently.
Finally, I would like to thank the multitude of people outside of my work, who have
brought me here. First, my parents (all four of them) without whom I would not be the
person I am today and to whom I owe everything. Thank you for being so kind, helpful and
working. I’d also like to thank Dawn for pushing me to pursue this degree and to whom I
wish the very best in the future. Finally, I want to thank Meg for being there for me at all
times of the day or night with an open heart and an open mind. Thank you for all you have
done for me during this uncertain and chaotic time and thank you for your immense patience
Table of Contents
LIST OF TABLES... ix
LIST OF FIGURES ...x
1 INTRODUCTION...1
1.1 BACKGROUND AND REVIEW...1
1.2 SPECIFIC AIM...5
1.3 COMBUSTION CHAMBER AND VORTEX GENERATOR...5
1.4 FLAME PROPERTIES...7
1.5 VORTEX STRENGTH AND INTERACTION TIME...8
2 TRANSIENT STRETCH EFFECTS ON FLAME SPEED AND REACTANT CONSUMPTION RATE THROUGH HIGH-SPEED IMAGING AND PRESSURE MEASUREMENTS ...15
2.1 INTRODUCTION...15
2.2 EXPERIMENTAL SETUP...16
2.2.1 High-Speed Imaging ...17
2.2.2 Pressure Measurements...17
2.3 RESULTS...18
2.3.1 Undisturbed Flame Kernels...18
2.3.2 Disturbed Flame Kernels: Methane ...22
2.3.3 Disturbed Flame Kernels: “Slow” Propane...28
2.3.4 Disturbed Flame Kernels: “Fast” Propane ...32
2.4 SUMMARY...35
3 LOCAL FLAME-VORTEX EFFECTS, MEASURED USING NON-INVASIVE LASER DIAGNOSTICS ...61
3.1 INTRODUCTION...61
3.1.1 Laser Induced Fluorescence (LIF) ...62
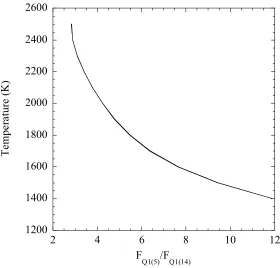
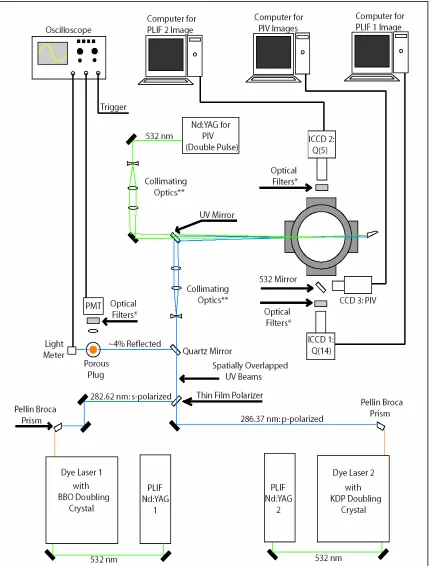
3.1.2 2-λ OH Fluorescence and Boltzmann for Thermometry...63
3.2 EXPERIMENTAL SETUP...64
3.2.1 Optical Equipment...65
3.2.2 Timing...66
3.2.3 Image Post-processing...67
3.3 FLAME BOUNDARY:THRESHOLDING...68
3.4 STRETCH RATE...71
3.5 THERMOMETRY...73
3.6 GENERAL TRENDS...79
3.7 SUMMARY...81
4 QUANTIFICATION OF ELECTRODE PERTURBATION THROUGH LASER IGNITION ...102
4.1 MOTIVATION...102
4.2 EXPERIMENTAL SETUP...103
4.3 COMPARISON OF UNDISTURBED LASER-IGNITED KERNELS TO SPARK-IGNITED KERNELS...104
4.4 COMPARISON OF DISTURBED LASER-IGNITED KERNELS TO SPARK-IGNITED KERNELS...107
4.4.1 Weak vortex interaction of the laser ignited flames...107
4.4.4 Effect of ignition type on flame burning velocity ...113
4.5 EFFECT OF INCREASED LASER ENERGY ON KERNEL FORMATION...115
4.6 ABBREVIATED CONCLUSIONS...117
5 CONCLUSIONS ...134
6 FUTURE WORK...138
7 LITERATURE CITATIONS...139
List of Tables
TABLE 1.1:PROPERTIES FOR CH4-O2-N2 FLAMES AT 300K AND 1 ATM...10 TABLE 1.2:PROPERTIES FOR “LOW” FLAME SPEED C3H8-O2-N2 FLAMES AT 300K AND 1 ATM...11 TABLE 1.3:PROPERTIES FOR “HIGH” FLAME SPEED C3H8-O2-N2 FLAMES AT 300K AND 1 ATM. ...12 TABLE 2.1: AVERAGE/MAXIMUM NORMALIZED REACTANT CONSUMPTION RATE OF THE METHANE FLAME
BETWEEN 60 MS AND 200 MS. ...39 TABLE 2.2: AVERAGE/MAXIMUM NORMALIZED REACTANT CONSUMPTION RATE FOR THE PROPANE FLAMES
List of Figures
FIGURE 1.1:DRAWINGS OF EXPERIMENTAL CONFIGURATION, SHOWING (A) A 3D ISOMETRIC CUTOUT OF THE COMBUSTION CHAMBER WITH OPTICAL ACCESS,(B) THE PISTON-CYLINDER AND (C) THE ORIENTATION OF THE KERNEL-VORTEX INTERACTION. NOTE: IGNITION ELECTRODES WERE REMOVED FOR THE LASER IGNITION EXPERIMENT (SEE CHAPTER 4). ...13 FIGURE 1.2:NON-DIMENSIONAL VORTEX STRENGTH VERSUS SIZE (BORGHI DIAGRAM) FOR THE C3H8-O2-N2 AND
CH4-O2-N2 FLAMES AND VORTICES INVESTIGATED. ...14 FIGURE 2.1: WIRING DIAGRAM FOR THE SPARK-IGNITED CH4-O2-N2 AND C3H8-O2-N2 FLAMES TO MEASURE
FLAME SPEED USING A HIGH-SPEED CAMERA AND GLOBAL PRESSURE MEASUREMENTS...40 FIGURE 2.2:HIGH-SPEED FLAME EMISSION IMAGES OF UNDISTURBED OUTWARDLY PROPAGATING FLAME KERNEL
FOR Φ=0.90 AND O2/(O2+N2)=0.159. ALL TIMES LISTED ARE RELATIVE TO SPARK IGNITION. THE FIELD OF VIEW IN EACH IMAGE IS 95.7 MM WIDE X 100.0 MM HIGH. ...41 FIGURE 2.3:UNDISTURBED EFFECTIVE RADIUS OF THE METHANE FLAMES STUDIED. EQUIVALENCE RATIOS ABOVE 0.64 HAVE BEEN DILUTED WITH NITROGEN TO MATCH THE LEAN FLAME SPEED. ...41 FIGURE 2.4:HIGH-SPEED FLAME EMISSION IMAGES OF UNDISTURBED OUTWARDLY PROPAGATING C3H8-O2-N2
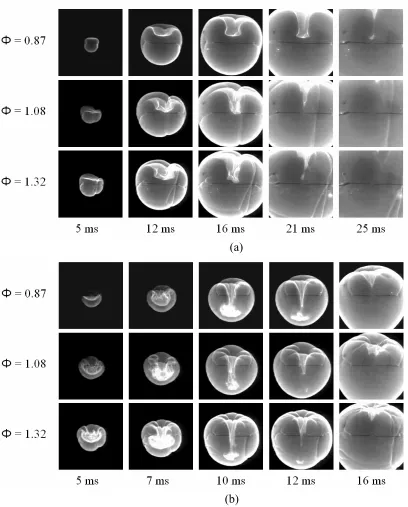
FLAME KERNELS FOR =0.87(TOP ROW) AND =1.32(BOTTOM ROW).ALL TIMES LISTED ARE RELATIVE TO SPARK IGNITION.THE FIELD OF VIEW IN EACH IMAGE IS 95.7 MM WIDE X 100.0 MM HIGH. ...42 FIGURE 2.5:(A)METHANE FLAME’S RESPONSE TO STRETCH, FOR EACH OF THE EQUIVALENCE RATIOS STUDIED
CALCULATED FROM EFFECTIVE RADIUS. (B)UNDISTURBED PRESSURE TRACES FOR EACH FLAME MIXTURE (DIFFERENT N2 DILUTION LEVELS ARE USED TO MAKE PRESSURE RISE SIMILAR FOR ALL CASES). TIME IS RELATIVE TO SPARK IGNITION...43 FIGURE 2.6:(A)FLAME RADIUS HISTORY FOR PROPANE FLAMES FREELY PROPAGATING WITHOUT VORTEX
INTERACTION.N2 DILUTION LEVELS FOR THE “SLOW” FLAMES WERE CHOSEN TO MATCH (AS CLOSELY AS POSSIBLE) THE =0.69/1.49 FLAME PROPAGATION RATE.(B)GLOBAL PRESSURE MEASUREMENTS FOR UNDISTURBED,=0.69,0.87,1.08,1.32 AND 1.49, KERNELS. =0.87,1.08 AND 1.32 FLAMES ARE DILUTED TO APPROXIMATE THE 0.69/1.49 FLAME SPEED FOR THE “LOW” FLAME SPEED RESULTS AND ARE SHOWN ON THE PRIMARY Y-AXIS, WHILE THE “HIGH”1.08 FLAME IS NITROGEN DILUTED TO APPROXIMATE THE 0.87 FLAME SPEED AND ARE SHOWN ON THE SECONDARY Y-AXIS. ALL TIMES ARE RELATIVE TO SPARK IGNITION...44 FIGURE 2.7:EFFECTIVE RADIUS DERIVED UNDISTURBED LAMINAR PROPANE BURNING VELOCITY NORMALIZED BY
THE UNSTRETCHED LAMINAR BURNING VELOCITY FOR THE (A) SLOW FLAME SPEED AND THE (B) FAST FLAME SPEED FOR EACH EQUIVALENCE RATIO STUDIED.TIME IS AFTER IGNITION. ...45 FIGURE 2.8:LOW-LIMIT (34 KPA MAX) PRESSURE TRACE FOR THE =0.64 FLAME KERNEL, AND THE
CORRESPONDING CHEMILUMINESCENCE IMAGES AT 30 MS FOR THE UNDISTURBED FLAME AND FOR
INTERACTIONS WITH DIFFERENT STRENGTH VORTICES. TIME IS RELATIVE TO SPARK IGNITION...45 FIGURE 2.9: HIGH-SPEED FLAME EMISSION IMAGES OF LATE KERNEL-VORTEX INTERACTION FOR =0.90 AND
WEAK VORTEX (U=77 CM/S,U/SL,=7.46, DO/D=44.8). ALL TIMES LISTED ARE RELATIVE TO SPARK
IGNITION. THE FIELD OF VIEW IN EACH IMAGE IS 95.7 MM WIDE X 100.0 MM HIGH. ...46 FIGURE 2.10:HIGH-SPEED FLAME EMISSION IMAGES OF LATE KERNEL-VORTEX INTERACTION FOR =1.13 AND
STRONG VORTEX (U=398 CM/S,U/SL,=29.8, DO/D=58.1). ALL TIMES LISTED ARE RELATIVE TO SPARK
IGNITION. THE FIELD OF VIEW IN EACH IMAGE IS 95.7 MM WIDE X 100.0 MM HIGH. ...47 FIGURE 2.11:EFFECT OF VORTEX STRENGTH ON FLAME SPEED FOR THE METHANE-AIR FLAME AT THE THREE
EQUIVALENCE RATIOS STUDIED FOR: THE LATE INTERACTIONS OF THE (A) WEAK VORTEX (U=77 CM/S)
AND (B) THE STRONG VORTEX (U=398 CM/S); AND THE EARLY INTERACTIONS OF THE (C) WEAK VORTEX
AND (D) STRONG VORTEX (=1.13 UNDERGOES GLOBAL EXTINCTION). SHOWN ARE THE DISTURBED FLAMES NORMALIZED BY THE UNDISTURBED FLAMES
SL,i SL,u
. ALL TIMES ARE RELATIVE TO SPARK IGNITION. ...48 FIGURE 2.12:HIGH-SPEED FLAME EMISSION IMAGES OF EARLY KERNEL-VORTEX INTERACTION FOR THE SPARKFIGURE 2.13HIGH-SPEED FLAME EMISSION IMAGES OF EARLY KERNEL-VORTEX INTERACTION FOR THE SPARK -IGNITED,Φ=0.64 METHANE FLAME AND STRONG VORTEX (UΘ=398 CM/S,UΘ/SL,∞=42.4, DO/ΔD=40.8). ALL
TIMES LISTED ARE RELATIVE TO SPARK IGNITION. THE FIELD OF VIEW IN EACH IMAGE IS 95.7 MM WIDE X 100.0 MM HIGH. ...50 FIGURE 2.14:HIGH-SPEED FLAME EMISSION IMAGES OF EARLY KERNEL-VORTEX INTERACTION FOR THE SPARK
-IGNITED,Φ=1.13 METHANE FLAME AND STRONG VORTEX (U=398 CM/S,U/SL,=29.8, DO/D=58.1).
IMAGE EDGES ARE ARTIFICIALLY ENHANCED THROUGH THRESHOLDING TO EMPHASIZE THE FLAME BOUNDARY DURING THE QUENCHING PROCESS.THE TIME SEPARATION BETWEEN FRAMES IS SHORT TO CAPTURE THE EXTINCTION EVENT.ALL TIMES LISTED ARE RELATIVE TO SPARK IGNITION. ...51 FIGURE 2.15:EFFECT OF INTERACTION TIME ON FLAME PROPAGATION FOR THE SPARK-IGNITED =0.64
CH4-O2-N2 FLAME INTERACTING WITH THE WEAK VORTEX (U=77 CM/S). VERTICAL LINES INDICATE THE START OF
THE VORTEX INTERACTION; EARLY INTERACTION FIRST FOLLOWED SEQUENTIALLY BY THE LATER
INTERACTIONS. ...52 FIGURE 2.16:EFFECT OF VORTEX STRENGTH ON FLAME PROPAGATION FOR THE SPARK-IGNITED (A)=0.64
FLAME AND (B) THE =1.13 FLAME UNDERGOING EARLY KERNEL-VORTEX INTERACTIONS. SOLID TRIANGLES ARE EXTRAPOLATED FROM A SECOND-ORDER POLYNOMIAL FIT TO THE LAST 20 MS.TIME IS RELATIVE TO SPARK IGNITION. VORTEX IS APPROXIMATELY 1.25 CM (CORE-TO-CORE) AND INTERACTS AT APPROXIMATELY 5MS AFTER IGNITION. ...53 FIGURE 2.17:HIGH-SPEED SPARK-IGNITED C3H8-O2-N2 FLAME EMISSION IMAGES OF LATE KERNEL-VORTEX
INTERACTION FOR =0.69,0.87,1.08,1.32 AND 1.49, WEAK VORTEX (U=77 CM/S,U/SL,=3.59, DO/ΔD= 195.3), AND “SLOW” FLAME PROPAGATION RATE.ALL TIMES LISTED ARE RELATIVE TO SPARK IGNITION. THE FIELD OF VIEW IN EACH IMAGE IS 95.7 MM WIDE X 100.0 MM HIGH. ...54 FIGURE 2.18: EFFECT OF VORTEX STRENGTH ON FLAME SPEED FOR THE SPARK-IGNITED PROPANE-AIR FLAME AT
EACH EQUIVALENCE RATIO STUDIED AT THE SLOW PROPAGATION RATE FOR: THE WEAK VORTEX (U=77
CM/S) AT THE (A) LATE INTERACTION, AND (B) EARLY INTERACTION; AND THE STRONG VORTEX (U=398
CM/S) AT THE (C) LATE INTERACTION AND (D) EARLY INTERACTION. SHOWN ARE THE DISTURBED FLAMES NORMALIZED BY THE UNDISTURBED FLAMES
SL,i SL,u
. ALL TIMES ARE RELATIVE TO SPARK IGNITION. ...55 FIGURE 2.19: HIGH-SPEED SPARK-IGNITED C3H8-O2-N2 FLAME EMISSION IMAGES OF EARLY KERNEL-VORTEXINTERACTION FOR =0.69,0.87,1.08,1.32 AND 1.49, WEAK VORTEX (U=77 CM/S,U/SL,=3.59, DO/ΔD= 195.3), AND SLOW FLAME PROPAGATION RATE.ALL TIMES LISTED ARE RELATIVE TO SPARK IGNITION.THE FIELD OF VIEW IN EACH IMAGE IS 95.7 MM WIDE X 100.0 MM HIGH...56 FIGURE 2.20: HIGH-SPEED SPARK-IGNITED C3H8-O2-N2 FLAME EMISSION IMAGES OF EARLY KERNEL-VORTEX
INTERACTION FOR =0.69,0.87,1.08,1.32 AND 1.49, STRONG VORTEX (U=398 CM/S,U/SL,=25.30,
DO/ΔD=143.1), AND SLOW FLAME PROPAGATION RATE.ALL TIMES LISTED ARE RELATIVE TO SPARK IGNITION.THE FIELD OF VIEW IN EACH IMAGE IS 95.7 MM WIDE X 100.0 MM HIGH. ...57 FIGURE 2.21: HIGH-SPEED SPARK-IGNITED C3H8-O2-N2 FLAME EMISSION IMAGES OF LATE KERNEL-VORTEX
INTERACTION FOR =0.87,1.08, AND 1.32, WITH (A)WEAK VORTEX (U=77 CM/S,U/SL,=3.59, DO/ΔD= 195.3), AND (B)STRONG VORTEX (U=398 CM/S,U/SL,=25.30, DO/ΔD=143.1), AT THE FAST FLAME PROPAGATION RATE.ALL TIMES LISTED ARE RELATIVE TO SPARK IGNITION.THE FIELD OF VIEW IN EACH IMAGE IS 73.2 MM WIDE X 75.8 MM HIGH. ...58 FIGURE 2.22: EFFECT OF VORTEX STRENGTH ON FLAME SPEED FOR THE SPARK-IGNITED PROPANE-AIR FLAME AT
EACH EQUIVALENCE RATIO STUDIED AT THE FAST PROPAGATION RATE FOR: THE WEAK VORTEX (U=77
CM/S) AT THE (A) LATE INTERACTION, AND (B) EARLY INTERACTION; AND THE STRONG VORTEX (U=398
FIGURE 2.23: HIGH-SPEED SPARK-IGNITED C3H8-O2-N2 FLAME EMISSION IMAGES OF EARLY KERNEL-VORTEX INTERACTION FOR =0.87,1.08, AND 1.32, WITH (A) WEAK VORTEX (U=77 CM/S,U/SL,=3.59, DO/ΔD= 195.3), AND (B) STRONG VORTEX (U=398 CM/S,U/SL,=25.30, DO/ΔD=143.1), AT THE “FAST” FLAME PROPAGATION RATE.ALL TIMES LISTED ARE RELATIVE TO SPARK IGNITION.THE FIELD OF VIEW IN EACH IMAGE IS 73.2 MM WIDE X 75.8 MM HIGH. ...60 FIGURE 3.1:TEMPERATURE AS A FUNCTION OF FLUORESCENCE RATIO DESCRIBED BY EQUATION 3.2...83 FIGURE 3.2:OPTICAL SETUP FOR THE SIMULTANEOUS 2-Λ OHPLIF AND PIV EXPERIMENT...84 FIGURE 3.3: OPTICAL FILTERS USED TO REMOVE ELASTICALLY SCATTERED LIGHT FOR THE OH-PLIF IMAGE
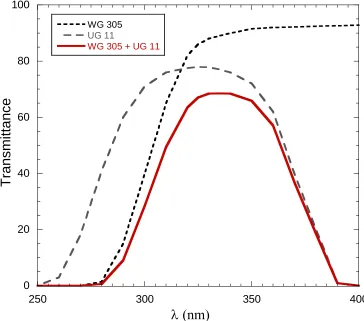
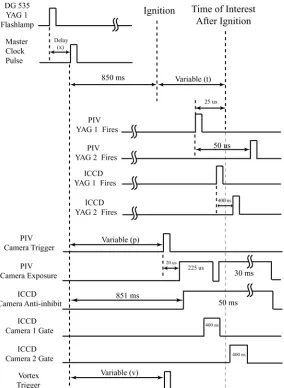
ACQUISITION. THE COMBINATION OF THE TWO FILTERS EFFECTIVELY CREATES A SINGLE BAND-PASS FILTER CENTERED APPROXIMATELY AROUND 335 NM. ...85 FIGURE 3.4: TIMING DIAGRAM OF THE SIMULTANEOUS PIV&OH-PLIF EXPERIMENT. THE VALUES FOR P AND V
VARIED ACCORDING TO THE TIME OF INTEREST (T) AFTER IGNITION, SINCE THEY ARE NOT TRIGGERED FROM THE LASER GATE. ...86 FIGURE 3.5:THRESHOLD IMAGES OF METHANE WITH AN EQUIVALENCE RATIO OF 0.64 SHOWING (A) AN
UNDISTURBED FLAME; A FLAME INTERACTING WITH (B) A WEAK VORTEX,(C) A MEDIUM VORTEX AND (D) A STRONG VORTEX. TIME IS RELATIVE TO IGNITION. EACH IMAGE HAS DIMENSIONS 38.5 MM X 25.6 MM. ....87 FIGURE 3.6:RATIO OF FLAME LENGTH TO CROSS-SECTION AREA FOR EACH METHANE FLAME-VORTEX
INTERACTION OBSERVED. THE BEST-FIT LINES ARE SECOND-ORDER POLYNOMIALS. ...88 FIGURE 3.7:THRESHOLD IMAGES OF PROPANE WITH AN EQUIVALENCE RATIO OF 0.69 INTERACTED WITH A (A)
WEAK VORTEX AND (B) STRONG VORTEX...88 FIGURE 3.8:THRESHOLD IMAGES OF PROPANE WITH AN EQUIVALENCE RATIO OF 0.87 INTERACTED WITH A (A)
WEAK VORTEX AND (B) STRONG VORTEX...89 FIGURE 3.9:THRESHOLD IMAGES OF PROPANE WITH AN EQUIVALENCE RATIO OF 1.08 INTERACTED WITH A (A)
WEAK VORTEX AND (B) STRONG VORTEX...89 FIGURE 3.10:THRESHOLD IMAGES OF PROPANE WITH AN EQUIVALENCE RATIO OF 1.32 INTERACTED WITH A (A)
WEAK VORTEX AND (B) STRONG VORTEX...90 FIGURE 3.11:RATIO OF FLAME LENGTH TO CROSS-SECTION AREA FOR PROPANE FLAMES INTERACTING WITH A (A)
WEAK VORTEX AND (B) A STRONG VORTEX. THE BEST-FIT LINES ARE SECOND-ORDER POLYNOMIALS...90 FIGURE 3.12:TANGENTIAL VELOCITY AS A FUNCTION OF TANGENTIAL COORDINATE FOR THE =0.64 METHANE
FLAME...91 FIGURE 3.13:AVERAGE STRETCH RATE ACROSS THE TOP OF THE FLAME ALONG THE CENTER THIRD OF THE FIELD
OF VIEW FOR THE =0.64 METHANE FLAME FOR EACH OF THE VORTEX STRENGTHS STUDIED. ...92 FIGURE 3.14:AVERAGE STRETCH RATE OF PROPANE FLAMES INTERACTING WITH WEAK AND STRONG VORTICES
FOR (A)=0.69,(B)=0.87,(C)=1.08 AND (D)=1.32. ...93 FIGURE 3.15:AVERAGE SIGNAL-TO-NOISE RATIO OF THE (A) METHANE FLAME AND (B) THE PROPANE FLAME AS A
FUNCTION OF EQUIVALENCE RATIO. THE BLACK LINE IS THE RATIO OF THE Q1(14) TO Q1(5) SIGNAL-TO -NOISE RATIO AND IS PLOTTED ON THE SECONDARY Y-AXIS...94 FIGURE 3.16: TWO-DIMENSIONAL TEMPERATURE AND VELOCITY FIELD OF =0.64 METHANE UNDERGOING AN
INTERACTION WITH A WEAK VORTEX (UΘ=77 CM/S) AT 7 MS AFTER IGNITION...95
FIGURE 3.17: TWO-DIMENSIONAL TEMPERATURE AND VELOCITY FIELD OF =0.64 METHANE UNDERGOING AN INTERACTION WITH A MEDIUM VORTEX (UΘ=266 CM/S) AT 7 MS AFTER IGNITION...96
FIGURE 3.18:TWO-DIMENSIONAL TEMPERATURE AND VELOCITY FIELD OF =0.64 METHANE UNDERGOING AN INTERACTION WITH A STRONG VORTEX (UΘ=398 CM/S) AT 7 MS AFTER IGNITION. ...97
FIGURE 3.19:COMBINED THERMOMETRY AND VELOCITY DATA FOR THE PROPANE FLAMES (A)=0.69(B)= 0.87(C)=1.08(D)=1.32 UNDERGOING A WEAK INTERACTION. ...98 FIGURE 3.20:COMBINED THERMOMETRY AND VELOCITY DATA FOR THE PROPANE FLAMES (A)=0.69(B)=
0.87(C)=1.08(D)=1.32 UNDERGOING A STRONG INTERACTION...99 FIGURE 3.21:LEAN METHANE TEMPERATURE AT 7 MS AFTER IGNITION ALONG THE TOP-CENTER (-0.2<S<0.2) OF
THE FLAME AS A FUNCTION OF STRETCH RATE. THE BLACK POINTS REPRESENT THE AVERAGE OF THE SURROUNDING VALUES...100 FIGURE 3.22:TEMPERATURE AS A FUNCTION OF STRETCH RATE FOR THE (A)=0.69 PROPANE FLAME, THE (B)=
AFTER IGNITION ALONG THE TOP-CENTER (-0.2<S<0.2) OF THE FLAME-VORTEX INTERFACE. THE BLACK POINTS REPRESENT THE AVERAGE OF THE SURROUNDING VALUES...101 FIGURE 4.1:EXPERIMENTAL SETUP MODIFICATION FOR LASER IGNITION. ...119 FIGURE 4.2:HIGH-SPEED CHEMILUMINESCENCE IMAGES OF THE UNDISTURBED LASER IGNITED METHANE FLAME.
...120 FIGURE 4.3:HIGH-SPEED CHEMILUMINESCENCE IMAGES OF THE UNDISTURBED LASER IGNITED PROPANE FLAME.
TIME IS RELATIVE TO IGNITION. ...121 FIGURE 4.4:UNDISTURBED EFFECTIVE RADIUS OF THE LASER-IGNITED (A) METHANE FLAMES AND (B) PROPANE
FLAMES STUDIED. ...122 FIGURE 4.5:SEQUENCE OF HIGH-SPEED CHEMILUMINESCENCE IMAGES OF THE WEAK VORTEX INTERACTING WITH
THE LASER IGNITED METHANE FLAME...122 FIGURE 4.6:SEQUENCE OF HIGH-SPEED CHEMILUMINESCENCE IMAGES OF THE WEAK VORTEX INTERACTING WITH
THE LASER IGNITED PROPANE FLAME. TIME IS RELATIVE TO IGNITION...123 FIGURE 4.7:SEQUENCE OF HIGH-SPEED CHEMILUMINESCENCE IMAGES OF THE STRONG VORTEX INTERACTING
WITH THE LASER IGNITED METHANE FLAME...124 FIGURE 4.8:SEQUENCE OF HIGH-SPEED CHEMILUMINESCENCE IMAGES OF THE STRONG VORTEX INTERACTING
WITH THE LASER IGNITED PROPANE FLAME...125 FIGURE 4.9:EFFECTIVE RADIUS MEASUREMENTS OF THE LASER IGNITED METHANE FLAME AT (A)=0.64 AND (B)
=1.13. ...126 FIGURE 4.10:COMPARISON OF LASER IGNITION EFFECTIVE RADIUS MEASUREMENTS (A AND C) TO SPARK IGNITED
EFFECTIVE RADIUS MEASUREMENTS (B AND D) OF THE PROPANE FLAME AT (A AND B)=0.69 AND (C AND D)=0.87 ...127 FIGURE 4.11:COMPARISON OF (A AND C) LASER IGNITION EFFECTIVE RADIUS MEASUREMENTS TO (B AND D)
SPARK IGNITED EFFECTIVE RADIUS MEASUREMENTS OF THE PROPANE FLAME AT (A AND B)=1.08 AND (C AND D)=1.32 ...128 FIGURE 4.12:COMPARISON OF LASER IGNITION EFFECTIVE RADIUS MEASUREMENTS (A) TO SPARK IGNITED
EFFECTIVE RADIUS MEASUREMENTS (B) OF THE PROPANE FLAME AT =1.49. ...129 FIGURE 4.13:DISTURBED LAMINAR BURNING VELOCITY NORMALIZED BY UNDISTURBED LAMINAR BURNING
VELOCITY FOR THE METHANE FLAME. LASER IGNITION IS SHOWN IN THE LEFT COLUMN, WHILE SPARK IGNITION IS SHOWN IN THE RIGHT COLUMN TO FACILITATE COMPARISON OF AUGMENTATION BETWEEN IGNITION TYPES FOR (A-B) WEAK VORTICES,(C-D) MEDIUM VORTICES AND (E-F) STRONG VORTICES. ...130 FIGURE 4.14:DISTURBED LAMINAR BURNING VELOCITY NORMALIZED BY UNDISTURBED LAMINAR BURNING
VELOCITY FOR THE PROPANE FLAME. LASER IGNITION IS SHOWN IN THE LEFT COLUMN, WHILE SPARK IGNITION IS SHOWN IN THE RIGHT COLUMN TO FACILITATE COMPARISON OF AUGMENTATION BETWEEN IGNITION TYPES FOR (A-B) WEAK VORTICES,(C-D) MEDIUM VORTICES AND (E-F) STRONG VORTICES. ...131 FIGURE 4.15:NORMALIZED REACTANT CONSUMPTION RATE AS A FUNCTION OF THERMO-DIFFUSIVITY
(MARKSTEIN NUMBER) FOR ALL FLAMES STUDIED. SOLID LINES ARE THIRD ORDER FITS TO THE SPARK -IGNITED AND LASER-IGNITED FLAMES INTERACTING WITH A STRONG VORTEX...132 FIGURE 4.16:DISTURBED BURNING VELOCITY NORMALIZED BY UNDISTURBED BURNING VELOCITY AS A
FUNCTION OF AVERAGE STRETCH RATE (ACROSS ALL TIME) FOR ALL FLAMES STUDIED...132 FIGURE 4.17:EFFECTIVE RADIUS OF THE HIGH-INTENSITY REGION OF THE LASER IGNITION SITE AS A FUNCTION OF LASER ENERGY. THE BEST-FIT LINE IS A SECOND-ORDER POLYNOMIAL...133 FIGURE 4.18:EFFECT OF LASER ENERGY ON EFFECTIVE RADIUS OF THE UNDISTURBED =0.64 METHANE FLAME.
1
Introduction
1.1
Background and Review
The understanding of complex premixed combustion reactions is paramount to the
development of new concepts and devices used to increase the overall usefulness and
capabilities of current technology. The evolution from laminar spherically propagating
flames to turbulent chemistry is a logical and necessary process to study the complex
interactions which occur within any modern practical combustion device [1]. Due to its
non-laminar behavior, fully turbulent combustion is difficult to reproduce experimentally with the
accuracy required to quantify the multi-scale nature of the flow. Analysis of kernel-vortex
interactions using laminar flows to represent the turbulent stretching induced upon onset of
high curvature has become a well respected answer to this problem.
As previously implied, experimental research involving turbulent chemistry requires
choosing a repeatable representation of turbulence. Kernel-vortex interactions have been
studied in detail and continue to be an area of interest for combustion researchers [2]. Many
past experiments have focused on steady combustion using a variety of burner types [3, 6].
Previous research into freely propagating flame kernels interacting with a vortex has shown
the high sensitivity to curvature expressed by the flame’s propagation rate [2]. Further
analysis into the flame geometry and vortex effectiveness, performed by Roberts et al [7, 8]
found a dependence on the vortex characteristics and time of interaction. A disturbed flame
could exist in both the flamelet regime and distributed reaction zone regime [8].
Several other investigations have considered premixed flame-vortex interactions. Bell et
al. performed numerical simulations of flat, nitrogen-diluted premixed methane-air flames
interacting with a vortex pair of similar characteristics as experimentally investigated by
Nguyen and Paul, whose work considered a rich methane-air flame and indicated dramatic
changes in CH and OH concentrations as a result of the interaction [9, 10]. The results of
Bell et al. agree with Nguyen and Paul with respect to the marked decrease in CH
concentration. Therefore, a strong coupling between the flow field and chemistry was
observed [11], suggesting the need for more detailed analysis of the effect of unsteady stretch
on flame propagation, especially for incorporation into future numerical models. More
recently, Sinibaldi et al. tested the theory of flame stretch, which relates laminar flame speed
to flame stretch rate, during unsteady wrinkling of methane-air and propane-air flames [12].
They chose to investigate the interaction of a flat laminar flame with a vortex toroid of
varying strength. Spatially and temporally resolved stretch rate measurements were made
along the flame surface using a simultaneous PIV/OH-PLIF diagnostic in conjunction with
high-speed shadowgraph imaging. The experimental trends support the well established
theory of flame stretch, although measurements of the Markstein number support the
postulation that separate Markstein numbers should be identified for the individual strain and
curvature contributions to stretch rate [12-14].
The research described up to this point has focused on interactions between a vortex and
surface. In internal combustion engines [15-17], spark-ignition and the growth of the
resulting flame kernel introduces another time-varying flame stretch as the small flame
kernel radius expands. This early stage of flame development just after ignition is when the
flame is most susceptible to stretch rates imposed by the turbulent flowfields, resulting in
flame speed enhancement or local or global quenching [16]. Maximizing the repeatability of
the ignition process and enhancing the rate of early flame kernel growth is important in
minimizing misfires and partial burn cycles in IC engines, especially at the high levels of
charge dilution that are desirable to minimize pumping losses in homogeneous-charge SI
engines and to minimize NO production in stratified-charge SI engines. Flame kernel-vortex
interactions provide the opportunity to study flame stretch effects in a simplified, repeatable
laminar configuration. The transient stretch of the expanding flame kernel can be varied with
flame kernel size, composition, and flame speed. Each vortex size and strength can simulate
a specific length and velocity scale of the continuum of scales that comprise a turbulent flow
field.
The effects of transient stretch on “young” spark-ignited flame kernels during the
transition period between ignition and fully developed flames have been analyzed
experimentally by the interaction of spherical flame kernels with laminar vortices (primarily
by Roberts and coworkers [8, 18, 19]). Their results highlight the added complexity of flame
kernel-vortex interactions over the earlier planar flame-vortex configuration. The first flame
kernel-vortex interactions were observed using OH-PLIF to determine the degree of flame
wrinkling and the ability of vortices of varying size and strength to globally quench
vortex size and strength and the time of the initial flame-vortex interaction, the disturbed
flame existed in either the flamelet regime (continuous reaction zone) or distributed reaction
zone regime (co-existence of reactants and products). Global extinction of the flame kernel
was observed with large vortex sizes interacting with small flame kernels. Localized
flamefront extinction occurred for a range of vortex sizes and strengths and a range of flame
kernel sizes. Xiong et al. [18, 19] investigated the two-dimensional structure of the vortex
interactions with spark-ignited lean methane-air and lean propane-air mixtures at atmospheric
pressure using high-speed imaging of CH* and OH* emission, as well as single-shot
OH-PLIF diagnostics. Augmentation of kernel growth rates, including Lewis number effects,
were studied using four characteristic vortex sizes and three different vortex strengths for
each of the four sizes. Charge stratification was also studied with a lean (Φ = 0.6)
methane-air kernel interacting with vortices composed of reactants ranging from pure methane-air to pure fuel.
This mimics local enrichment conditions near the spark electrode in direct injection lean burn
engines. Charge stratification suppressed combustion with very lean vortices (outside the
flammability limit) but enhanced combustion with fuel-rich vortices as expected [19].
Detailed modeling of flame kernel-vortex interactions (2-D direct numerical simulations
and detailed H2-air chemical kinetics) by Kolera-Gokula and Echekki [20] found
qualitatively similar results when compared to prior experiments. Depending upon the flame
kernel size and the vortex size and strength, two regimes were identified: 1) enhancement of
flame surface area and volumetric fuel consumption and, 2) global flame kernel extinction.
1.2
Specific Aim
With the insights gained from previous experiments, a wider array of the effect of
unsteady stretch is desired, specifically with the aero-thermodynamic response of an
externally perturbed thermo-diffusively stable or unstable premixed flame. The objective of
this work is to obtain a quantitative classification of the effect of unsteady stretch on
premixed combustion augmentation. The aerodynamic and thermodynamic threshold
between combustion augmentation and global extinction is of particular interest, due to the
direction application possible with practical combustion devices. Also of interest is a
pressure dependent classification of the effect of thermo-diffusivity and increased stretch
rate. Presented below, the experimental combustion device, fuel mixtures and vortex
generation are described, followed by three main chapters describing the varied experiments:
development of the necessary parameter space through high-speed imaging, and analysis of
vortex effects with effective radius measurements and calculated pressure-dependent reactant
consumption rate; local measurements from laser diagnostics for the quantification of stretch
effects; and the quantification of physical flame perturbation from ignition electrodes through
the study of laser ignition.
1.3
Combustion Chamber and Vortex Generator
For all the experiments described in the following chapters, the combustion chamber,
vortex generator and flow controllers remained constant. The combustion chamber was
identical to that used by Marley and Roberts [21] (Figure 1.1a). As seen in Fig. 1.1b, the
kernel was subjected to the vortex. Four large solenoid exhaust valves located at the bottom
of the chamber sealed the vessel during the preparatory stage of each experimental run. The
exhaust valves opened approximately 850 ms prior to ignition to allow vortex development
and to ensure the burned-gas pressures did not exceed the operational limitations of the
equipment. The reactant mixture was metered with calibrated mass flow controllers which
provided accuracies of +/- 0.3% for the fuel flow rate (methane, 99.0% purity) and +/- 1.1%
for the air and diluent (nitrogen) flow rates. In order to achieve a homogeneous reactant
mixture, the combustion chamber was purged with ten chamber volumes of fresh reactants
before closing the exhaust valves and allowing any motion to dissipate prior to initiating the
experiment. This procedure was proven to provide very repeatable flame propagation rates
which are crucial for this highly transient flame [21].
Ignition of the flame occurred in two ways: (1) spark-ignition or (2) laser ignition using
an Nd:YAG laser at its second harmonic ( = 532 nm). The spark ignition system utilized
inductive discharge and interfaced with a computer to easily change the spark energy (~100
mJ) and arc duration (nominally 2 ms). The laser ignition will be discussed in detail in
Section 4.2.
The generation of the vortex utilized an Animatics Smart Motor coupled to a linear
actuator, which displaced fluid in an aluminum piston in a stainless steel cylinder sealed with
iron piston rings. The opening of the cylinder was comprised of a sharp edged orifice with a
diameter of 10 mm to allow detachment of the vorticity generated from the displacement of
of vortex strengths. The distance from the orifice to the ignition site was held constant at 100
mm, resulting in an approximately 25% increase in vortex core-to-core diameter during
propagation.
1.4
Flame Properties
Undiluted methane-air flame equivalence ratios ( = 0.64, 0.90, and 1.13) were chosen
to observe the mild affects of thermo-diffusive stability on the methane-air flame. These
equivalence ratios, however, have very different laminar burning velocities (SL) and flame
thickness (D). Therefore, nitrogen was used as a diluent to retard the flame speeds of the
= 0.90, and 1.13 mixtures so that the undisturbed outwardly propagating spherical flame
kernel propagation rates, drf/dt, were approximately equal. The associated flame and mixture
properties utilized in this work for methane are listed in Table 1.1. Calculation of the
unstretched laminar burning velocity, SL,, was accomplished using linear regression of the
flame propagation rate versus flame stretch rate (K) extrapolated to zero stretch (K = 0) [21,
[27-29].
The flame response to stretch using a heavier hydrocarbon fuel (relative to methane) was
also desired since it is more closely related to fuels primarily used in practical applications.
As a result, propane was chosen as the “heavy” hydrocarbon fuel for investigation using
flame kernel-vortex interactions. The mixture conditions for the propane-air flames were
chosen so that the effects of chemistry could be studied independent of flame speed. Five
primary equivalence ratios were utilized for investigation: = 0.69, 0.87, 1.08, 1.32, and
0.87/1.32 mixtures have the same undiluted flame propagation rate, drf/dt. Therefore, in the
undiluted case, there are three flame speeds (in laboratory coordinates, not to be confused
with burning velocity) represented by these mixtures. This investigation focused on two of
those flame speeds with these five mixtures, labeled “low” and “high.” To achieve the low
flame speed, nitrogen was used as a diluent to retard the flame speeds of the =
0.87/1.08/1.32 mixtures so that the flame propagation rates equal that of = 0.69/1.49 for the
case of an undisturbed outwardly propagating spherical flame kernel. For the high flame
speed, which excludes = 0.69/1.49 since it was not desired to use an oxidizer mixture with
more than 21% O2, the = 0.87/1.32 mixtures were used undiluted, and the = 1.08 mixture
was diluted to match this flame propagation rate. The relevant flame and mixture properties
for the low and high flame speeds are given in Table 1.2 and Table 1.3, respectively.
The flame propagation rates used to obtain proper dilution levels for both fuels were
compared using well established spherical flame kernels and therefore were not subject to
ignition effects which will be different for each mixture composition. Values for the
Markstein number, Ma, and density ratio,u b , were measured in the same apparatus
utilizing the method presented by Marley and Roberts [21], with the results in good
agreement with recent literature [22-27].
1.5
Vortex Strength and Interaction Time
The classification of interaction time, based on when the vortex first affects flame
propagation, is accomplished by assigning three regimes of interaction: early, medium, and
is <1 at the time of first visible interaction. A late interaction is defined when this first
interaction occurs for a kernel to vortex diameter ratio >2. Any case falling in between these
definitions (1< kernel-vortex ratio <2) is labeled a medium interaction.
PIV measurements were carried out over a wide range of vortex strengths, and three
vortices were selected to be used in the flame kernel-vortex investigation. The “weak”
vortex rotational and translational velocities were measured to be 77 cm/s and 85 cm/s,
respectively. Similar analyses performed with the “medium” and “strong” vortex cases
revealed rotational/translational velocities of 266/255 cm/s and 398/351 cm/s, respectively.
The rotational velocity is termed the vortex strength since it will determine the stretch rate
imposed upon the flame surface [30].
In order to provide a common measure of the vortex effect on any flame front [31], the
rotational velocity, Uθ, was non-dimensionalized by the unstretched laminar burning
velocity, SL,, while a characteristic vortex length scale (cylinder exit diameter), do, was
non-dimensionalized by the characteristic flame thickness, δD. Figure 1.2 indicates the
Table 1.1: Properties for CH4-O2-N2 flames at 300K and 1 atm.
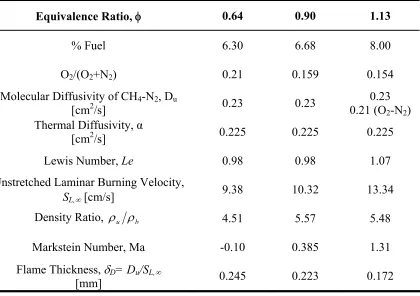
Equivalence Ratio, 0.64 0.90 1.13
% Fuel 6.30 6.68 8.00
O2/(O2+N2) 0.21 0.159 0.154
Molecular Diffusivity of CH4-N2, Du
[cm2/s] 0.23 0.23 0.21 (O0.23 2-N2)
Thermal Diffusivity, α
[cm2/s] 0.225 0.225 0.225
Lewis Number, Le 0.98 0.98 1.07
Unstretched Laminar Burning Velocity,
SL, [cm/s] 9.38 10.32 13.34
Density Ratio, u b 4.51 5.57 5.48
Markstein Number, Ma -0.10 0.385 1.31
Flame Thickness, D= Du/SL,
Table 1.2: Properties for “low” flame speed C3H8-O2-N2 flames at 300K and 1 atm.
Equivalence Ratio, 0.69 0.87 1.08 1.32 1.49
% Fuel 2.82 2.97 3.34 4.49 5.89
O2/(O2+N2) 0.21 0.176 0.160 0.178 0.21
Molecular Diffusivity
C3H8-N2, Du [cm2/s] 0.11 0.11 0.11 0.11 0.11
Molecular Diffusivity
O2-N2 [cm2/s] 0.21 0.21 0.21 0.21 0.21
Thermal Diffusivity, α
[cm2/s] 0.210 0.209 0.208 0.203 0.197
Lewis Number, Le 1.91 1.90 0.99 0.97 0.94
Laminar Burning Velocity,
SL,[cm/s] 21.47 18.85 18.34 15.73 13.93
Markstein Number, Ma 4.52 3.48 2.66 -0.61 -1.92
Flame Thickness, δD=Du/SL,
Table 1.3: Properties for “high” flame speed C3H8-O2-N2 flames at 300K and 1 atm.
Equivalence Ratio, 0.87 1.08 1.32
% Fuel 3.53 3.98 5.25
O2/(O2+N2) 0.21 0.192 0.21
Molecular Diffusivity
C3H8-N2, Du [cm2/s] 0.11 0.11 0.11
Molecular Diffusivity
O2-N2 [cm2/s] 0.21 0.21 0.21
Thermal Diffusivity, α
[cm2/s] 0.207 0.205 0.199
Lewis Number, Le 1.88 0.98 0.95
Laminar Burning Velocity, SL,
[cm/s] 32.39 31.00 29.60
Markstein Number, Ma 3.73 2.90 0.26
Flame Thickness, δD=Du/SL,
(b) (c) (a)
Exhaust Ignition
Vortex
Premixed Inlet
Sharp Edge Orifice
Piston
0.1 1 10
102
103
0.1 1 10 102 103 104
Propane Methane
Lo
g
10(
U
/S
L,
)
U
SL,
Log
10
(d
o/
D)
Thick Flames
Distributed Reaction Zone
Ka = 1
Corrugated Flamelets
Wrinkled Flames Laminar
Flames
Da = 1
Figure 1.2: Non-dimensional vortex strength versus size (Borghi diagram) for the C3H8
2
Transient Stretch Effects on Flame Speed
and Reactant Consumption Rate through
High-Speed Imaging and Pressure
Measurements
2.1
Introduction
High-speed chemiluminescence imaging was used to visualize each interaction, allowing
measurement of instantaneous flame kernel radius and identifying regions of intensified
combustion or local extinction during the interaction with a vortex. Simultaneously, the
chamber pressure was measured and used to calculate the laminar flame speed (relative to the
undisturbed flame kernel) at times where the kernel size exceeded the imaging field of view.
It is desirable to be able to categorize the affect of turbulence on a premixed flame using a
readily available diagnostic. Pressure measurements provide global information which may
contain sufficient variation to indicate flame augmentation.
Determination of the laminar burning velocity for each flame was accomplished as
follows. Assuming the wall effects of the combustion chamber were negligible at times near
ignition and the combustion chamber was a closed sphere, the flame speed can be expressed
in terms of the rate of pressure increase as [28]:
dt p p d p p p p R P S u b b 0 1 3 / 2 / 1 0 / 1 1 0 3 / 1 1 1 3 , 2.1
where R is the chamber radius, p is the chamber pressure, is the gas density, is the
conditions respectively. Likewise, the effective radius determined from chemiluminescence
images can be used to calculate the flame speed using the following differential:
dt dr r
Sb f f 2.2
Using equations 2.1 or 2.2, the laminar burning velocity is then calculated using [28, 29,
32]:
u b
b
L S
S . 2.3
In order to quantify the effects of stretch on the undisturbed kernel, the laminar burning
velocity, calculated from a vortex-affected kernel was normalized by that of the undisturbed
kernel at the same equivalence ratio and dilution level. This comparison between
experimental conditions is considered the relative increase in reactant consumption rate.
Particular focus has been placed on extending the results of past experimental work in
flame kernel-vortex interactions to include stronger vortices [8, 18, 19]. For example, the
weakest vortex in this investigation corresponded to the strongest vortex studied by Xiong et
al. [8, 18, 19]. Therefore, the present work probes new interactions with stronger vortices
while isolating chemistry effects by controlling the characteristic flame propagation rates
through N2 dilution.
2.2
Experimental Setup
Shown in Figure 2.1, the experimental setup for this investigation required the use of a
high-speed camera, pressure transducers and a multitude of data acquisition systems. The
remained constant for this experiment. Primary control of the timing and initiation of the
experiment was conducted with a custom-designed LabVIEW program.
2.2.1 High-Speed Imaging
Spark-ignited flame kernel-vortex interactions have been investigated using broadband
high-speed chemiluminescence imaging primarily of CO2*/CH*/OH* emission. A Kodak
EKTAPRO model 4540 high-speed camera was lens-coupled to an Imco ILS-3 intensifier
with a 105 mm UV-Nikkor lens to facilitate imaging at framing rates up to 4,500 frames per
second over a 95.7 mm wide by 100 mm high field of view.
An isodata thresholding algorithm was applied to each image to outline the flame
boundary. The projected area of the flame kernel was measured and an effective kernel
radius, rf, was then calculated assuming spherical symmetry. During many interactions the
disturbed flame surface was non-spherical, but since the effective radius simply scales with
the projected area, it provides a basis for comparison between cases and to previous work [8,
18, 19]. This combination of high-speed imaging and flame front tracking allows the flame’s
response to stretch to be analyzed during the early vortex flame interaction when they are
within the camera field of view.
2.2.2 Pressure Measurements
Accompanying the imaging measurements, instantaneous pressure measurements were
obtained to give a more detailed understanding of the effect of vortex strength on the overall
reactant consumption rate over an extended time scale. Although the actual experimental
of the system between 200 and 250 ms after spark ignition. Therefore the system is
approximately isochoric. The measurements were obtained using two Kulite Semiconductor
pressure transducers, one calibrated to a maximum of 35 gauge and the other to 690
kPa-absolute, which allowed simultaneous observation of small-scale and large-scale global
variations in pressure. The voltage signals were filtered using a third order Butterworth
digital filter in LabVIEW. By observing a minimum of five undisturbed kernels for each
equivalence ratio studied, the relative error of the global pressure was found to be within
2.5%, while the relative error of the small-scale measurements was found to be within 10%
for times less then 150 ms for the methane and 100 ms for the propane.
2.3
Results
2.3.1 Undisturbed Flame Kernels
Since the methane = 0.90 and = 1.13 flames were diluted with nitrogen to provide
the same flame speed as the = 0.64 case, the undisturbed chemiluminescence flame kernel
sequences are necessarily nearly identical, showing very little difference between lean and
rich flames, as seen in Figure 2.2. Given the relatively slow flame speeds of the methane
flame, the effect of buoyancy is present, causing the propagation rate of the upper
hemisphere to be as much as 30% higher than the lower half of the kernel by the time the
kernel has reached the edge of the field of view as seen in Figure 2.3 (corresponding to a
diameter of approximately 96 mm). Also, flow disturbance and heat loss due to the
electrodes introduces a dimple on both sides of the flame, resulting in a local sign change in
average methane flame propagation rates, measured from ignition until the flame reaches the
image edge, for the = 0.64, 0.90, and 1.13 undisturbed cases were 55.7 cm/s, 58.7 cm/s, and
61.4 cm/s, respectively.
Contrary to methane, the undisturbed propane flames show variations in the structure of
the flame as the mixture is changed from lean to rich. From Table 1.2, it is seen that the =
1.32 and = 1.49 mixtures are thermo-diffusively unstable, determined by a negative
Markstein number, and therefore will have the propensity to form wrinkled or cellular flame
structures under any perturbation. The other mixtures, thermo-diffusively stable, are able to
dampen out flame surface disturbances but will do so to a lesser degree as the Markstein
number decreases, which is observed with increasing equivalence ratio [33]. To illustrate
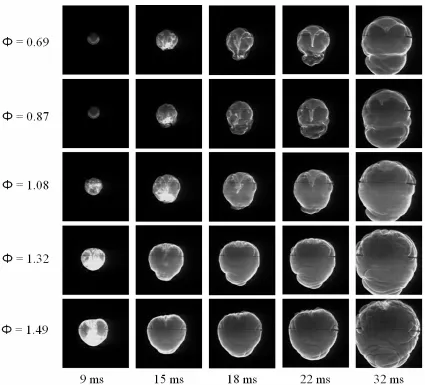
this point, Figure 2.4 shows chemiluminescence images of both a fuel-lean ( = 0.87, stable)
and a fuel-rich ( = 1.32, unstable) undisturbed outwardly propagating propane flame kernel
diluted to the slow flame speed. The stable flame possesses a very smooth flame surface,
while the unstable flame quickly forms wrinkles which will grow and then multiply to
eventually form a cellular flame.
Unstretched laminar burning velocity (SL,) was calculated using the methods of Marley
and Roberts [21] for both flames and used to normalize the undisturbed but stretched laminar
burning velocity (SL,u). Figure 2.5a shows the effect of stretch on the methane flame through
the normalization of the undisturbed laminar burning velocity by the unstretched laminar
burning velocity calculated from effective radius (Eqns. 2.2 & 2.3). The asymptotic trend of
each equivalence ratio shows the flames progression from highly curved to nearly planar.
ratio increases above unity, indicating a change from diffusively unstable to
thermo-diffusively stable flames. The slight increase in burning velocity shown by the = 0.64
flame at times shortly after ignition and the subsequent decrease in burning velocity as the
equivalence ratio is increased can be attributed to this thermo-diffusive stability change,
quantifying the methane flame’s moderate sensitivity to stretch. The evaluation of the
pressure-derived burning velocity includes the time rate of change of pressure which, at early
times, is minimal and induces a large amount of error. The pressure trace, shown in Fig.
2.5b, expresses the effectiveness at selecting the appropriate dilution to equate the flame
speeds of each equivalence ratio.
The time history of undisturbed propane effective kernel radius for two of the five
mixtures investigated is plotted in Figure 2.6a, as well as the simultaneously obtained
pressure measurements (Fig. 2.6b) to show a comparison between the fast and slow flame
speeds. Due to similarities in the results, the = 0.87 and = 1.32 flames represent the
thermo-diffusively stable and unstable flames respectively. Figure 2.6a shows the monotonic
increase of the unstable flames, while the stable flames are initially larger but still propagate
at the desired rate. It is interesting to note that the initial kernel size increases with decreasing
thermo-diffusive stability. Therefore, the initial propane kernels are larger as the equivalence
ratio increases, while the opposite trend is true for methane, which behaves similar to a
hydrogen-air flame. Also consistent with methane, the unstable propane flames exhibit a
linear dependence of effective kernel radius with time, while the stable flames initially lag
of kernel sizes investigated with the kernel-vortex interactions. The average flame
propagation rates (Sb), measured from ignition until the flame reaches the image edge, ranged
from 105 to 115 cm/s for the “low” flame speed diluted mixtures and 219 to 230 cm/s for the
“high” speed mixtures.
Figures 2.7a and 2.7b show the effect of the spherical geometry on the propane flame for
both the slow and fast flame speeds respectively. Figure 2.7a shows the similarity in flame
propagation characteristics of the three stable flames, while the unstable flames display an
augmented propagation rate. Figure 2.7b shows the similarity of the three flames tested at the
fast flame speed. These flames exhibit stable characteristics and therefore show a reduction
in burning velocity, even though the = 1.32 result for the slow flame speed is considered an
unstable flame. As the Markstein number approaches zero with increasing equivalence ratio,
and subsequently passes it, the increased curvature and cellular structure of the undisturbed
flame causes an augmentation of the laminar burning velocity. The subsequent
normalization of the disturbed kernels by the undisturbed kernel effectively removes the
under-prediction and over-prediction prevalent in the pressure-derived burning velocity, as
seen in the following sections.
The following sections explore in detail the effect a vortex has on the spatial flame
propagation, with supporting results from the pressure-derived flame speed of the kernels
through a comparison to the undisturbed case. As an example, measurements of an
undisturbed = 0.64 methane flame kernel vortex, compared to the same flame kernel
interacting with different strength vortices, are shown in Fig. 2.8. The chemiluminescence
are barely discernable in the pressure traces. At later times, the pressure changes are
significant, with higher rates of pressure rise with increasing vortex strength. Comparison of
pressure measurements between 60 ms and 200 ms for methane and 30 ms and 100 ms for
propane are used to determine the relative average and maximum burning velocities for a
range of equivalence ratios, vortex strengths, and vortex- kernel interaction times. Methane
results are summarized in Table 2.1 and propane results can be found in Table 2.2.
2.3.2 Disturbed Flame Kernels: Methane
The first flame kernel-vortex interactions considered are identified as late interactions.
A late interaction is defined by the non-dimensionalized size of the flame kernel (kernel
diameter/ vortex diameter) being greater than two at the onset of interaction with the vortex.
The weakest vortex interactions proceed similarly to those shown in Xiong et al. [18]. A
typical interaction is shown in Figure 2.9 for a 0.90 flame. Examining the flame kernel
just after ignition, it is interesting to note that the flame sensitivity to heat loss to the
electrodes increases as the nitrogen dilution is increased. This thermo-diffusive effect results
in the flame developing slightly faster in the vertical direction, exhibiting an elongated shape
during the early stages of flame development. At the onset of interaction (after ~50 ms in
Fig. 2.9), the propagating vortex pushes the flame surface downward, reducing the local
flame curvature while simultaneously exerting positive strain: two opposing terms in the
determination of flame stretch. The weak vortex does not quench the leading edge of the
The first interaction of the strong vortex (U= 398 cm/s) and rich flame kernel ( = 1.13)
occurs at 40 ms after ignition and by 46 ms, the vortex leading edge is clearly extinguished as
shown in Figure 2.10. This indicates the positive stretch exerted on this thermo-diffusively
stable mixture exceeds the quenching stretch rate in this region. At approximately 50 ms
after ignition, the trailing edge of the burning vortex becomes wrinkled as a result of
instabilities responsible for vorticity shedding. The leading edge of the strong vortex has
enough momentum to push through the bottom of the expanding flame kernel by 55 ms. At
still later times (not shown), the vortex convects further, burning as a highly distorted flame
(significantly increasing the flame surface area) connected by a narrow neck to the original
flame kernel.
For all three equivalence ratios investigated (some cases not shown), the coherent
leading edge of the strong vortex appears to be able to locally quench the flame by 45 ms
after ignition. As the vortex propagates into the kernel and approaches the electrodes, the
trailing wake narrows, and the = 0.64 and 0.90 cases exhibit a higher degree of flame
wrinkling at the vortex trailing edge than the = 1.13 case. This observation is indicative of
increased thermo-diffusive stability as the equivalence ratio increases, consistent with an
increasing Markstein number (see Table 1.1). Re-ignition of the vortex fluids occurs in the
lower flame kernel hemisphere, with the = 1.13 flame being the slowest to respond. The
vortex is strong enough to punch through the lower flame kernel surface, with possible
mutual flame annihilation evident from the fragmented reaction zones visible in each case.
Final consumption of the remaining vortex core fluid occurs via multiple pocket formation
1.13) case has a second expanding flame kernel connected to the original kernel (Fig. 2.10,
last three frames).
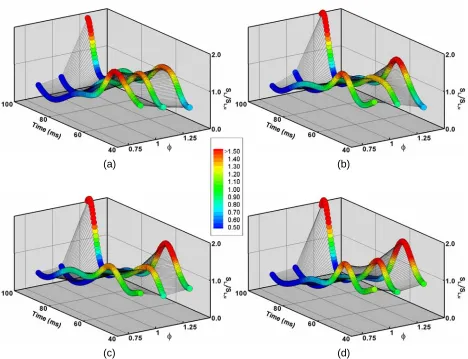
Pressure measurements quantify the longer term (> 70 ms) effects of the vortex on the
kernel. Late interactions with a weak vortex (in Figure 2.11a) show small effects on burning
velocity for all three equivalence ratios investigated. Late interactions with a strong vortex
(in Fig. 2.11b) show enhancement in both average and maximum normalized flame speeds,
with the largest enhancement for the leanest flames. The average and maximum normalized
flame speeds for the = 0.64, 0.90, and 1.13 cases are 1.16/1.32, 1.09/1.20 and 1.02/1.20
respectively.
Manipulating the experiment timing such that the vortex arrives sooner after spark
ignition maximizes the effect the vortex has on flame propagation. A typical weak vortex
interaction, which occurs soon after ignition (approx. 10 ms) when the flame kernel is still
small (~5 mm radius) as seen in Xiong et al. [18] is shown in Figure 2.12. The images in
Fig. 2.12 are also similar to direct numerical simulations of flame kernel vortex interactions
(e.g. Fig. 2 in [20]), even though the computations were for premixed H2 rather than
methane. In Fig. 2.12, as the weak vortex traverses the electrodes, the leading edge flame
dims for all three cases, but does not locally extinguish as in the late interactions discussed
earlier. During the separation of the trailing wake flame from the vortex flame, multiple
pockets are formed occur as seen in the = 0.64 mixture ( for times longer than 16 ms after
ignition) while the = 0.90 and = 1.13 cases exhibit a clean break between the two regions.
fuel-lean cases: another indicator of increased thermo-diffusive stability with increasing
equivalence ratio. During final vortex consumption (at 44.3 ms) near the bottom of the flame
kernel, the remaining momentum from the vortex is able to slightly dimple the kernel bottom.
This increases the reaction zone curvature and therefore generates marginally elevated stretch
rates, but the effects are not measurable in either the chemiluminescence signal intensity or
the effective kernel radius.
Early interactions with a strong vortex are shown in Figures 2.13 and 2.14 or lean ( =
0.64) and rich kernels, respectively, while the = 0.90 case is not shown because of its close
similarity to the = 0.64 case. In Fig. 2.13, the interaction begins at 9.0 ms after ignition.
The strong vortex is able to severely wrinkle the flame kernel, push through the flame kernel,
and induce local extinction at the kernel bottom (t = 19.7 ms). At 25.0 ms and later, the
vortex momentum facilitates strong downward flame propagation as the reaction zone
follows in the vortex wake. The wrinkling induced by the strong vortex is significant enough
to initiate a cellular structure in the = 0.64 flame surface, an indication that the reaction
zone has developed instabilities.
The = 1.13 case (Figure 2.14) is unique in that the strong vortex is able to globally
quench the flame kernel. Images in Fig. 2.14 are qualitatively similar to direct numerical
simulations of a vortex induced flame kernel quenching (e.g. Fig. 4 in [19]). In Fig. 2.14, by
11.6 ms, chemiluminescence from the flame boundary has diminished, and the kernel has
broken up into several flame fragments. Concurrently, the pressure results show no
noticeable deviation from barometric pressure for this case, therefore the majority of the
vortex support the notion of increased susceptibility to flame quenching with increased
dilution, especially for positively stretched, thermo-diffusively stable reaction zones [18].
Pressure measurements shown in Figs. 2.11c and 2.11d also indicate much stronger
effects on average and peak normalized flame speeds for the early vortex arrival. The = 0.64
and = 0.90 cases show strong enhancement of normalized flame speeds (by as much as
50% for the = 0.64 case). The = 1.13 with a weak vortex case has a reduction in
normalized flame speeds throughout the time recorded, while the strong vortex totally
extinguishes the flame kernel.
The effects of flame kernel interactions on flame speeds at short times after the
interaction are best quantified using changes in the slope of effective flame kernel radius vs.
time measured from the high speed chemiluminescence images (as shown in Figures 2.15
and 2.16). The slope is linear (i.e. constant flame speed) for the undisturbed lean methane
flame kernels (Fig. 2.15). Flame propagation is enhanced for the = 0.64 flame kernel
immediately after the kernel-vortex is observed in the chemiluminescence images. The
average flame burning velocity (based on effective kernel radius) is increased by a factor of
1.3 by the early interaction with a weak vortex. The effect becomes less pronounced as the
timing of the vortex arrival is delayed.
The effect of vortex strength is quantified in Figure 2.16a for = 0.64 and the early
interaction, resulting in a nearly 90% increase in the average flame speed (Sb) for the
strongest vortex. Not only is there a step change in kernel growth soon after the interaction
velocity due to flame wrinkling and an increase in effective flame area. Results for the =
0.90 kernels (not shown) are similar.
As expected from combustion theory including thermo-diffusive effects, rich ( = 1.13)
methane-air flame kernels and kernel-vortex interactions have quite a different behavior (as
summarized in Fig. 2.16b) when compared to lean methane-air flame kernels. The growth in
the undisturbed flame kernel is not linear. At early times when the kernel radius is small and
the curvature large, the effective burning velocity is reduced by the high stretch. Early vortex
interaction with the rich flame kernel further increases the local stretch and reduces the
relative burning velocity immediately following the initial kernel-vortex interaction. The
stronger the vortex, the stronger the effect on early flame kernel growth. For the strongest
vortex, the entire flame kernel is quickly extinguished. For the weak and medium vortices,
the relative burning velocities start to increase due to flame front wrinkling by the vortex
later in the interaction (20 – 60 ms after ignition in Fig. 2.16b). After 35 ms in the weak
vortex and 55 ms in the strong vortex cases, the effective kernel radius has increased due to
interactions with the vortex (even though the initial vortex had a negative effect).
Because the flames grow too large to be in the field of view for the chemiluminescence
imaging, at significantly long times after the interaction, the effects of flame kernel
interactions on burning velocities are best quantified by chamber pressure measurements
(summarized in Table 2.1). As just described, the early interaction with the strongest vortex
causes kernel extinction for the rich flame kernel due to excessive stretch effects. For all
other cases studied, the average normalized reactant consumption rates at these late times are
kernels and due to flame front wrinkling for all nonextinction cases. The amount of
enhancement is largest for early vortex interactions (the smallest flame kernels), for lean vs.
rich flame kernels, and for strong vs. weak vortex strengths.
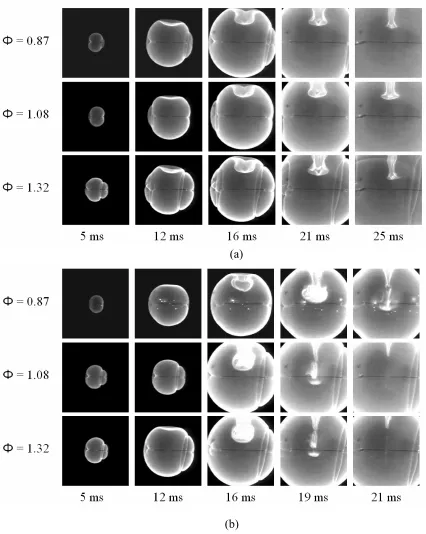
2.3.3 Disturbed Flame Kernels: “Slow” Propane
The first flame kernel-vortex interactions discussed for these mixtures at the slow flame
propagation rate are late interactions with the weak vortex. Figure 2.17 shows
chemiluminescence images for each equivalence ratio at certain times during the interaction.
As the vortex first interacts with the kernel for all cases, the flame is strong enough to
actually push the imposing vortex upwards, reversing the propagation direction (in laboratory
coordinates), until the vortex moves into the kernel and resumes its downward travel. As the
vortex bubble is formed within the kernel (at 41 ms), the laminar reaction zone is observed to
be well-defined around the vortex and connects to the outer kernel surface via the trailing
wake. As the vortex continues to propagate, the trailing wake of the = 1.32 and = 1.49
cases develops a complex structure due to wrinkling, while the stable cases exhibit
symmetric wake flames. As the wake flame detaches and vortex consumption occurs, the =
0.69, 0.87, 1.08 cases show a well-defined reaction zone around both the trailing wake and
remaining vortex reactants, which are completely consumed just above the electrodes. In
comparison, for the = 1.32 and = 1.49 cases, both the vortex and wake reaction zones
become diffuse during the final stages of the interaction, and the chemiluminescence signal
gradually fades away with no distinct flame boundary between reactant and products. This
zone regime since reactants and products could co-exist. From Figure 2.18a, it is observed
that the flames exhibit burning velocity characteristics similar to the undisturbed kernels,
indicating the minimal effect of the weak vortex on the overall growth of the well established
flame kernels. The only mixture with an appreciable increase in flame propagation was =
1.49, with the average burning velocity increasing by 24%.
Presented next is the investigation into the effect of the strong vortex on late propane
kernel-vortex interactions. Although not shown, contrary to the late interactions with the
weak vortex, the strong vortex exhibits little or no attenuation as its leading edge interacts
with the expanding flame kernel. Similar to the weak vortex interaction however, for =
1.49 it appears that stretch-induced intensification occurs at the connecting region between
the vortex trailing edge and the outer flame kernel. Of course, this elevated intensity may be
due to wrinkling or area generation. Continued propagation of the vortex into the kernel
leads to the generation of a turbulent wake flame, especially for the thermo-diffusively
unstable cases ( = 1.32 and = 1.49) which show a very wide and intense wake reaction
zone. As the vortex traverses the electrodes, the thermo-diffusively stable cases undergo
quenching along the vortex flame, leaving a vigorous reaction zone along the trailing edge,
and then re-igniting below the electrodes. For the = 1.32 mixture, no quenching occurs, but
heat losses incur a less defined reaction zone that is less intense but deformed due to flow
disturbance from the electrodes. The vortex leading edge reaction zone for the = 1.49 case
only locally loses intensity at the electrodes before becoming very intense as turbulent
trailing edge combustion consumes the vortex. The normalized flame burning velocity,