DYNAMICS OF SHAPE OSCILLATIONS OF A BUBBLE ATTACHED
TO A CAPILLARY TIP
Lucie VOBECKÁ1, Jiri VEJRAZKA, Sandra ORVALHO, Mária ZEDNÍKOVA, Jaroslav TIHON
Abstract: The shape oscillations of a bubble, which is attached to a tip of a capillary tube, are studied experimentally. It is observed that the attachment leads to an appearance of an additional low-frequency mode (denoted as mode 1), when compared to standard theories of oscillations of free bubbles or drops (e.g., Miller & Scriven, 1968). It is observed that the frequency of mode 1 scales with the bubble size as f ~ D-2. The oscillation dynamics of a bubble is strongly influenced if some surface active agent is present in the liquid. Due to interfacial elasticity, the surfactants presence in low concentration increases the oscillation frequency. The decay of oscillations is also faster, probably due to an increase of energy dissipation by Marangoni stresses.
1. I
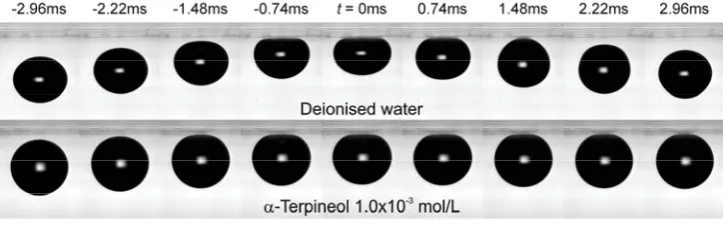
NTRODUCTIONA presence of surface active agents (surfactants) can strongly modify the dynamics of multiphase systems. The impact of a bubble on a horizontal solid in aqueous solution of surfactants was recently studied (Malysa et al., 2005 and Fujasová-Zedníková et al., 2010). It was found that after an addition of small amount of surfactants, the bubble rebound from horizontal wall is completely suppressed. The difference between the bubbles colliding in the pure water and in the aqueous terpineol solution is shown in the Figure 1.
Figure 1: The impact of a 1 mm bubble in pure water and in aqueous terpineol solution.
More detailed analysis suggests that the rebound suppression is linked with deformation of an interface. Interface deformations seem to dissipate energy much faster, if the interface is occupied by surfactants. To verify this hypothesis, we study bubble oscillations in the surfactant solution. During a period of bubble oscillation, the deformation has similar character as during the rebound. The energy dissipation is studied more easily from the decay of oscillations.
1
Institute of Chemical Process Fundamentals, Academy of Science sof the Czech Republic, Rozvojová 135, 165 02 Praha 6, Czech Republic, e-mail: [email protected]
2. E
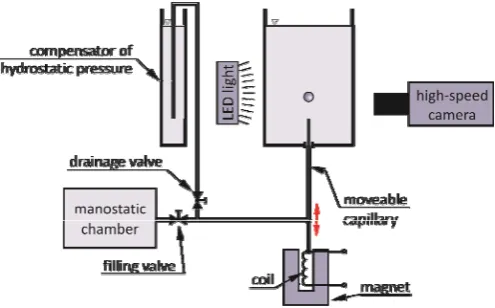
XPERIMENT AND EVALUATION OF BUBBLE OSCILLATIONSThe bubble oscillations are studied in an experimental setup, which is schematized in Figure 2. The setup consists of a rectangular glass vessel. A bubble grows slowly on a moveable glass capillary and its size is controlled by proper timing of filling and drainage valves. Bubble oscillations are enforced by a vertical motion of the capillary, which is attached to an electromagnetic coil (Vejrazka, 2008). The working liquids are pure water and aqueous solutions of a surfactant -terpineol of different concentrations.
Figure 2: Experimental setup
Figure 3: Typical sequence of image of a bubble oscillating at the capillary
The bubble oscillations are recorded by a high speed camera and a typical sequence is shown in Figure 3. By digital processing of images, the bubble boundary is found and its shape is expressed as a function
r
(
T
,
t
)
(seeFigure4). We decompose this shape in)
(cos
)
(
)
,
(
0
T
T
¦
Nk k k
P
t
A
t
r
(1)central point is chosen in the way that A1=0; the bubble position is then given by the
position of central point zcp. Set of A2 to AN describes the bubble shape; typically N ranging from 8 to 15 is used and the bubble shape is then reproduced with deviation smaller than 0.3 pix.
Figure 4: Description of bubble shape
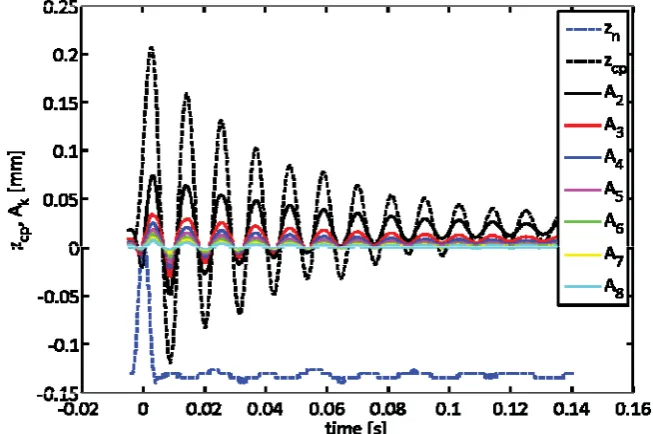
We carry out two different kinds of the experiments. In the first kind of experiments (called impulse-response experiment), we deform the bubble by a sudden motion of the capillary, on which the bubble grows. Figure 5 shows the typical evolution of bubble shape. We can study the evolution of shape by looking on the evolution of Ak coefficients, which are damped sinusoids. Both a frequency and a characteristic damping time of oscillations are easily evaluated from it. In the second kind of experiments (
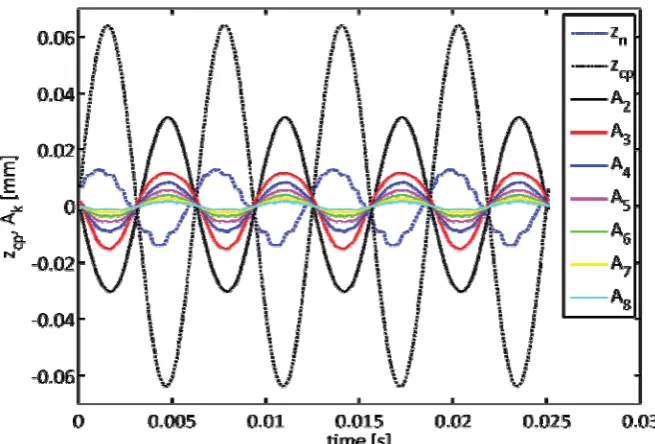
frequency-scan experiment), the capillary moves sinusoidally and steady-state oscillations are observed (Figure 6); this kind of experiments is repeated for many different frequencies. The dependence of zcp and Ak amplitudes on the forcing frequency is studied and it allows an identification of eigen-frequencies an eigen-modes of attached bubble.
Figure 6: Evolution of capillary position (zn), position of bubble central point (zcp) and Ak coefficients in a typical frequency-scan experiment
3. R
ESULTS AND DISCUSSION3.A Bubble oscillations in pure water
3.A.1 Frequency-scan experiment in pure water
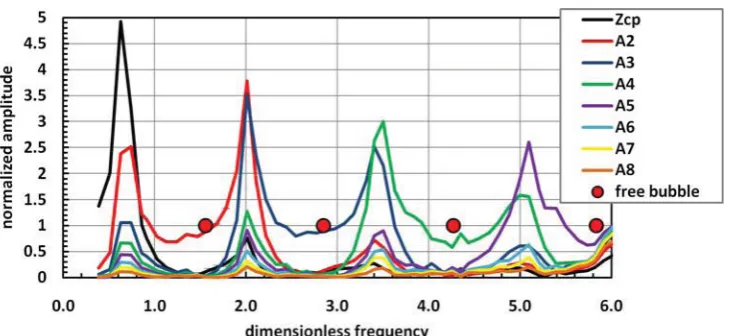
Figure 7 shows the dependence of amplitude of zcp and Ak, normalized by the amplitude of capillary motion zn, on the frequency. The dimensionless frequency is obtained by the normalization by
(2)
We observe that the amplitudes zcp, A2, A3, … are dependent on the frequency. The peaks occur at the resonance frequencies, which identify the eigen-frequencies of bubble oscillations. We can also see that the resonance frequencies do not agree with the frequencies predicted by Rayleigh-Lamb theory (Lamb, 1945), which is valid only for free bubbles.
3
D
U
Figure 7: Dependence of normalized amplitude on the dimensionless frequency
3.A.2 Impulse-response experiment in pure water
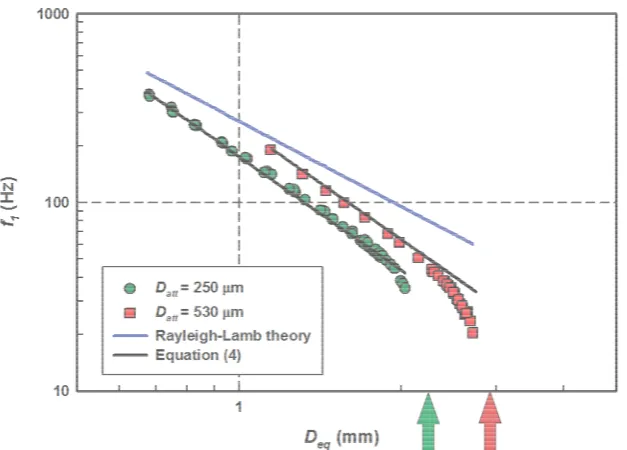
Figure 8 shows the dependence of frequency f1 of mode 1 for attached bubble on the
bubble size in pure water. The frequency was measured in the impulse-response experiment, which excited essentially mode 1 of oscillations. For comparison, the frequency predicted by the theory of Rayleigh and Lamb for free (unattached) bubbles is also shown. The frequency of mode 1 is considerably lower. It decrease as f1 ~ D-2,
instead of standard scaling f ~ D-3/2. The frequency depends also on the capillary diameter, as we can see by comparing the data for 250 and 530 m capillaries. The dependence on capillary diameter suggests that the diameter of the bubble attachment significantly influences the frequency. The dimensional analysis indicates that the frequency should be expressed in form
3
1
D
D
D
F
f
attU
V
¸
¹
·
¨
©
§
(3)Empirically, we observe that for smaller bubble sizes
3
1
1
.
3
D
D
D
f
attU
V
|
(4)The reason for f1 ~ D-2 scaling is in the change of geometry: for the given capillary
Figure 8: Oscillation frequency of attached bubble in pure water
Figure 9 shows the dependence of damping time 1 of mode 1 on the bubble size for two different capillary diameters. In the range of medium bubble sizes, the damping time does not depend significantly on the attachment size. Standard viscous scaling is observed (W ~ D2). The data are reasonably fit with
(5)
Figure 9: Damping time of attached bubble in pure water
P
3. B Bubble oscillations in surfactant solutions
3.B.1 Impulse-response experiment in surfactant solutions
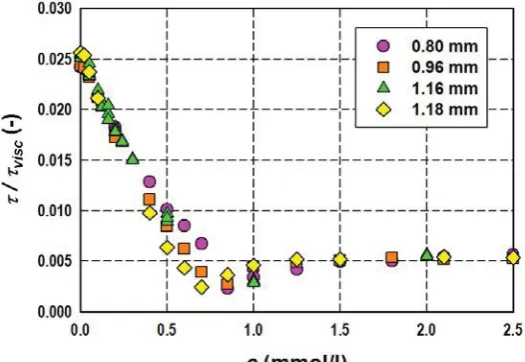
The damping time of oscillations is strongly affected by a presence of surfactants. Figure 10 shows the dimensionless damping as a function of concentration for a few bubble sizes. The damping time is normalized by viscous time
(6)
Initially, the damping time decreases almost linearly with concentration, then it passes through a minimum occurring at concentration of about 0.8 mmol/l and finally it slightly increases again.
Figure 10: Damping time of attached bubble in surfactant solutions
It is interesting to examine also on the oscillation frequency. The frequency dependence on surfactant is shown in Figure 11. The frequency is normalized by
3
D
D
D
f
att purechar
U
V
(7)
In pure systems, the decrease of surface tension leads to a decrease of oscillation frequency. It is observed that the frequency initially increases, although the addition of surfactant decreases the surface tension. This frequency increase is perhaps due to an elasticity of interface with adsorbed surfactant. There is a sudden drop of the frequency which occurs at the same concentration as the minimum of damping time. We do not have definite explanation for this frequency drop.
Figure 11: Oscillation frequency of attached bubble in surfactant solutions
3.B.2 Frequency-scan experiment in surfactant solutions
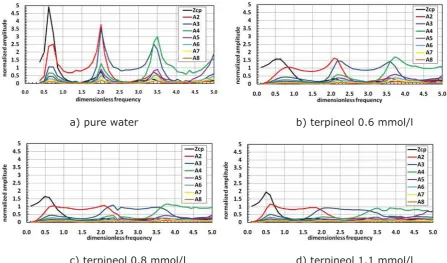
Figure 12 shows, how the results of the frequency-scan experiment, analogous to Figure 7, are affected by the surfactants, which are gradually added to the solution. It is seen that normalized amplitude of mode 1 initially decreases with the addition of surfactant and then increases again. It is in agreement with previous experiments. Higher modes, however, do not appear again at high concentration of the surfactants. We performed the frequency-scan experiments also at an even higher concentration (2mmol/l), but no change compared to Figure 12d) is observed.
a) pure water b) terpineol 0.6 mmol/l
c) terpineol 0.8 mmol/l d) terpineol 1.1 mmol/l
4. S
UMMARYThe bubble oscillations of a bubble attached to a capillary tip are studied in both, pure water and surfactant solutions. Frequency-scan experiments identified eigen-frequencies and eigen-modes; they considerably differ from the case of free bubble. Surfactants have strong effect on oscillations. They are damping all eigen-modes. At high concentrations, shape oscillations only at a single low frequency mode are observed.
A
CKNOWLEDGEMENT
Support of this research by the Grant Agency of the Academy of Sciences (GAAV) through project no. IAA 200720801 is acknowledged. Some equipment, used in this study, was acquired in the past for the projects GAAV KJB 200720801 and GACR 104/07/1110.
R
EFERENCES[1] Fujasová-Zedniková M., Vobecká L., Vejrazka J.: Effect of solid material and surfactant presence on interactions of bubbles with horizontal solid surface. The Canadian Journal of Chemical Engineering 88 (2010), 473-481.
[2] Lamb H.: Hydrodynamics. Dover, 1945.
[3]Malysa K., Krasowska M., Krzan M.: Influence of surface active substances on bubble motion and collision with various interfaces. Adv. Coll. Interface Sci., 114 (2005), 205-225
[4] Miller C. A., Scriven L. E.: Oscillations of a fluid droplet immersed in another fluid. Journal of Fluid Mechanics 32 (1968), 417-435.