University of South Carolina
Scholar Commons
Theses and Dissertations
2016
How Technology Supported Teacher Behaviors
Impact Student Outcomes: Results from a 1:1
Computing Initiative
James Siddall
University of South Carolina
Follow this and additional works at:https://scholarcommons.sc.edu/etd
Part of theSchool Psychology Commons
This Open Access Dissertation is brought to you by Scholar Commons. It has been accepted for inclusion in Theses and Dissertations by an authorized administrator of Scholar Commons. For more information, please [email protected].
Recommended Citation
How Technology Supported Teacher Behaviors Impact Student Outcomes: Results from a 1:1 Computing Initiative
by James Siddall Bachelor of Arts
Washington University in St. Louis, 2011 Master of Arts
University of South Carolina, 2013
Submitted in Partial Fulfillment of the Requirements For the Degree of Doctor of Philosophy in
School Psychology College of Arts and Sciences University of South Carolina
2016 Accepted by:
Abraham Wandersman, Major Professor Kimberly H. Hills, Committee Member
Mark Weist, Committee Member Robert Johnson, Committee Member
DEDICATION
ACKNOWLEDGEMENTS
ABSTRACT
As computing technology has advanced over the last several decades, many schools and school districts have embraced the use of this technology in education. One way in which schools and school districts have adopted computing technology is through adopting 1:1 computer initiatives where each student is provided with a computing device. However, despite the widespread and continuously expanding use of 1:1
computer initiatives within the educational setting, surprisingly little is known about the classroom-level factors that may impact student educational outcomes. Only one study to date (Shapley et al., 2010) has attempted to investigate specific classroom-level factors that may impact student outcomes within a 1:1 initiative. Therefore, the current study examined the impact of specific, technology-supported teaching strategies (personalized learning, authentic learning, and computer-supported collaborative learning) on students’ school satisfaction, academic outcomes, and 21st century skills. The study was conducted on a dataset consisting of approximately 8, 047 students and 517 teachers in grades 3-8 from a Southeastern school district that implemented a 1:1 technology initiative. The students surveyed provided information about their overall school satisfaction as well as their perceptions of their teachers’ use of the personalized, authentic, and
computer-supported collaborative teaching strategies and overall levels of computer use in the classroom. The teachers also supplied their perceptions of their own use of these
learning skills. In order to examine the potential for school-wide impacts on student outcomes, models were run with school-level variables that included school-wide levels of students’ perceptions of teachers’ use of technology-supported teaching strategies,
school-wide levels of teachers’ perceptions of their own use of these strategies, as well as school-wide measures of 1:1 implementation quality. Study 1 examined the impact of the technology-supported teaching strategies mentioned above on students’ school
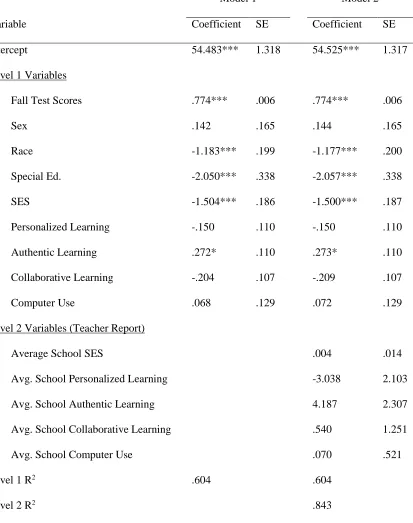
engagement and academic outcomes. Multi-level analyses revealed that students’ perceptions of their teachers’ use of personalized and authentic learning strategies had a
significant, positive relationship with students’ school engagement. Results also indicated that students’ perceptions of their teachers’ use of authentic learning strategies was
significantly positively related to greater gains in English/Language Arts as well as Mathematics achievement scores. In addition to students’ perceptions of their own teachers’ use of authentic learning strategies in the classroom, it was also found that
schools with higher overall levels of this perception also had greater gains in
Mathematics achievement scores. Higher levels of computer use in the classroom were also found to be positively related to gains in students Mathematics achievement scores. In addition, it was found that school-wide levels of quality professional development were also associated with greater gains in students’ Mathematics achievement scores.
However, results also revealed that greater use of computer-supported collaborative learning strategies was associated with lower levels of school satisfaction and weaker gains in Mathematics achievement scores. Study 2 examined the relationship of students’ perceptions of their teachers’ use of technology-supported teaching strategies on
teachers’ use of computer-supported collaborative learning strategies was consistently
TABLE OF CONTENTS
DEDICATION ... iii
ACKNOWLEDGEMENTS ... iv
ABSTRACT ...v
LIST OF TABLES ...x
CHAPTER 1: INTRODUCTION ...1
1.1 SMALL-SCALE TECHNOLOGY STUDIES ...5
1.2 RESEARCH ON 1:1 INITIATIVES ...7
1.3 TECHNOLOGY-SUPPORTED TEACHING STRATEGIES ...15
1.4 STUDENT ENGAGEMENT ...22
1.5 21ST CENTURY LEARNING SKILLS ...24
1.6 STUDIES ON 1:1 INITIATIVES ...32
1.7 THE CURRENT STUDY...36
CHAPTER 2: METHODS ...41
2.1 DATA COLLECTION...41
2.2 DATA ANALYSIS ...56
CHAPTER 3: RESULTS ...65
3.1 STUDY 1: EXAMINING SCHOOL SATISFACTION AND ACADEMIC OUTCOMES ...65
3.2 STUDY 2: EXAMINING 21ST CENTURY LEARNING OUTCOMES ...92
LIST OF TABLES
Table 2.1 Sample Demographic Statistics. ...43
Table 2.1 Sample Descriptive Statistics...66
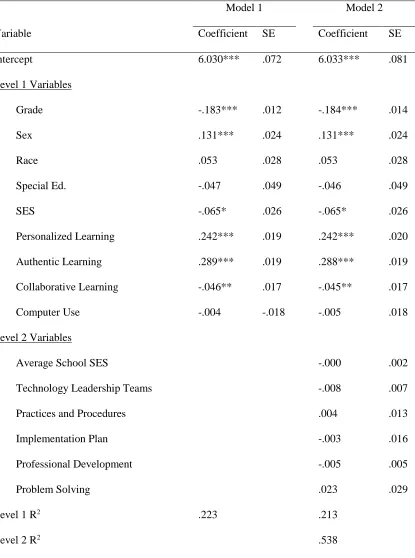
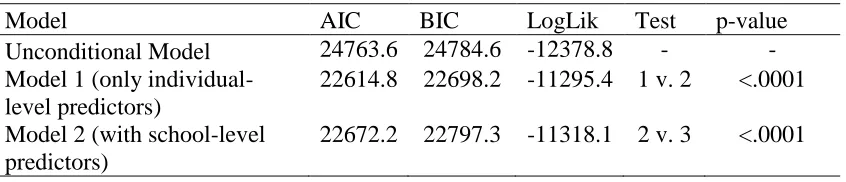
Table 3.2 School Satisfaction Analyses (Student Report) ...67
Table 3.3 School Satisfaction Models (Student Report) ...70
Table 3.4 School Satisfaction Analyses (Teacher Report) ...71
Table 3.5 School Satisfaction Models (Teacher Report) ...73
Table 3.6 School Satisfaction Analyses (QIT Domains) ...74
Table 3.7 School Satisfaction Models (QIT Domains) ...75
Table 3.8 ELA Score Analyses (Student Report) ...77
Table 3.9 ELA Score Models (Student Report) ...79
Table 3.10 ELA Score Analyses (Teacher Report) ...80
Table 3.11 ELA Score Models (Teacher Report) ...82
Table 3.12 ELA Score Analyses (QIT Domains) ...83
Table 3.13 ELA Score Models (QIT Domains) ...85
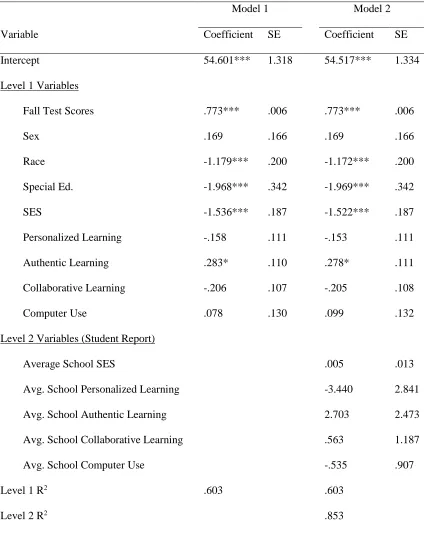
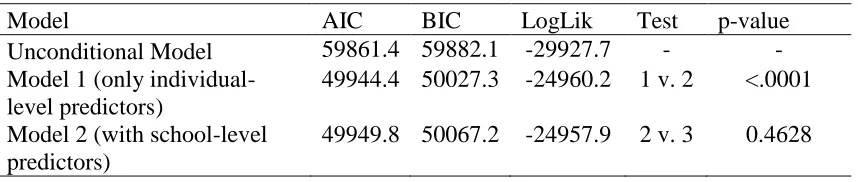
Table 3.14 Math Score Analyses (Student Report) ...86
Table 3.15 Math Score Models (Student Report) ...89
Table 3.16 Math Score Analyses (Teacher Report) ...90
Table 3.17 Math Score Models (Teacher Report) ...91
Table 3.18 Math Score Analyses (QIT Domains) ...93
Table 3.20 21CSA Descriptive Statistics- Elementary School ...96
Table 3.21 21CSA Descriptive Statistics- Middle School ...97
Table 3.22 21st Century Elementary School Analyses ...98
CHAPTER
1
INTRODUCTION
The last decade has seen an increased proliferation in the use of computer technology in education. Ever since the 1980s, the positive effects of computer technology use in education have been documented in several formal and informal research studies examining its impact on such wide-ranging outcomes as cognitive abilities, academic achievement, engagement, and numerous others (O’Dwyer et al.,
2008). Despite the increasing use of technology in education, many questions posed over a decade and a half ago still remain, especially in regards to student achievement. In a 1999 U.S. Department of Education conference (as recounted by McNabb, Hawkes, and Rouk, 1999, p.1), it was reported that “Parents and teachers, school boards and
administrators, governors and state legislatures, and Congress all want to know if the nation’s investment in technology is providing a return in student achievement. Indeed, if resources are to be expended on technology, it is becoming a political, economic, and public policy necessity to demonstrate its vital effectiveness”. The need for more
information regarding the impact of technology use and technology initiatives continues to be a necessity as an increasing number of schools, districts, and states continue to move toward significantly increasing their use of technology in the classroom.
and possibly improve educational outcomes. Since one of the most widely known 1:1 computer initiatives began in Maine in 2001, many such initiatives have sprung up across the United States in states such as Georgia, Florida, Maine, Massachusetts, Michigan, Missouri, New Hampshire, Pennsylvania, South Carolina, and South Dakota as well as in several foreign countries, including Spain, Portugal, Germany, Italy, Turkey, and the UK (Holcomb, 2009; Fleischer, 2012). However, although these initiatives are becoming increasingly widespread, studies have yet to show the robust, positive outcomes that many 1:1 proponents have hoped for.
from one-to-one computing projects may also be lacking. The reasons for unsuccessful implementation projects remain, as of yet, largely unanswered” (p. 3).
In a rebuttal to Cuban and other critics, Weston and Bain (2010) assert that a major reason many have failed to see their expected gains is because of their inability to see the computers as a tool and instead have chosen to see the use of computers as an innovation in itself. They contend that the relative popularity of these initiatives is actually an opportunity waiting to be seized- that these initiatives can possibly be leveraged to change teaching and learning at a scale that many other innovations have failed to achieve. They make the comparison to other technologies used in other professions, such as an arthroscope used by a surgeon or computer-assisted design software being used by an engineer. These technologies have been able to revolutionize the process through which these professionals do their jobs, but they are used as a means to an end, rather than seen as an end in themselves where individuals are handed the devices and asked to create possible uses for them. This is where they see the biggest problem with 1:1 computing initiatives- that no paradigm yet exists within the
educational sphere or 1:1 computing models that comprehensively demonstrates how the computers should be used to enhance educational outcomes. Instead, the computers are often used as replacements- physical books replaced by e-books, chalkboards replaced with Smart boards, etc. They believe educators should follow the lead of other
professions and let the form and function of usage drive access, not expect it to work the other way around.
have either examined the potential impact of very specific computer-based interventions or simply tried to compare the outcomes of students in 1:1 initiatives to students not in these initiatives. As can be seen in Weston and Bain’s (2010) critique, both of these
approaches are inadequate if we are to understand how we can use technology in order to improve student outcomes. While the results thus far have generally shown modest improvements in student outcomes associated with increased computer access and use, much more research is required in order to find and illuminate the mechanisms that can lead to ever more substantial changes.
The following pages will summarize some of the research to date from both the narrow perspective of individual interventions as well as the broad approach of
examining the impact of technology access and use on student outcomes. After these outcomes are covered, this paper will describe the research surrounding some potential technology- supported teaching strategies that may have promise as possible mechanisms to promote positive changes in student outcomes within a 1:1 initiative. However, as will be discussed later on, we cannot simply expect that changes in teaching strategies will directly impact student academic outcomes. One way to examine the impact of these practices is to examine the potential for them to impact student engagement and therefore the literature surrounding students’ school engagement, specifically their school
satisfaction, will be discussed. Following that discussion will be a discussion of 21st century skills and how we may possibly use them to better understand the potential impact of increased technology use on students’ real-world skills in addition to their
1.1 Small-Scale Technology Studies
As mentioned above, one method investigators have used to examine the potential role of computer technology in education has been to examine the impact of computer-based interventions on various student-level outcomes. A major limitation of this approach has been that a large majority of these studies have employed very small, non-representative samples and that the classrooms usually receive an extremely high level of support not commonly found in most schools. In addition, many of these studies used tools developed by the researchers in order to measure academic achievement and therefore their outcome measures have not undergone rigorous validation. One example of this is a study by Ramirez and Althouse (1995) where they developed and evaluated a project that employed ArcView software to help students examine several environmental issues. The teachers in the intervention received extensive training from the research team on the software and collaborated with the researchers to develop a two-semester curriculum that utilized its capabilities. The study then examined how the software was used in the curriculum and how it helped students develop an understanding of
given to classrooms that would try to implement such an intervention at scale and that they represent very small sample sizes, which significantly limits their generalizability.
In order to examine the potential impact of technology-based interventions on learning, several research teams have conducted recent meta-analyses in order to
determine the overall impact of technology-based interventions on a variety of outcomes. Early meta-analyses suggested that specific uses of technology generally demonstrated positive impacts on student achievement (Kulik, 1994; Goldberg, Russell, & Cook, 2003; Fletcher-Flinn & Gravat, 1995; Waxman, Lin, & Michko, 2003). However, several authors found the lack of quality in the early studies regarding the topic to be a serious problem. For instance, Waxman, Lin, and Michko (2003) found that of the 200
educational technology studies they found between 1997 and 2003, only 42 were able to meet their standards for inclusion. Of these, only 25% were categorized as randomized experimental designs, while another 67% were categorized as quasi-experimental designs. The authors also reported that what constituted “technology” and “student achievement” varied widely- possibly leading to confusion over what the outcomes truly
represent.
More recent work has also been done in this area and several recent meta-analyses have also examined the impacts of teaching and of learning with technology on
mathematics achievement (Li & Ma, 2010), reading achievement (Moran et al., 2008) as well as cognitive and affective outcomes (Lee et al., 2013). In Li and Ma’s (2010)
analysis of mathematics achievement, they found that the effect of technology on
students’ achievement was greater at the elementary than at the secondary levels and that
et al. (2008) found that the use of digital tools to enhance literacy acquisition in middle school students resulted in a significantly positive effect on reading comprehension. Lee et al’s (2013) comprehensive meta-analysis of 58 studies found that cognitive outcomes
were significantly improved when students collaborated in small groups or pairs and when technology was used for either basic skills, factual learning, or project-based learning. They concluded that for the affective domain, students had the greatest outcomes when teachers included challenging activities and engaged in instructional conversation and when students engaged in collaboration.
1.2 Research on 1:1 Initiatives
Presumably in response to both the positive learning outcomes demonstrated early on by researchers using specific technology-based interventions and the cultural
recognition of the importance of technology in the workplace, many schools and school districts began implementing 1:1 computing programs that aimed to put one laptop in the hands of every child as a way to boost academic achievement. Research into the use and effectiveness of 1:1 initiatives continues to grow and has done a great deal in illuminating both how laptops are used in schools with 1:1 initiatives and the various outcomes
associated with them.
every day for at least an hour per day. However, a study by Grimes and Warschauer (2008) found wide variability across schools in the extent to which the computers had been integrated in the curriculum. They reported that 36% of the teachers in one school reported using the computers for less than an hour per week compared to 78% of teachers at another school. There were also large differences across subjects in terms of how often the computers were used. For instance, the study by Grimes and Warschauer (2008) found that the computers were used the least frequently in mathematics whereas a study by Zucker and Hug (2008) reported greater use among math teachers- especially for doing daily drills with students. From this data, Fleischer (2012) concluded that there does not seem to be any individual topic better suited for laptop usage than another, but that usage will be dependent upon the creativity and the adoption of values and beliefs allowing for curriculum change that will largely determine the extent to which laptops will be used in the classrooms.
Fleischer’s (2012) review also examined the ways in which laptops were
2007; Grimes and Warschauer, 2008; Oliver & Corn, 2008). Students were also able to use their laptops to engage in greater communication through email, discussion forums, and messenger applications and were able to use their laptops to organize their work (Dunleavy et al., 2007; Lei & Zhao, 2008). Overall, Fleischer (2012) found that the most common uses of laptops were to write and give presentations, complete information searches, and communicate electronically. In reporting on these uses, Fleischer (2012) comments that all of the studies showed either directly or indirectly that students in these initiatives had increased their technology-related skills through the daily use of
computers in their classrooms.
In addition to examining how laptops are used within the context of 1:1 initiatives, the impacts of these programs on student outcomes have additionally been examined from several different angles, ranging from impacts on students’ attitudes and
learning and that 80% reported that laptops increased their editing and self-correcting of their own work. Lowther et al. (2005) reported that over 60% of students in their sample stated that the use of their laptops increased their interest in learning and a large majority reported they were glad they were using laptops and wanted to use them again the
following year. A study by Keengwe, Schnellert, and Mills (2012) found that 62.5% of students in their sample expressed that they were more motivated to do schoolwork when they used a laptop. Additionally, they found that 69% of the faculty surveyed reported improved student motivation and 77% reported improved engagement and interest level. In Alabama, the Auburn Laptop Initiative reported finding increased student engagement as well as an increase in inquiry-based learning (Intel Inc., 2008). Finally, another study in Massachusetts found that teachers overwhelmingly reported improvements in their students’ engagement and motivation as a result of their 1:1 initiative with 83% of
teachers feeling that engagement had improved for their traditional students, 84% reporting that engagement had improved for their at-risk/low achieving students, and 71% reporting that engagement had improved for their high achieving students (Bebell & Kay, 2010).
Several evaluations and studies of 1:1 laptop initiatives have additionally examined the impacts on students’ academic achievement with the most common areas
collected by Gulek and Demirtas (2005) demonstrated positive gains in reading
achievement for students in their laptop program with the caveat that these results varied based on the assessment given as well as the cohort of the students. Another study, conducted by Sclater et al. (2006) found that secondary students who participated in their laptop program had significantly higher scores on their standardized achievement tests and that these increased scores seemed to correlate with increased laptop use in the students’ English classes. Once again, however, the authors warned that these results
should be interpreted with caution, as there were several threats to the validity of their conclusions, including selection bias. In a study conducted by Bebell and Kay (2010), they found that although students in their laptop program did not score higher overall than students not participating in the program, cross-sectional analyses revealed a statistically significant (although fairly weak) correlational relationship between the amount of technology use in the classroom and students scores on their state
English/Language Arts (ELA) assessment. Another study conducted by Shapley et al. (2010) found that student access and use of laptops was significantly and positively related to students reading achievement scores on Texas’ standardized reading
assessment for all 3 cohorts examined.
schools/districts use the laptops to give students access to online, personalized curricula that directly improve their reading abilities, but that simply introducing the devices does not necessarily change reading instruction. As reading is critical within the educational setting, much more work needs to be conducted in order to gain a better sense of how 1:1 initiatives impact reading achievement across all grade levels.
Although few studies have examined the relationship between 1:1 initiatives and reading, much more work has been done on their impact on writing achievement. One reason for this is that the introduction of laptops (and therefore the use of word
processing programs) often fundamentally shifts the writing process for students. As Holcomb (2009) notes, the introduction of laptop computers allowed students in her study to spend more time editing and reflecting on their writing rather than having students turn in their first, handwritten draft. A study conducted in Canada by Jeroski (2003) found extremely positive results when students and teachers were given 1:1 laptop access in addition to focused professional development aimed at improving students’ writing abilities. They found that between their pre-test and post-test, the number of students who scored at the proficient level rose 22% (from 70% to 92%). Additionally, a study conducted by Lowther, Ross, and Morrison (2003) found a significant
significant impact of computer use on students’ writing achievement such that the effect
size between students who reported not using their laptops during the writing process and those who used the laptops for all phases of the writing process was .64. This indicates that the average score for a student who used a laptop for writing was better than approximately 75% of those students who did not use the laptop for writing. Further analyses conducted by Silvernail and Gritter (2007) found that students’ scores in writing improved regardless of whether the MEA was administered electronically or with paper and pencil, indicating that the laptops helped students become better writers in general and not just better when using their laptops. In addition to these reports, a study
conducted by Zheng, Warschauer, and Farkas (2013) found significant writing test score gains in a California district implementing a 1:1 laptop program, while finding no significant increase in writing test score gains for a similar initiative in a Colorado district. However, they did note that across all districts, at-risk student groups did show significant gains and also used the laptops with greater frequency and for a wider variety of purposes.
Investigations of the impact of 1:1 initiatives on mathematics achievement have generally found smaller and more inconsistent effects than those found for writing. One significant explanation for this (as noted by Holcomb (2009)) is that evaluators
students on the state standardized test for math (Muir, 2005; Stevenson, 1998).
Evaluations of the Enhancing Missouri’s Instructional Networked Teaching Strategies (eMINTS) program found that participating students significantly outscored their non-participating peers in both the 2002-2003 school year and again in the 2005 school year (eMINTS National Center, 2004; eMINTS National Center, 2007). A study conducted in Texas by Shapley et al. (2010) also found that students’ access and use of computing
devices had a significant, positive relationship with their state standardized math scores. In Bebell and Kay’s (2010) study of students in Massachusetts, they found that student use of laptops in class was significantly related to students’ scores on a state standardized
test in math. Interestingly, they found that the overall level of student computer use in the classroom over the past year, students’ computer use in Reading/ELA, and students’ computer use in Science were all significantly, positively correlated with students’ math scores, but that students’ use of computers in math class was not. This may indicate that use of the computer in class aided students’ math scores on a state standardized math
assessment through a more indirect process than simply using them in math class to understand math concepts.
However, not all studies of mathematics achievement in 1:1 laptop initiatives have found positive results. A study conducted by Gulek and Demirtas (2005) did not find significant evidence of laptop students performing better on state standardized math assessments than their non-laptop peers. Another study conducted by O’Dwyer et al. (2008) in Massachusetts examining 4th grade students’ scores on the state standardized math assessment did not find any significant impact of students’ technology use on
be useful instructional tools for the teaching of mathematics, many districts implementing 1:1 initiatives are likely not providing their teachers with the types of support needed to enhance mathematics instruction through the use of laptop computers.
1.3 Technology-Supported Teaching Strategies
Many researchers and educational theorists have noted that technology has the potential to significantly change the way that teachers teach and students learn
(Roschelle, Penuel, & Abramson, 2004; Storz, Hoffman, & Carroll year). There is no shortage of articles from various researchers and theorists that posit how shifts in
definitions of these strategies, the sections below highlight the definitions of these strategies as they were used for the current study.
Personalization of Learning. Patrick et al.’s (2013) working definition of
personalized learning states “Personalized learning is tailoring learning for each student’s strengths, needs and interests — including enabling student voice and choice in what, how, when and where they learn — to provide flexibility and supports to ensure mastery of the highest standards possible” (p. 4). The idea of personalizing students’ educational experiences in order for them to receive the greatest benefit possible is not a particularly new idea, however it has been given renewed interest as technology has been able to make providing such individualized instruction more manageable and practical. Another name for personalized learning that has been widely used in the educational literature is “differentiated instruction”. As explained by Hall (2002), the theoretical basis for
having students interact with online tools that tailor themselves based on the needs of the students. Several websites allow for students to practice skills such as addition and subtraction and will allow students to move on only once they have demonstrated
proficiency in the current topic (usually through a test or quiz). In this way, students who are more proficient are able to move ahead and tackle more complex topics while
students who still require more time to reach proficiency can take that time without the need for the teacher to provide additional worksheets. These types of sites are also beneficial in that each student can work at his/her own pace anonymously- thereby avoiding any social pressures or stigma that might come about when the teacher gives different levels of work to different students.
of mathematics education is the famous study by Carraher, Carraher, and Schliemann (1985), which studied children engaged in commercial transactions on the streets of Brazil. They found that while the children were able to quickly and accurately calculate how much was owed to them for a given transaction and make change, these same children struggled significantly to apply the same mathematical concepts when given the exact same problems in a decontextualized manner (such as a paper and pencil test with both basic calculations and word problems). This research came about at a time when cognitive psychologists were beginning to emphasize the benefits of making connections between a person’s knowledge and its use in real-world applications. By demonstrating
that children were able to solve problems without knowing or using traditional
computational routines, the study challenged educators’ traditional forms of pedagogy
which held that students must be taught how to do the calculations involved in a problem before they could be handed the problem itself (Clements, 2004).
This type of research led researchers such as Resnick (1987) and Collins (1988) to put forth a call for situated learning models of instruction. Resnick (1987) proposed that “bridging apprenticeships” be designed to help bridge the gap between theoretical
learning and the real-life application of that knowledge. While such apprenticeships are useful tools, they can also be extremely difficult to manage and provide to all students. In order to develop a more concrete model of instruction that could be used across all classrooms, Collins (1988) created a model of instruction that focused on situated learning in the classroom. He defined situated learning as “the notion of learning
of computing technologies to provide authentic learning experiences, through computer-based simulations or similar technologies, provides the same cognitive and academic benefits as a more traditional apprenticeship approach, there is increasing agreement that computer-based representations provide a powerful vehicle for the critical characteristics of situated learning within the classroom environment (Herrington & Oliver, 2000). Herrington and Oliver (2000) comment that many of those involved with situated learning models have accepted that a computer can provide an alternative to the real-life setting without sacrificing the authenticity of context that is a crucial element of the model. Because of the lower costs of using computer technology to provide for authentic learning experiences, many districts and schools are attempting to use technology as a substitute for more traditional apprenticeship-type approaches. For more concrete examples of how to use the principles of authentic learning in practice, see Herrington and Kervin’s (2007) “Authentic Learning Supported by Technology: Ten suggestions and cases of integration in classrooms”.
Computer-Supported Collaborative Learning. Computer-supported
available in recent years, many researchers in education have begun focusing on how computers can be used within a collaborative group environment in order to improve the learning process. As explained by Koschmann and Suthers (2006), CSCL developed in the 1990s partially as a reaction to the development of software that was designed to individualize student learning in a socially isolated setting. Rather than taking the view that learning is best accomplished through an isolated, individualized experience, various researchers and educators focused on the potential for computer technology to connect individuals in order to foster a more social learning experience. They reason that through the appropriate use of CSCL, students become more engaged with the material and therefore demonstrate better learning outcomes.
2004). However, others argue that individual impacts should be measured through their engagement in group construction of knowledge- that through peer group collaboration, individual students learn how to construct meaning in more complex ways than they would be able to do alone (Blumenfeld et al., 1996).
1.4 Student Engagement
While many studies have focused exclusively on the impact of 1:1 initiatives on academic achievement, a large number have also investigated how the use of computers may impact student academic engagement. This is due to the recognition by researchers that while the increased use of technologies may have a limited direct impact on
academic achievement, the use of new technologies may have the potential to positively impact student engagement, which could lead to a number of positive outcomes down the road, such as increased interest in a particular topic and an increased desire to continue their education post-high school. As demonstrated earlier, researchers have consistently found a significant relationship between 1:1 initiatives and increased student engagement, however one limitation of these findings is that the operational definitions of student engagement varied considerably between studies. For the purposes of the current study, the construct of School Satisfaction will be used as the indicator of student engagement. Grounded in the theoretical literature surrounding subjective well-being (SWB: Diener, 1984), school satisfaction is an important indicator of well-being in school-aged children. School satisfaction has been defined as a student’s evaluation of his or her school
experience “as a whole” (Huebner, 1994), meaning that it is a cognitive construct that is based on the students’ own subjective evaluation of his/her own experience. Previous
studies have supported the contention that school satisfaction is a distinct domain of students’ general life satisfaction among adolescents (Huebner et al., 1998; Seligson et
with other domains in their life- meaning that this is an area of well-being that has significant room for improvement (Huebner et al., 2005).
Research on school satisfaction has consistently provided evidence of its
importance as well as its ability to predict a host of both positive and negative outcomes. Among adolescents, low levels of school satisfaction have been linked to poor school achievement (Baker, 1998; Ladd, Buhs, & Seid, 2000) and internalizing and externalizing behavior problems (DeSantis-King et al., 2006; Huebner and Gilman, 2006), including depression (Eamon, 2002), suicidal ideation (Eamon, 2002; Locke and Newcomb, 2004), and substance use (Newcomb et al., 1987; Oakley et al., 1992; Strivastava and
Strivastava, 1986). Thus, this evidence joins a large and continuously growing body of literature demonstrating the severe long-term impacts of poor schooling experiences. If students do not feel engaged in their school or are not satisfied by their schooling
experience, this data suggests that they are significantly more likely to engage in negative behaviors and have several negative outcomes. On the opposite side, high levels of school satisfaction have been demonstrated to relate to several positive academic and behavioral outcomes such as engaged classroom behavior (Elmore and Huebner, 2010), higher motivation towards learning (Keys and Fernandes, 1993), commitment to school (Goodenow and Grady, 1992; Wehlage et al., 1989), and school completion (Ekstrom et al., 1986; Okun et al., 1986).
In addition to researching the outcomes associated with students’ levels of school satisfaction, various studies have also examined the various correlates of school
students. For instance, studies by Epstein (1981) and Baker et al. (2003) found that supportive teacher behavior was a significant correlate of students’ school satisfaction.
Futher studies of teacher behavior by Furrer and Skinner (2003) found that both teacher-imposed classroom climate (Furrer and Skinner, 2003) and the provision of meaningful, appropriately challenging instructional tasks were also significant correlates of students’
school satisfaction (Maton, 1990; Wong and Csikzentmihaly, 1991). Another study by Jiang, Huebner, and Siddall (2012) found that teacher-related social support significantly predicted students’ school satisfaction in both cross-sectional and longitudinal analyses.
Taken together, this data indicates that teachers’ levels of social support and their provision of engaging instructional tasks both significantly relate to students’ school satisfaction. Thus, if schools can effectively increase both teachers’ provision of social
support as well as appropriate, engaging instructional tasks, they can likely significantly impact students’ school satisfaction as well as their more distal developmental outcomes.
This would imply that one way that the use of computing technology may impact students’ school satisfaction would be through the provision of more effective instructional practices.
1.5 21st Century Learning Skills
It has been largely accepted that the world economy (and especially the economy in the United States) is moving towards an information or knowledge society. As
information becomes more easily available and as jobs requiring repetitive tasks (such as factory work) become increasingly scarce due to the development of robotic
perform in-person services (such as childcare workers) and those who will be able to identify, analyze, and solve novel problems in a complex world. As Levy and Mundane (2004) argued, tasks that are rule-based will become increasingly automated through computers, but jobs that require the ability to understand and interpret complex patterns will become increasingly important. They note that as computer technologies have
advanced, the need for jobs that acquire information will be diminished and the particular understanding of new information will be paramount in many jobs and professions. In response to the ever-changing needs of the 21st century workforce, many in both the business and education realm have called for the development of new competences, often referred to as 21st Century Skills.
within the context of formal schooling. Indeed, they hypothesize that if schools do not keep up with the demands of teaching 21st century learners, that individuals will begin to seek their education outside of the school context. Already they note that the main impact of technology on education has occurred largely outside the school setting. Interestingly, in order to tackle the seemingly intractable problem of how to incorporate rapidly-changing technologies to educate students for jobs that do not exist yet, many theorists have taken a similar approach as the proponents of the liberal arts and argue that although the tasks these jobs will require may vary substantially, at the core of all of them are a basic set of competencies that individuals need to have- what they refer to as 21st Century Skills.
national and international significance attest to the priority 21st century skills are being given not just in the United States, but around the world as well. In their review, Voogt and Roblin (2010) were able to summarize the types of skills found most commonly across the various frameworks. They found that the skills of collaboration,
communication, Information and communication technology (ICT) literacy, social and/or cultural skills, including citizenship, were mentioned in all of the frameworks they found. In addition, they found that most of the frameworks also included creativity, critical thinking, problem solving, and developing quality products/productivity. Of note, only the EU, P21, and ATCS frameworks included any mention of traditional core academic subjects, an indicator of how many of these frameworks postulate that these skills should be used in a cross-discipline fashion and as a complement to- not a replacement for- traditional academic subjects.
explain information are becoming much more important than relying on memory of learned facts. For this reason, as well as many others, 21st century skills may represent a domain of functioning separate from traditional academic outcomes, but nonetheless equally critical to an individual’s success in the workforce post-graduation.
Not only are 21st century skills likely to be extremely important to students in the future, but they may also serve as a better means through which to understand the impacts of the technological initiatives being rolled out in many states, districts, and schools across the country (as described above). Indeed, a handful of researchers have argued that the use of state-required standardized test scores in traditional academic subjects may not provide valid measures of the types of learning that occurs through the use of technology despite their increased use in measuring the outcomes of technology initiatives (O’Dwyer
Measuring 21st Century Skills. Despite several authors’ attempts to demonstrate what 21st century skills look like when used in the academic setting, a way to
systematically examine the presence of these skills in a large-scale, standardized manner has remained elusive. One reason for this is that many of the aforementioned frameworks focus on assessment at the individual teacher level rather than at a group level (Voogt & Roblin, 2010) and therefore have not yet turned their attention to developing assessments that could compare groups of students without going through the burdensome process of portfolio evaluations. Another difficulty is that even though the skills are detailed within all of the various frameworks, few, if any, of the frameworks have identified a framework for technology integration that helps teachers understand the various levels of use or help them understand the level of knowledge students need at each particular grade level. However, there are a very small handful of resources out there developed by state departments of education and university centers to help teachers and administrators with this issue. For instance, the Florida Center for Instructional Technology at the University of Florida created a Technology Integration Matrix to help teachers and administrators understand the various levels of use for what they have described as “characteristics of meaningful learning environments” (Technology Integration Matrix, 2011) and even
initiatives, both fail to provide a concrete way to measure the level of 21st century skills in their students in a way that can be compared to students in other schools and states.
One assessment that does enable schools to measure 21st century skills is the 21st Century Skills Assessment (21CSA) created by Learning.com. The 21CSA was
developed in such a way as to both measure students’ 21st century skills and to do so in a
way that takes advantage of the possibilities in using technology for assessment purposes. For instance, while some of the questions on the assessment are simple multiple choice answers, several of the questions (especially questions about how to use technology tools) utilize simulated applications to test students’ actual knowledge of how to carry out
specific tool-related processes such as copying and pasting and inserting objects into a word processing program. The 21CSA was also matched to ISTE’s NETS-S standards and provides both independent scores for each of the 6 standards as well as an overall performance score. The NETS-S standards are detailed below (ISTE, 2014):
1. Creativity and Innovation
Overall: Students demonstrate creative thinking, construct
knowledge, and develop innovative products and processes using technology.
a. Apply existing knowledge to generate new ideas, products or processes.
b. Create original works as a means of personal or group expression.
c. Use models and simulations to explore complex systems and issues.
d. Identify trends and forecast possibilities. 2. Communication and Collaboration
Overall: Students use digital media and environments to
communicate and work collaboratively, including at a distance, to support individual learning and contribute to the learning of others.
b. Communicate information and ideas effectively to multiple audiences using a variety of media and formats.
c. Develop cultural understanding and global awareness by engaging with learners of other cultures.
d. Contribute to project teams to produce original works or solve problems.
3. Research and Information Fluency
Overall: Students apply digital tools to gather, evaluate, and use information.
a. Plan strategies to guide inquiry.
b. Locate, organize, analyze, evaluate, synthesize, and ethically use information from a variety of sources and media.
c. Evaluate and select information sources and digital tools based on the appropriateness to specific tasks.
d. Process data and report results.
4. Critical Thinking, Problem Solving, and Decision Making
Overall: Students use critical thinking skills to plan and conduct research, manage projects, solve problems, and make informed decisions using appropriate digital tools and resources.
a. Identify and define authentic problems and significant questions for investigation.
b. Plan and manage activities to develop a solution or complete a project.
c. Collect and Analyze data to identify solutions and/or make informed decisions.
d. Use multiple processes and diverse perspectives to explore alternative solutions.
5. Digital Citizenship
Overall: Students understand human, cultural, and societal issues related to technology and practice legal and ethical behavior.
a. Advocate and practice safe, legal, and responsible use of information and technology.
b. Exhibit a positive attitude toward using technology that supports collaboration, learning, and productivity.
c. Demonstrate personal responsibility for lifelong learning. d. Exhibit leadership for digital citizenship.
6. Technology Operations and Concepts
Overall: Students demonstrate a sound understanding of technology concepts, systems, and operations.
a. Understand and use technology systems.
b. Select and use applications effectively and productively. c. Troubleshoot systems and applications.
Because of the 21CSA’s ability to measure students’ 21st century skills, this framework and assessment will be used as a measure of students’ 21st century skills. By
using this framework and assessment, this study will be able to examine the impact of technology use in the classroom on students’ 21CSA scores and therefore provide a more nuanced and informed view of how a 1:1 technology initiative impacts students’ learning.
1.6 Studies on 1:1 Initiatives
As has been documented above, there has been a significant amount of research on the potential of 1:1 initiatives to impact academic achievement and engagement as well as technology-related teaching strategies and students’ school satisfaction and relatively little work done on 21st Century Skills. However, none of the research to date has made an attempt to examine the relationships between these teaching strategies and student outcomes. The most notable exceptions are studies by O’Dwyer et al. (2005), O’Dwyer et al. (2008), and Shapley et al. (2010), which primarily examined how
computer use related to various academic outcomes.
In O’Dwyer et al.’s (2005) study, the researchers examined the relationship between both home and school computer use and students’ English/Language Arts state
standardized test scores. They collected data from 986 fourth grade students across 55 classrooms in 9 school districts across Massachusetts via both teacher and student
O’Dwyer et al.’s (2005) study, they examined 5 teacher uses of technology, including “Teachers use of technology for delivering instruction”, “teacher-directed use of technology during classtime”, “Teacher-directed student use of technology to create products”, “Teachers’ use of technology for class preparation”, and Teachers’ use of technology for student accommodation”. They also investigated 3 student uses of
technology, including “Student use of technology at school”, “Student recreational use of technology at home”, and “Student academic use of technology at home”. O’Dwyer and
colleagues (2005) adopted a multi-level analytic approach in order to examine student-level indicators nested inside teacher-student-level indicators. They found that student reports of how often they use a computer in school to edit papers and recreational home use consistently predicted students’ overall ELA scores, writing scores, and reading and
literature scores in their models. Interestingly, while the use of technology to edit papers was associated with higher student scores, home recreational use was associated with lower student test scores. Another interesting finding noted by the researchers was that the use of computers during the writing process was found to have a positive relationship with students’ performance on the essay section of the state-required standardized test,
despite the test requiring the students to use a paper and pencil. This study was one of the first to provide a more nuanced look at the relationship between computer use and student achievement through both the measurement of specific types of technology use as well as their use of a multi-level analytic approach that was better able to examine how the student-level and teacher-level indicators impacted academic achievement differently.
the researchers examined data from 986 students in 55 classrooms across 25 schools in 9 districts in Massachusetts as part of the USEIT study. They examined the same teacher-level and student-teacher-level predictors and once again utilized a multi-teacher-level analytic approach. Unlike in their previous analyses where they found a positive relationship between
technology use at school and ELA scores, O’Dwyer and colleagues (2008) were unable to find any significant predictors other than students’ previous test scores and a measure of
their socioeconomic status. They even found that their measure of general technology use had a significant negative relationship with students’ scores on the Geometry subsection of the test. One hypothesis put forth by the researchers as to their lack of findings was that despite the fact that one third of the classrooms in their study were considered
“high-use” classrooms, when they examined the students’ responses about computer use specifically in their math classes, few students reported using their computers for math more than once per month. Thus, the potential for computer usage to impact students’
scores was likely negligible.
Arguably one of the most comprehensive studies of how a technology immersion initiative impacted student achievement outcomes is Shapley et al.’s (2010) pilot study of
engagement, and learning. In their introduction, Shapley et al. (2010) make a strong argument for the need to measure the extent of implementation when evaluating the effectiveness of 1:1 laptop initiatives. The researchers gathered data from Fall 2004 until Spring 2008 and decided to divide up the students into 3 cohorts: Cohort 1 (8th graders in 2006-07 who attended Technology Immersion schools for the first 3 project years), Cohort 2 (8th graders in 2007-08 who attended Technology Immersion schools for 3 years), and Cohort 3 (7th graders in 2007-08 who attended Technology Immersion schools for only 2 years). They had approximately 2,500 students in each cohort with a large majority of the students coming from an economically disadvantaged background (approximately 75%). The researchers included 3 core areas of implementation (Support for Technology Immersion, Classroom Immersion, and Student Access and Use) in their analyses. Of most interest to the current study, the Classroom Immersion components that were reported by the teachers consisted of 1) Technology Integration, 2)
Learner-Centered Instruction, 3) Student Classroom Activities, 4) Communication, and 5) Professional Productivity. The Student Access and Use component (which was reported by the students) consisted of 1) Laptop Access, 2) Core-Subject Learning, and 3) Home Learning. The researchers then utilized a two-level hierarchical linear model (with students nested within their reading and mathematics teachers) to examine the impact of these various factors on students’ state reading and mathematics scores. Their analyses
relate to O’Dwyer et al.’s (2005) findings regarding student home use of computers.
While Shapley et al. (2010) found that home use of computers to do homework was significantly related to higher academic scores, O’Dwyer et al. (2005) found that home
use of computers for recreational purposes was negatively related to students’ test scores. This may call into question whether or not the actual use of technology is responsible for the effect, or whether these two items distinguish between two types of students- one group that uses their technology at home for recreation and not school and another that uses their technology at home for school rather than recreationally. One could imagine that there are likely underlying personality factors that could be driving both the way they use their technology at home as well as their overall academic performance.
1.7 The Current Study
The current study aims to add to the growing body of knowledge surrounding 1:1 implementation by examining how the specific technology-supported teaching strategies (Personalized learning, Authentic learning, and CSCL) potentially influence students’ school engagement, academic outcomes, and 21st century skills. While there are several studies that have examined the general impact of technology on student outcomes, few have sought out and investigated the specific, classroom-level mechanisms through which changes in student outcomes occur. As elucidated above, most studies examining the impact of 1:1 technology initiatives have focused on simply examining whether or not students participating in a 1:1 initiative outperform similar students who are not
impacts student performance through the study of specific activities engaged in by students and teachers. Even among these studies, only the study by Shapely et al. (2010) investigated these mechanisms within a specific 1:1 initiative.
The present analysis will be broken down into two parts: Impacts on Academic Outcomes and Impacts on 21st Century Skills. These will be described in more detail below
Study 1: Impacts on Engagement and Academic Outcomes. The first part of
the study will focus on the impact of technology-supported teaching strategies on student engagement as well as traditional measures of academic achievement. As documented above, student engagement is often seen as a significant impact of 1:1 technology initiatives and is commonly used to investigate the impacts of these initiatives on students. As 1:1 technology initiatives seek to improve the learning environment in schools, student engagement is often seen as one of the best ways to measure such impacts.
However, administrators and those funding such expansive initiatives often wish to examine impacts beyond students’ engagement. Despite the significant weaknesses in
using state-required standardized test scores cited above, they continue to be the gold standard upon which many initiatives are judged. When schools, districts, and states invest millions of dollars into large-scale technology initiatives, one of the things they want to know is whether or not it will have any type of significant impact on student academic achievement. Despite the numerous theoretical and methodological issues with this approach, students’ academic test scores significantly impact how schools are funded
administrators are able to not make raising state-required standardized test scores a proposed outcome of their technology initiatives, it is still beneficial for them to know whether or not this type of an intervention will result in such an outcome. If raising test scores is the sole focus for an administrator, it would be useful for them to know whether or not they would be better served putting money behind a technology initiative or whether that money may achieve their goal faster through ideas such as raising teacher salaries to attract new teachers or for the provision of additional support personnel. Based on the current state of the literature, the current researchers propose the following
questions to be answered in this study:
1. Do the technology-supported teaching strategies of Personalized, Authentic, and Collaborative Learning and Technology Integration impact students’
school satisfaction?
2. Do the technology-supported teaching strategies of Personalized, Authentic, and Collaborative Learning and Technology Integration impact students’
academic achievement in reading and/or mathematics?
In addition to these questions, the current study examines the impact of school-wide levels of technology-supported teaching strategies on students’ achievement in reading and mathematics as well as students’ school satisfaction. As demonstrated in the
study by Grimes and Warschauer (2008), there is often variability in how different schools implement their 1:1 technology initiatives. Thus it is a distinct possibility that students’ outcomes could vary by school and that these variations may be accounted for
hypothesized that school-wide levels of technology-supported teaching strategies may have impacts above and beyond the impacts students report for their individual teachers. In order to investigate this question thoroughly, school-wide levels of teachers’
technology-supported teaching strategies were obtained both through student and teacher reports.
Additionally, since each school may have implemented the 1:1 initiative
differently, and thus have varied outcomes associated with implementation, the current study examines the extent to which factors associated with school-wide implementation may impact students’ outcomes above and beyond the teaching strategies of individual
teachers. In order to investigate this possibility, a measure of implementation practices was created based on the Quality Implementation Tool (QIT) created by Meyers et al. (2012) and used to examine students’ outcomes by implementation practices.
Study 2: Impacts on 21st Century. As described above, a more appropriate outcome to study in relation to technology initiatives may be the development of 21st century skills. Many districts that have implemented 1:1 technology initiatives have stated that they hope to accomplish much more than simply raising student test scores- that they aim to increase students’ technological proficiency in order to prepare them for
Therefore, this study will seek to answer the following questions in order to examine how technology-related teaching strategies potentially impact students’ 21st century skills:
1. How do the technology-supported teaching strategies of Personalized, Authentic, and Collaborative Learning and Technology Integration impact students’ overall scores on the Learning.com 21CSA
assessment?
2. How do the technology-supported teaching strategies of Personalized, Authentic, and Collaborative Learning and Technology Integration impact each of the six 21st century skills standards proposed by ISTE’s NETS-S standards?
CHAPTER 2
METHODS
Data for this study was collected by the Richland 2 school district and shared with the Getting To Outcomes® (GTO) team as part of their evaluation of the Richland 2 1 TWO 1 Computing initiative. Data for this study was collected through three different data sources during spring 2014: student survey data, district testing data, and data from the Learning.com 21st Century Skills Assessment. The details of each data collection method will be described below.
2.1 Data Collection
Survey Data.
Every school in the Richland 2 School District was encouraged to have their students and teachers take a survey regarding their use of technology, teaching practices relating to the use of technology, as well as a number of other domains such as school satisfaction and engagement. The GTO team collaborated with the district staff in order to develop a survey administration plan that included the Director of Assessment and Accountability emailing each principal and asking them to send the survey link to their teachers and to have it completed by the end of the school year. In order to incentivize schools to complete the survey, a technology gift basket was offered as a reward to whichever school had the highest completion rates. The survey opened on April 28th, 2014 for elementary, middle, and high schools and the last survey was completed on June
part of the surveys. After the data was cleaned to avoid duplicates, high school students, and additional students that lacked sufficient data for the study the total dataset included 8,047 students and 517 teachers in grades 3-8. High school students were not examined for the current study due to a low level of representation across high schools. The student dataset was 49.2% male and 50.8% female. The majority of the student sample consisted of students who identified as Black/African American (55.3%) with 29.8% of the sample identifying as White, 6.6% Spanish/Hispanic/Latino, .1% Native American, 3.8% Asian or Pacific Islander, and 4.4% identifying as Other. Sample demographics are consistent with the overall demographic statistics reported by the district for the 2013-2014 school year. The number of students for each grade ranged from 1166 in grade 3 to 1548 in grade 6. Of those in the sample, 47.1% qualified for free/reduced price lunch and 6.4% of the sample were students in special education. State records indicated that sample
demographics were within 4% of state-reported demographics in all areas except for special education status, with only 6.4% of the sample receiving special education services compared to 11.5% of students in the district (South Carolina Department of Education, 2016). Student demographic data can be found in Table 1.
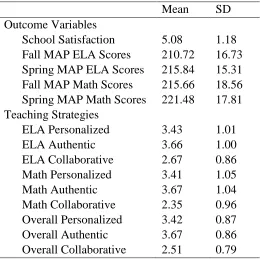
Measures Included in Survey.Multidimensional Students’ Life Satisfaction Scale
(MSLSS; Huebner, 1994). The MSLSS is a 40-item self-report measure of students’ satisfaction in 5 domains relevant to their lives: Family, Friends, School, Living
Environment, and Self. Students respond on a seven-point Likert scale ranging from 1=
Table 2.1. Sample Demographic Statistics. Percentage of Sample
District
Demographics Sex
Male 49.2% 50.9%
Female 50.8% 49.1%
Race
White 29.8% 26.1%
Non-White 70.2% 73.6%
SES
Paid Lunch 52.9% 54.7%
Free/Reduced Lunch 47.1% 45.3% Special-Education
Not in Special Ed. 93.6% 88.5%
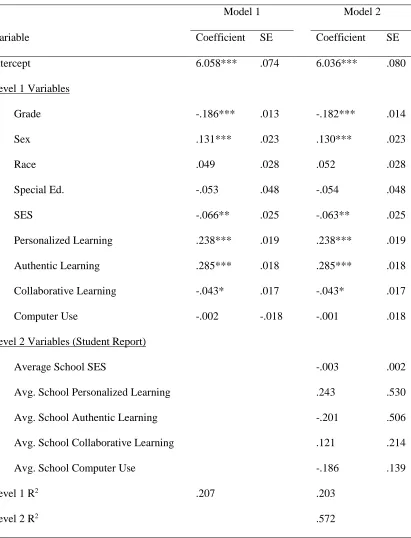
For the purposes of this study, the School Satisfaction subscale of the MSLSS was used as the measure of students’ school satisfaction. This subscale consists of eight
questions designed to measure the extent to which each student is satisfied with their overall experiences in school (e.g.. “I like being in school”). Previous research has
supported the reliability of the 8-item measure (alpha = .79) with school-age children and adolescents (Baker, 1999). The reliability in the current study was consistent with
previous estimate (alpha = .82). Concurrent validity has been suggested by a positive relationship (r = .68) with the Quality of School Life Scale (Epstein & McPartland, 1976) in a sample of preadolescent students (Huebner, 1994).
Student Report of Teachers’ Use of Personalized, Authentic, and Collaborative
Learning Strategies and Tech Integration. In order to measure teachers’ use of
Personalized, Authentic, and collaborative learning strategies, scales had to be developed by the author of this study. This was due to a lack of valid or reliable scales in the
literature that could adequately address these domains within a survey response format. The questions were specifically designed to measure the constructs of Personalized, Authentic, and Collaborative learning as they were being implemented by district personnel in Richland School District 2. The questions were analyzed both by the GTO team and Richland 2 district staff in order to check both their face validity and their acceptability. Each question was asked about both the students’ Math and
Personalized (Responses: 1- “Strongly Disagree” to 5- “Strongly Agree) 1. My (Subject) teacher knows how I learn best and teaches me that way 2. My (Subject) teacher lets me choose how to do my assignments Authentic (Responses: 1- “Strongly Disagree” to 5- “Strongly Agree)
1. My (Subject) teacher shows me how the things we learn in class relate to other parts of my life.
2. My (Subject) teacher gives me work that deals with things that happen in real life.
3. My (Subject) teacher shows me how what I learn in class is useful for my life outside of school
Collaborative (Responses: 1- “Never”, 2- “Rarely”, 3-“Sometimes”, 4- “Often”, 5- “Always”)
1. We work in small groups online either inside or outside the classroom. 2. We work together in groups to complete a project that takes more than one
week to finish.
3. We work together to create documents (e.g. google presentations, docs, etc.) 4. I send messages or chat with someone outside of my classroom (e.g. on
Google Hangout, Google Docs, Email, Google Chat, etc.)
Technology Integration was obtained by asking the students “Please tell us how often you use your computing device to do work in... (English/Math)” with the response options being “Not at all”, “1-2 days/week”, “3-4 days/week”, “Every day”, and “N/A”.
Several other evaluations of 1:1 technology initiatives have used this type of question to measure the level of technology integration in schools and classrooms (Shapley et al., 2010; O’Dwyer et al., 2008).
Teachers’ Report of Use of Personalized, Authentic, and Collaborative Learning
Strategies and Tech Integration. In order to measure teachers’ use of personalized, authentic, and collaborative learning strategies, teachers were asked to rate how often they engaged in technology-supported teaching strategies. Each of the questions was designed to reflect the ISTE NETS-T teaching standards (Voogt & Roblin, 2010). Questions and teachers’ response options are listed below:
Personalized Learning. (Responses: “Never”, “Rarely”, “Sometimes”, “Very often”, “Always”)
How often do the following things occur in your class(es)?
1. You offer personalized assignments to fit a particular student’s interests? 2. You offer personalized assignments to fit a particular student’s understanding
of the material?
3. You offer personalized assignments to fit a particular student’s learning style? 4. You customize learning activities to address students’ abilities using digital
tools and resources?
How often do the following things occur in your class(es)?
1. You ask your students to use digital tools and resources to explore and solve real-world issues?
2. Your students complain about the relevance of their school work to their lives? (reverse-scored).
Collaborative Learning. (Responses: “Almost never”, “A few times a semester”, “1-3 times per month”, “1-3 times per week”, “Almost daily”)
In general, how often do you ask your students to do the following? 1. Work in pairs or small groups to complete a task together?
2. Work with other students to set goals and create a plan for their team? 3. Create joint projects using contributions from each student?
4. Present their group work to the class, teacher, or others?
5. Work as a team to incorporate feedback on group tasks or products? The Cronbach’s alpha for each scale is approximately .892 for the teachers’ personalized learning scale, .853 for the teachers’ collaborative learning scale, and .609 for the teachers’ authentic learning scale.
QIT Domains.
In order to obtain data on the implementation process in each school, Technology Integration Specialists (TISs) were interviewed about each school they oversaw using an interview designed to investigate all 5 out of 6 domains of the QIT; the sixth domain (Evaluate the effectiveness of the implementation) was largely the responsibility of the GTO team. The GTO team analyzed the responses and generated a succinct list of responses. Questions used in the survey and relevant responses are detailed below:
Develop an Implementation Team (Technology Leadership Teams)
1. During 2013-2014, did [school name] have an active technology leadership team? By active, we mean a team that has met at least once in person during the 2013-2014 year. (Yes, No)
2. Who is in charge of the technology leadership team? (No leader, Rotating, School Administrator, Technology Leadership Coach)
3. Describe the nature of the team. (e.g. what is their role in the school? Does the group simply provide feedback? Do they have decision making power?) (Don’t know, Steering Committee, Advisory Group, Workgroup,
Community/School coalition, other)
4. Describe the responsibilities of specific team members (other than the leader). (Don’t know, No specific individual roles, Specific roles delineated)