Review 1
Characterization of self-assembled 2D patterns with
2
Voronoi Entropy
3
Edward Bormashenko 1,*, Mark Frenkel 1, Alla Vilk 1, Alexander A. Fedorets 2, 4
Nurken E. Aktaev 2, Leonid A. Dombrovsky 2, 3, and Michael Nosonovsky 2, 4 5
1 Department of Chemical Engineering, Biotechnology and Materials, Engineering Sciences Faculty, Ariel
6
University, Ariel, Israel 407000
7
2 University of Tyumen, 6 Volodarskogo St., Tyumen 625003, Russia
8
3 Joint Institute for High Temperatures, 17A Krasnokazarmennaya St., Moscow, 111116, Russia
9
4 Mechanical Engineering, University of Wisconsin—Milwaukee, 3200 North Cramer St., Milwaukee, WI
10
53211, USA
11 12
* Correspondence: [email protected]; Tel.: +972 074 729 68 63
13
14
Abstract: The Voronoi entropy is a mathematical tool for quantitative characterization of the 15
orderliness of points distributed on a surface. The tool is useful to study various surface self-16
assembly processes. We provide the historical background, from Kepler and Descartes to our days, 17
and discuss topological properties of the Voronoi tessellation, upon which the entropy concept is 18
based, and its scaling properties, known as the Lewis and Aboav-Weaire laws. The Voronoi entropy 19
has been successfully applied to recently discovered self-assembled structures, such as patterned 20
micro-porous polymer surfaces obtained by the breath figure method and levitating ordered water 21
micro-droplet clusters. 22
Keywords: Voronoi entropy; surface patterns; Lewis law; Aboav law; droplet cluster; self-assembly 23
24
1. Introduction 25
Many scientific and technological problems involve patterns with a surface distribution of 26
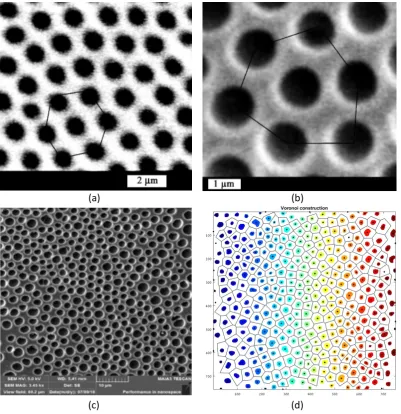
spots. A common example is micro-scaled porous honeycomb patterns on a polymer’s surface arising 27
from the so-called the breath-figures self-assembly, which will be described in detail below [1-4] 28
(Figure 1). Intuitively, the mages of the pores in Figure 1(a) and (b) look ordered, whereas the pattern 29
presented in Figure 1(c) seems to be disordered. But how this intuitive feeling can be quantified? 30
Quantitative parameters of self-organization can be obtained by building the Voronoi diagram (also 31
called the Voronoi tessellation, or Voronoi partition) and calculating the appropriate Voronoi 32
entropy, which is the topic of the present paper [5]. An example corresponding to the case in the 33
Figure 1(c) is presented in Figure 1(d). 34
35
Figure 1. Porous ordered polycarbonate honeycomb structures obtained with breath-figures
self-36
assembly is shown. (a)Scale bar is 2 µm. (b) Scale bar is 1 µm. (c) Scale bar is 10 µm (d) Voronoi
37
diagram for the case (c), Svor=1.0131 is depicted.
38
It appears that the idea of what is now called the Voronoi tessellation has been proposed 39
already by Johannes Kepler and Rene Descartes in the 17th century [6-7]. Kepler used them to study 40
the densest sphere packing problem, whereas Descartes employed these tessellations to verify that 41
the distribution of matter in the Universe forms vortices centered at fixed stars (Figure 2) [6-7]. British 42
physician John Snow, referred to as “the father of modern epidemiology,” re-discovered the 43
tessellations during the 1854 London cholera outbreak [7-8]. Snow identified infected wells by 44
superposing the map of cholera cases and the Voronoi diagram of the water sources sites [7-8], thus 45
proving that Voronoi diagrams can even save live. In parallel, the idea was revived by Dirichlet in 46
the context of his works on quadratic forms [9]. 47
(a) (b)
48
Figure 2. The tessellation diagram drawn by René Descartes is shown.
49
Georgy Voronoi (1868-1908) was a student of Markov in Saint Petersburg Universitry, 50
who spent most of his career at the University of Warsaw where he had become a professor even 51
before completing his PhD thesis [7]. Voronoi’s results were published in 1908, the year of his 52
untimely death at the age of 40 [5]. 53
A Voronoi tessellation or diagram of an infinite plane is a partitioning of the plane into 54
regions based on the distance to a specified discrete set of points (called seeds, sites, nuclei, or 55
generators) [10-11]. For each seed, there is a corresponding region consisting of all points closer to that 56
seed than to any other. The Voronoi polyhedron of a point nucleus in space is the smallest polyhedron 57
formed by the perpendicularly bisecting planes between a given nucleus and all the other nuclei. The 58
Voronoi tessellation divides a region into space-filling, non-overlapping convex polyhedral, shown 59
in Figure 3 [10-11]. 60
62
Figure 3. Example of the Voronoi tessellation on a set of points [10-11]. Red points represent seeds or nuclei.
63
The Voronoi entropy calculated from the diagrams is used to quantify orderliness of sets of 64
spots on a 2D plane or cells around these points. Such random or self-organized cells appear during 65
various processes in the materials science and surface science including grain growth and self-66
assembly of colloidal and droplet patterns. 67
2. Topological and scaling properties of Voronoi diagrams and entropy 68
A Voronoi diagram has the following two salient properties: (i) the edges of the Voronoi 69
diagram include all the points in the plane that are equidistant to the nearest seed, and (ii) the vortices 70
are the points equidistant to three (or more) seeds. Topologically, Voronoi diagrams represent planar 71
graphs with a number of interesting properties [12]. The number of edges joined to a given vortex is 72
its coordination number z. A topologically stable Voronoi diagrams, i.e. a diagram which maintains its 73
topological properties under small deformations, is characterized by the coordination number of all 74
its vortices 𝑧 = 3 [12]. Note that the Voronoi diagram, as any other planar cellular pattern, obeys to 75
the Euler equation 76
𝑣 − 𝑛 + 𝑓 = 𝜒 = 2 77
(1) 78
where and v is the number of vertices, n is the number of edges, f is the number of cells (polygons 79
bounded by edges including the outer infinitely large region) and 𝜒 is the Euler number (or the Euler 80
characteristics) [12]. An immediate consequence of the Euler equation for the Voronoi diagrams is 81
that in the limit of a large system (when v, n, and f are all large integers), the average number of edges 82
surrounding a cell is six, or 〈𝑛/𝑓〉 = 3. This is because for topologically stable diagrams n=3/2v (there 83
The seeds sharing a common Voronoi segment are geometric neighbors [10, 13]. When such 85
common physico-chemical processes as the heterogeneous condensation or grain growth are 86
considered, geometric neighbors become competing centers in a growth scenario. 87
To quantify the orderliness of the Voronoi tessellation or a similar 2D structure the so-called 88
Voronoi entropy is defined as 89
=
−
n
n n
vor
P
P
S
ln
, (2) 90where Pn is the fraction of polygons with n sides or edges (also called the coordination number of the
91
polygon) in a given Voronoi diagram [10-12]. The summation in Eq. 2 is performed from n=3 to the 92
largest coordination number of any available polygon, e.g., to n=6 if a polygon with the largest 93
number of edges is a hexagon. 94
The Voronoi entropy can be viewed as a measure of information content in the diagram. The 95
Voronoi entropy becomes zero for a perfectly ordered structure consisting of a single type of 96
polygons, so that Pn=1 and ln Pn=0. For a typical case of a fully random 2D distribution of points (i.e.,
97
with a uniform probability distribution of seed points on a plane), the value of
S
vor=
1
.
71
has been 98reported [14]. Therefore, it is expected that for a self-organizing structure, the value of Svor decreases.
99
Note that the Voronoi entropy is an intensive property, unlike the thermodynamic entropy, which is 100
an extensive property. Therefore, the value does not depend on the number of seeds, which makes it 101
appropriate to study processes where the number of seeds increases. 102
The degree of randomness in a cellular structure with straight edges can be characterized by 103
Lewis’ law [15-21]. Lewis observed a linear relationship between the average area of a typical n-104
polygon, 〈𝐴 〉, and n for various random 2D cellular mosaics created by growing living cells at 105
various stages of the development 106
〈𝐴 〉 = 𝛼(𝑛 − 2) (3) 107
where α is a proportionality constant. Eq. 3 suggests that the pattern can be considered random, if 108
there is a linear relationship between the number of edges and the mean area. For the precise value 109
and meaning of the constant α, see Ref. [19]. The validity of Lewis’ law was tested on natural patterns 110
of different nature at different scale sizes, from micrometers to kilometers [22-23]. In particular, the 111
Lewis scaling law was observed for patterns arising from condensation of droplets, which is crucial 112
for the formation of the breath-figures patterns and condensed droplet clusters [4, 23-27]. Another 113
scaling law, which has also been suggested, is the Desch law stating a linear relation between the 114
perimeter of polygons and the number of their edges [22, 28]. 115
Besides the Lewis and Desch laws, there is another important scaling law, related to Voronoi 116
diagrams, which is called the Aboav law [29-31]. This law relates the average number of sides 𝑚 of 117
a Voronoi cell that neighbors an n-sided cell to the number n according to 118
where a and b are constants. The Aboav law is often called in the literature the Aboav-Weaire law 120
[31]/ 121
Hence, small grains tend to be surrounded by large ones and vice versa (more accurately 122
speaking. the few-edged cells have a remarkable tendency to be in contact with many-edged cells 123
and vice versa) [19, 29-30]. The explanation of the Aboav law, exploiting the Euler formula (Eq. 1) was 124
suggested, and the values of constants a and b appearing in Eq. 4 were discussed in the literature [19, 125
30] . 126
Weaire in Ref, 30 stated that the Aboav formula appears to derive inexorably from the 2D 127
geometry and topology, and that it should not be seen as a departure from randomness [30]. 128
Some other properties of random planar distributions of nuclei generating Voronoi diagrams 129
are known. When the points are randomly and uniformly distributed on the plane, the probability 130
pn that a point has a n-sided Voronoi cell is given, for large n, by
131
𝑝 = ( )! 1 + 𝑂
√ (5) 132
which behaves as 𝑝 ≈ 𝑛 . The area distribution of Voronoi cells for random patterns was 133
suggested for the normalized cell size distribution function 134
𝑓(𝑥) = 𝑐𝑜𝑛𝑠𝑡 × 𝑥 exp (−( ) ), (6) 135
where d is dimensionality of the space (𝑑 = 1, 2, 3) [32]. The statistical distribution of perimeters of 136
Voronoi cells inherent for random patterns was treated in Ref. 33. Recursive Voronoi diagrams 137
created on a set of points can generate fractal patterns [34]. From the geometrical point of view, the 138
Voronoi tessellation represents a dual graph of the Delaunay triangulation [35]. 139
Multidimensional generalizations of the Voronoi diagrams are discussed in Refs. 13 and 32. 140
The 3D Voronoi diagrams are used in crystallography. Voronoi partition goes further than traditional 141
crystallo-chemical models based on the spherical atoms, since they can include the effect of the crystal 142
field on the atom shape. This introduces new methods of crystal structure description at the local and 143
global levels, such as sphericity and uniformity criteria, topological parameters for atomic packings 144
and ionic arrays and methods for void subspace analysis. Voronoi partition turns out be useful for 145
the quantitative analysis of the structure of void space in polymer solutions [36] and solid polymers 146
[37]. 147
3. Analysis of 2D self-assembled surface patterns with 2D Voronoi diagrams 148
Given that Voronoi diagrams can characterize ordering in diverse surface patterns, from 149
random to regular, they are used to study self-assembled structures. Among the examples are 150
kinetically driven self-assembly of highly ordered nanoparticle monolayers, formed by evaporation 151
of colloidal solutions [38], 2D arrays of Au nanoparticles synthesized from a near-perfect hexagonal 152
nanostructures [40], Voronoi diagrams indicate location of defected sites in self-assembled patterns, 154
thus enabling immediate revealing dislocations, and defected areas [41]. 155
Interestingly, Voronoi diagrams may arise in a natural way from self-assembly processes. 156
Zambo et al. reported self-assembly of like-charged nanoparticles into Voronoi diagrams [42]. A 157
macroscopic pattern was generated by the spatiotemporally controlled aggregation of like-charged 158
carboxyl-terminated gold nanoparticles in a hydrogel, where clustering has been induced by the 159
screening effect of the sodium ions that diffuse in a hydrogel [42]. Diffusion fronts of the sodium ions 160
induced nanoparticle aggregations, which generated Voronoi structures, where the Voronoi cells 161
consisted of aggregated nanoparticles and their edges represented aggregation-free and 162
nanoparticle-free zones [43]. 163
Martin et al. studied pattern formation during 2D nanoparticle self-assembly controlled by 164
direct modification of solvent dewetting dynamics [43]. The authors compared three different 165
techniques for the study of ordering in the resulting patterns: the Voronoi diagrams, two-dimensional 166
fast Fourier transform analysis of the images [44], and the Minkowski functional method [45-46]. 167
The Minkowski functionals of point patterns are calculated by centering a disk on each point and 168
analyzing the topology of this secondary patterns of overlapping disks as a function of the radius 169
[45]. 170
By combining the overlapping disks, a pattern of differently shaped objects is formed. The 171
total area, of this collection of objects is then just the total area of the disks excluding any overlapping 172
area. This is the first Minkowski measure (functional). The second Minkowski measure, the total 173
perimeter of the pattern is the perimeter of all of the shapes, which is reduced from the perimeter of 174
the individual disks because of overlaps. The Euler number χ, supplied by Eq.1 is the final Minkowski 175
measure, defined as the total number of distinct shapes or components in the window (created by the 176
overlapping disks) minus the number of holes [45]. Mathematically the three functionals do 177
completely classify a pattern [45]. It was suggested that the Minkowski functional method is the most 178
comprehensive for the recognition of ordering inherent for point patterns [45]. The problem of the 179
comparison of the effectivity Fourier transform, Minkowski functionals and Voronoi diagrams for 180
characterization of ordering in point patterns remains open. 181
Another method enabling characterization of patterning in 2D self-assembled patterns was 182
reported in Ref. 47 in which porous honeycomb structures arising from the breath figures self-183
185
186
187
Figure 4. The main stages of the breath figures self-assembly, resulting in creation of ordered
188
honeycomb micro-porous topographies are depicted.
189
These patterns are formed by the so-called breath figure self-assembly process. The breath 190
figures refer to the fog that forms when water vapor contacts a cold, typically solid surface, such as 191
glass. The common example is the fog which appears on a window, when one breaths on it. The 192
formation of breath figures was first studied more than hundred years ago by J. Aiken and by Lord 193
Rayleigh. Breath figures can form highly regular hexagonal arrangements of fog micro-droplets. This 194
is apparently due to their non-coalescence and due to various interactions (such as the Marangoni 195
convection) and variations in the temperature and humidity next to condensing micro-droplets [4]. 196
In the 1990s, it was discovered that breath figures can play a significant role in materials 197
science due to formation of regular honeycomb arrangements of micro-pores on the surface of 198
flow of moist air
cold surface
solvent evaporation
water condensation (nucleation)
water droplets form close packed array
array cools and sinks into solution
new generation of water droplets
new close packed array templated by underlying layer
polymers, formed by rapid evaporation of polymer solutions in humid atmosphere. Rapid 199
evaporation of the solvent cools the solution/humid air interface, resulting in intensive condensation 200
of water droplets at the interface. The droplets then sink into the solution, eventually forming a 201
honeycomb pattern (Figure 2). These breath figure patterns are used to synthesize superhydrophobic 202
surfaces [4]. 203
Scanning electron microscopy (SEM) images of breath-figures patterns were treated as 204
follows: in order to understand the short-range and long-range ordering in the obtained 2D 205
structures, the statistical properties of the auto-correlation functions were analyzed [47]. The 206
correlational analysis of the SEM images indicated short-range (ca. 5 µm) and large-scale (ca. 50 µm) 207
ordering of the honeycomb structures [47]. There is limited research addressing the Voronoi-208
partition- based analysis of hierarchical 2D patterns [43, 48-49]. A generalized version of the Voronoi-209
Delaunay method is used to study relatively large intermolecular voids [50]. The suggested version 210
made the Voronoi diagrams applicable for molecular systems, i.e., ensembles of partly overlapping 211
spheres [50]. 212
Regrettably the majority of studies reporting application of Voronoi diagrams to the study of 213
synthetic self-assembled patterns did not concentrate on the validity of the Lewis [15-19]and Aboav 214
laws [19-30]. However, the validity of these laws was studied for biological tissues including cells 215
constituting human muscles [51]. The Aboav law was reported for mitosis in vegetable tissues [31]. 216
It was also shown that the Lewis empirical, linear relationship between the average area of a cell and 217
the number of its sides in two-dimensional mosaics corresponds to maximal arbitrariness in the 218
cellular distribution observed in in epithelial mosaics [20]. 219
4. Droplet clusters and their analysis with Voronoi diagrams. 220
Another area of capillary phenomena, where the Voronoi diagrams are used is the self-221
assembled levitating clusters of water microdroplets. Such clusters emerge over locally heated spots 222
of a liquid surface [52]. Growing condensing droplets with a typical diameter of 0.01 μm – 0.2 μm 223
levitate at an equilibrium height [53-55]. Their weight is equilibrated by the drag force of the 224
ascending air-vapor jet rising over the heated spot (Figure 5). 225
Figure 5. Self-organization of a droplet cluster is demonstrated. (a) The image of the cluster and (b) the Voronoi
227
tessellation of the cluster. The scale bar is 200 µm. Yellow (1,9), gray (4–8), and blue (3,2) polygons have five, six,
228
and seven neighbors, correspondingly [56].
229
Droplets form a monolayer and arranged into a hexagonally ordered structure called a 230
cluster. Due to the attraction to the center of the heated area combined with aerodynamic repulsion 231
between the droplets, the clusters form structures that are quite diverse and different from densest 232
packing of hard spheres [56]. 233
Evolution of a typical growing water cluster is shown in Fig. 6. The Voronoi entropy decreases 234
with increasing time and the number of droplets. Newly arriving droplets disturb the hexagonal 235
structure, and the size of the droplets affects the Voronoi entropy. As a result, the Voronoi entropy 236
grows immediately after a new droplet joins the cluster. Following that, the entropy decreases due to 237
the ordering of the cluster arrangement. Since the densest 2D packing is provided by a hexagonal 238
arrangement. Most test showed also a correlation between the entropy and the fraction of hexagonal 239
clusters. This is because the hexagonal arrangement provides the densest 2D packing [56]. Levitating 240
monodisperse microdroplet clusters with 1–28 droplets formed over a locally heated water layer have 241
been reported recently [57]. 242
243
Figure 6. (a)Self-assembly of a droplet cluster over a heated water and (b) the Voronoi entropy, S
244
(blue), correlated with the number of droplets, N (red) [56]. The scale bar is 200 µm.
Figure 7 shows a relatively large droplet cluster and its Voronoi diagram. The structure of the 246
cluster is ordered at the center, while there are defects at the periphery. The value of the Voronoi 247
entropy is S=0.335. Figure 8 shows self-assembly stages of a small droplet cluster. 248
249
250
Figure 7. A large droplet cluster and its Voronoi diagram.
251 252 253
254
Figure 8. A small droplet cluster during self-assembly and its corresponding Voronoi diagrams are
255
shown. The scale bar is 200 µm.
256
Calculation of the dynamic Voronoi entropy enabled not only quantification of ordering on droplet 257
clusters, but also characterization of its temporal evolution [56-57]. 3D Voronoi analysis enabled to 258
quantify the clustering of inertial particles in homogeneous isotropic turbulence using data sets, 259
extracted from experiments performed with micro-bubbles [58]. Voronoi analysis also allowed 260
distinguishing the clustering behavior of heavy, neutrally buoyant, and light particles in turbulent 261
flows [58]. 262
5. Conclusions 263
Several methods can be used to quantify the orderliness of 2D patterns: The Minkowski 264
functionals [45], Fourier analysis [44], and correlation functions [47]. An alternative method is the 265
calculation of the entropy of the Voronoi diagram, which is the 2D analogy of 3D Wigner-Seitz 266
partition [59-60]. The diagram itself traces back to Johannes Kepler and Rene Descartes [6-7]. The 267
method was revived by Dirichlet [9] and Voronoi [5] and became popular for quantitative 268
characterization of 2D and 3D patterns. This approach has been successfully applied to the 269
characterization of surface self-assembly of biological and natural mosaics, occurring on the broad 270
diversity of spatial scales (from molecular to macroscopic ones). The Voronoi analysis is also effective 271
for the analysis of surface porous structures and droplet clusters, enabling in situ characterization of 272
ordering. We conclude that the use of Voronoi diagrams is a powerful tool enabling analysis and 273
quantification of ordering in a diversity of synthetic and biological systems. The comparison of the 274
effectivity of Voronoi diagrams for the analysis of 2D ordering vs Minkowski functionals and Fourier 275
analysis remains an open problem. 276
277
Author Contributions: The original draft was prepared by E.B. and revised by M.N.; figures prepared by A.F,
278
M.F., A.V., N.E.A., and L.A.D. All authors read the manuscript.
279
Funding: This research received no external funding.
280
Acknowledgments: Dr. Mark Frenkel, acknowledges partial support from the Israel Ministry of Immigrant
281
Absorption. The authors are indebted to Dr. Irina Legchenkova for her kind help in preparing this paper.
282
Conflicts of Interest: The authors declare no conflict of interest.
References 285
1. Widawski, G.; Rawiso, M.; Francois, B. Self-organized honeycomb morphology of star-polymer
polystyrene films. Nature 1994, 369, 387-389.
2. Pitois, J.; Francois, B. Formation of ordered micro-porous membranes. Eur. Phys. J. B. 1999, 8
(2), 225-231.
3. Karthaus, O.; Cieren, X.; Shimomura, M.; Hasegawa, T. Water-assisted formation of
micrometer-size honeycomb patterns of polymers. Langmuir 200, 16 (15), 6071-6076.
4. Bormashenko, E. Breath-figure self-assembly, a versatile method of manufacturing membranes
and porous structures: Physical, chemical and technological aspects. Membranes 2017, 7 (3),
45.
5. Voronoi, G. Nouvelles applications des paramètres continus à la théorie des formes
quadratiques. Deuxième mémoire. Recherches sur les paralléloèdres primitifs. Reine Angew.
Math. 1908, 134, 198-287.
6. Descartes, R. Principia Philosophiae.; Ludovicus Elzevirius: Amsterdam, 1644.
7. Liebling, T. M.; Pournin, L. Voronoi Diagrams and Delaunay Triangulations: Ubiquitous Siamese
Twins. Documenta Mathematica 2012, Extra Volume ISMP, 419-431.
8. Snow, J. Report on the Cholera Outbreak in the Parish of St. James, Westminster: during the
autumn of 1854.; Westminster, 1855.
9. Dirichlet, G. L. Über die Reduction der positiven quadratischen Formen mit drei unbestimmten
ganzen Zahlen. J. Reine Angew. Math. 1850, 40, 209-227.
10. Kumar, V. S.; Kumaran, V. Voronoi cell volume distribution and configurational entropy of
hard-spheres. J. Chem. Physics 2005, 123, 114501.
11. Barthélemy, M. Spatial networks. Phys. Rep. 2011, 499 (1-3), 1–101.
12. Weaire, D.; Rivier, N. Soap, cells and statistics—random patterns in two dimensions.
Contemporary Phys. 1984, 25 (1), 59-99.
13. Blatov, V. A. Voronoi–dirichlet polyhedra in crystal chemistry: theory and applications.
14. Limaye, A. V.; Narhe, R. D.; Dhote, A. M.; Ogale, S. B. Evidence for convective effects in breath
figure formation on volatile fluid surfaces. Phys. Rev. Lett. 1996, 76 (20), 3762-3765.
15. Lewis, E. T. The correlation between cell division and the shapes and sizes of prismatic cell in
the epidermis of Cucumis. Anat. Rec. 1928, 38 (3), 341-376.
16. Lewis, F. T. A volumetric study of growth and cell division in two types of epithelium-the
longitudinally prismatic cells of Tradescantia and the radially prismatic epidermal cells of
Cucumis. Anat. Rec. 1930, 47 (1), 59-99.
17. Lewis, E. T. The geometry of growth and cell division in epithelial mosaics. Am. J. Bot. 1943, 30
(10), 766-776.
18. Lewis, F. T. The geometry of growth and cell division in columnar parenchyma. Am. J Bot. 1944,
31 (10), 619-629.
19. Chiu, S. N. Aboav-Weaire's and Lewis' laws—A review. Materials Characterization 1995, 34 (2),
149-165.
20. Rivier, N.; Lissowski, A. On the correlation between sizes and shapes of cells in epithelial
mosaics. J. Phys. A: Math. Gen. 1982, 15 (3), L143-L148.
21. Sánchez-Gutiérrez, D.; Tozluoglu, M.; Barry, J. D.; Pascual, A.; Mao, Y.; Escudero, L. M.
Fundamental physical cellular constraints drive self-organization of tissues. The EMBO J. 2016,
35 (1), 77-88.
22. Saraiva, J.; Pina, P.; Bandeira, L.; Antunes, J. Polygonal networks on the surface of Mars;
applicability of Lewis, Desch and Aboav–Weaire laws. Phil. Mag. Lett. 2009, 89 (3), 185-193.
23. Steyer, A.; Guenoun, P.; Beysens, D.; Knobler, C. M. Two-dimensional ordering during droplet
growth on a liquid surfaceth on a liquid surface. Phys Rev. B. 1990, 42 (1), 1086-1089.
24. Pietsch, T.; Gindy, N.; Fahmi, A. Nano- and micro-sized honeycomb patterns through
hierarchical self-assembly of metal-loaded diblock copolymer vesicles. Soft Matter 2009, 5 (11),
2188-2197.
25. Park, M. S.; Kim, J. K. Breath figure patterns prepared by spin coating in a dry environment.
26. Bormashenko, E.; Musin, A.; Whyman, G.; Barkay, Z.; Zinigrad, M. Revisiting the fine structure
of the triple line. Langmuir 2013, 29 (46), 14163−14167.
27. Madej, W.; Budkowski, A.; Raczkowska, J.; Rysz, J. Breath figures in polymer and polymer blend
films spin-coated in dry and humid ambience. Langmuir 2008, 24 (7), 3517-3524.
28. Rivier, N. Statistical crystallography structure of random cellular networks. Phil. Mag.B 1985,
52 (3), 795-819.
29. Aboav, D. A. The arrangement of grains in a polycrystal. Metallography 1970, 383-390.
30. Weaire, D. Some remarks on the arrangement of grains in a polycrystal. Metallography 1974, 7
(2), 157-160.
31. Mombach, J. C. M.; de Almeida, R. M. C.; Iglesias, J. R. Mitosis and growth in biological tissues.
Phys. 1993, E 48 (1), 598-602.
32. Jarai-Szabo, F.; Zoltan, N. On the size distribution of Poisson Voronoi cells. Physica A 2007, 385,
518-526.
33. Zhu, H. X.; Thorpe, S. M.; Windle, A. H. The geometrical properties of irregular two-dimensional.
Phil. Mag. A 2001, 81 (12), 2765-2783.
34. Shirriff, K. Generating fractals from Voronoi diagrams.. In Chaos and Fractals;, 1998; Vol. 17, 2,
pp 165-167.
35. Delaunay, B. Sur la sphère vide. Bulletin de l'Académie des Sciences de l'URSS, Classe des
sciences mathématiques et naturelles. 1934, 6, 793–800.
36. Sung, B. J.; Yethiraj, A. Structure of void space in polymer solutions. Phys Rev E Stat Nonlin Soft
Matter Phys. 2010, 81 (3 Pt 1), 031801.
37. Danielsson, M.; Parks, D. M.; Boyce, M. C. Three-dimensional micromechanical modeling of
voided polymeric materials. J. Mech. Phys. Solids 2002, 50 (2), 51-379.
38. Bigioni, T. P.; Lin, X. M.; Nguyen, T. T.; Corwin, E. I.; Witten, T. A.; Jaeger, H. M. Kinetically driven
39. Yun, S.-H.; Yoo, S.; Jung, J. C.; Zin, W.-C.; Sohn, B.-H. Highly Ordered Arrays of Nanoparticles in
Large Areas from Diblock Copolymer Micelles in Hexagonal Self-Assembly. Chem. Mater. 2006,
18 (24), 5646–5648.
40. Arora, H.; Du, P.; Tan, K. W.; Hyun, J. K.; Grazul, J.; Xin, H. L.; Muller, D. A. Block Copolymer
Self-Assembly–Directed Single-Crystal Homo- and Heteroepitaxial Nanostructures. Science 2010,
330 (6001), 214-219.
41. Xu, J.; Russell, T. P.; Ocko, B. M.; Checco, A. Block copolymer self-assembly in chemically
patterned squares. Soft Matter 2011, 7 (8), 3915-3919.
42. Zámbó, D.; Suzuno, K.; Pothorszk, S.; Bárdfalvy, D.; Holló, G.; Nakanishi, H.; Wang, D.; Ueyama,
D.; Deák, A.; Lagz, I. Self-assembly of like-charged nanoparticles into Voronoi diagrams. Phys.
Chem. Chem. Phys. 2016, 18 (36), 25735-25740.
43. Martin, C. P.; Blunt, M. O.; Pauliac-Vaujour, E.; Stannard, A.; Moriarty, P.; Vancea, I.; Thiele, U.
Controlling Pattern Formation in Nanoparticle Assemblies via Directed Solvent Dewetting. Phys.
Lett. 2007, 99 (11), 116103.
44. Lim, J. Two Dimensional Signal and Image Processing.; Prentice Hall: USA, 1990.
45. Parker, J.; Sherman, E.; van de Raa, M.; van der Meer, D.; Samelson, L. E.; Losert, W. Automatic
sorting of point pattern sets using Minkowski functionals. Phys. Rev E 2013, 88, 022720. Phys.
Rev E 2013, 88 (2), 022720.
46. Mantz, H.; Jacobs, K.; Mecke, K. Utilizing Minkowski functionals for image analysis: a marching
square algorithm. Journal of Statistical Mechanics: Theory and Experiment 2008, 2008, P12015.
47. Bormashenko, E.; Malkin, A.; Musin, A. Mesoscopic Patterning in Evaporated Polymer
Solutions: Poly(ethylene glycol) and Room-Temperature-Vulcanized
Polyorganosilanes/-siloxanes Promote Formation of Honeycomb Structures. Macromolecular Chemistry and
Physics 2008, 209 (6), 567-576.
48. Bormashenko, E.; Pogreb, R.; Stanevsky, O.; Bormashenko, Y.; Stein, T.; Gendelman, O.
Mesoscopic Patterning in Evaporated Polymer Solutions: New Experimental Data and Physical
49. Bormashenko, E.; Pogreb, R.; Musin, A.; Stanevsky, O.; Bormashenko, Y.; Whyman, G.;
Gendelman, O.; Barkay, Z. Self-assembly in evaporated polymer solutions: Influence of the
solution concentration. Journal of Colloid and Interface Science 2006, 297 (2), 534–540.
50. Alinchenko, M. G.; Anikeenko, A. V.; Medvedev, N. N.; Voloshin, V. P.; Mezei, M.; Jedlovszky, P.
Morphology of Voids in Molecular Systems. A Voronoi-Delaunay Analysis of a Simulated DMPC
Membrane. J. Phys. Chem. B 2004, 108 (49), 19056-19067.
51. Sánchez-Gutiérrez, D.; Sáez, A.; Gómez-Gálvez, P.; Paradas, C.; Escudero, L. M. Rules of tissue
packing involving different cell types: human muscle organization. Scientific Reports 7 2017,
40444.
52. Fedorets, A. A.; Frenkel, M.; Shulzinger, E.; Dombrovsky, L. A.; Bormashenko, E.; Nosonovsky,
M. Self-assembled levitating clusters of water droplets: pattern-formation and stability.
Scientific Reports 2017, 7, 1888.
53. Fedorets, A. A.; Frenkel, M.; Bormashenko, E.; Nosonovsky, M. Small Levitating Ordered Droplet
Clusters: Stability, Symmetry, and Voronoi Entropy. J. Phys. Chem. Lett. 2017, 8 (22), 5599–
5602.
54. Fedorets, A. A. Droplet Cluster. JETP Lett. 2004, 79 (8), 372– 374.
55. Fedorets, A. A. On the Mechanism of Non-coalescence in a Droplet Cluster. JETP 2005, 81 (9),
437–441.
56. Fedorets, A. A. Mechanism of Stabilization of Location of a Droplet Cluster Above the Liquid–
gas Interface. Tech. Phys. Lett. 2012, 38 (11), 988– 990.
57. Fedorets, A. A.; Dombrovsky, L. A. Generation of Levitating Droplet Clusters Above the Locally
Heated Water Surface: A Thermal Analysis of Modified Installation. Int. J. Heat Mass Transfer
2017, 104, 1268–1274.
58. Tagawa, Y.; Mercado, J. M.; Prakash, V. N.; Calzavarini, E.; Sun, C.; Lohse, D. Three-dimensional
Lagrangian Voronoi analysis for clustering of particles and bubbles in turbulence. J. Fluid Mech.
2012, 693, 201-215.
59. Wigner, E.; Seitz, F. Phys. Rev. 1933, On the Constitution of metallic Sodium. 43 (10),
60. Ashcroft N. W.; Mermin, N. D. 1976, Solid State Physics, NY, Holt, Rinehart and Winston
pp. 73–75.

![Figure 3. Example of the Voronoi tessellation on a set of points [10-11]. Red points represent seeds or nuclei.](https://thumb-us.123doks.com/thumbv2/123dok_us/8004213.1329847/4.595.152.445.69.304/figure-example-voronoi-tessellation-points-points-represent-nuclei.webp)

![Figure 6. (a)Self-assembly of a droplet cluster over a heated water and (b) the Voronoi entropy, S (blue), correlated with the number of droplets, N (red) [56]](https://thumb-us.123doks.com/thumbv2/123dok_us/8004213.1329847/10.595.166.431.358.727/figure-assembly-droplet-cluster-voronoi-entropy-correlated-droplets.webp)

