ISSN:2574 -1241
Identification OF Post-Combustion Sub-Process
Using Artificial Neural Networks
Deynier Montero Góngora
1*, Ever Góngora Leyva
2and Mercedes Ramírez Mendoza
3 1Master’s Degree in Electro-Mechanics, Moa University, Cuba2PHD’s Degree in Technical Science, Moa University, Cuba
3PHD’s Degree in Technical Science, Universidad de Oriente, Cuba
*Corresponding author: Deynier Montero Góngora, Master’s Degree in Electro-Mechanics; Moa University, Holguin, Cuba
DOI:10.26717/BJSTR.2019.21.003633
Introduction
The Mining and Metallurgical Industry has become one of the bases of the economic-industrial development in Cuba. For this reason, it currently faces the challenge of Management Improvement to achieve a competitive industrial level worldwide. This Management improvement, as an integrated process, cannot ignore the technological improve-ment starting from a consistent application of advances in science and technology. In the nickel plants, in which the carbonate-ammonia leaching technology is used, also universally known as the “Caron” process, the multi-hearth furnaces [1] are used for mineral reduction. They represent an important link in the productive chain. The current
work was carried out in one of these plants, specifically in the
post-combustion sub-process of a reduction furnace, in which several automatic control strategies were previously used without success, attributed to the non-linear behavior of the temperature
as a function of the steady-state post-combustion airflow [2]. A
mathematical model that describes the dynamics of the process
must be available to design an automatic control strategy that guarantees the existing demands [3]. Nowadays, there is a growing interest in neural networks due to its great versatility and to the continuous advance in network training algorithms as well as in hardware [4]. Taking into account the facts previously described, the objective of this research is to model the post combustion in
the multi hearth furnace of a Nickel plant, by using artificial neural
networks, for the future implementation of a control architecture to
increase the energy efficiency of the process.
Materials and Methods
The Process of Reduction
The Herreshoff type furnaces [5] (Figure 1), are composed of (i) A metal cylinder covered on the inside with refractory
bricks, protected on the outside by a metal framework, (ii) Installation for stirring, feeding and discharging of ore, and
Received: September 19, 2019 Published: September 30, 2019
Citation: Deynier Montero G, Ever Góngora
L, Mercedes Ramírez M. Identification
OF Post-Combustion Sub-Process Using
Artificial Neural Networks. Biomed J Sci & Tech Res 21(4)-2019. BJSTR. MS.ID.003633.
ARTICLE INFO Abstract
In the muti-hearth furnace, there is a problem related to the automatic operation
of the loops of temperature regulation in hearths four and six, since the same flow of
air diverged into two branches. In this work, the authors take advantage of the capacity
of artificial neural networks for the learning of complex relationships, starting from a set of examples. A neuronal model of the post-combustion sub-process in an Indus-trial
furnace, which will serve to raise an automatic control strategy, is obtained. Experiments were carried out with binary pseudo-random sequences of modulated amplitude on the
flow of ore, and the openings of the regulating valves of air flow to hearths mentioned
before, to determine their effect on the temperature. The trial and error process enabled
to obtain an artificial neural network of multilayer perceptron type, capable of predicting
the temperature of hearth four with errors less than 0.5%, and 0.9% for the hearth six. Keywords: Multi-Hearth Furnace; Artificial Neural Networks; Automatic Control;
(iii) Combustion chambers. Inside the metal cylinder, there are 17 spherical vaults shaped hearths or screeds. In the center, there is a rotating shaft to which 68 arms are attached, 4 for each hearth (Figure 1).
Figure 1: Hysteresis type characteristic deformation of piezo actuator.
After the ore is weighed, it is discharged to the auger feeder,
which transports the ore to the hearth in the upper part of the furnace, in which the ore is retained during approximately 45 minutes. The reduction process is eminently endothermic. For this reason, the furnace has 10 combustion chambers located in hearths 15, 12, 10, 8 and 6 with high-pressure oil burners, which produce hot gases for heating the ore, while enriching the reducing atmosphere of the furnace, since they work with incomplete combustion. Thus, the ore in its descent is subjected to a rising temperature that allows a gradual heating, while the concentration of reducing gases i.e. carbon monoxide (CO) and hydrogen gas (H2) increases. The concentration of these gases in contact with the ores
at the beginning of decomposition is extremely important. After
reducing the nickel oxide, the mineral mixture is discharged from the furnace to a rotating conveyor [6]. In hearths 4 and 6 of the furnace, secondary air is introduced by means of a fan (Figure 1), with the purpose of burning the CO and H2 not consumed in the previous reduction stages, according to the following equations:
2 2
1 6.76
2
Mkcal
CO O CO
kmal
+ → + (1)
2 12 2 2 57.8Mkcal
H O H O
kmal
+ → + (2)
As can be seen from equation (1) and (2), these oxidation
reactions are exothermic and provide part of the heat needed in the upper hearths (4 to 0). The combustion in hearths 4 and 6 also avoids that the concentration of CO and H2 in the gases that leave the furnace exceed the permissible emission limits, which would
lead to environmental pollution. Furthermore, it increases the
overall energy efficiency of the process.
Obtaining an Approximate Model of the Process through
Experimental Identification
Obtaining a mathematical model that describes the process from the phenomenological point of view would be extremely complicated, since the physicochemical processes involved would lead to differential equations systems in partial derivatives, nonlinear and variable in time. Therefore, experimental
identification was chosen [7,8].
Notions of Modeling using Neural Networks: It has been shown that neural networks can be effectively and accurately used
for the identification and control of systems with complex dynamics,
especially for non-linear plants varying over time, and that are
more difficult to regulate with conventional methods [9]. In real life,
most industrial processes belong to this category, hence the need for intelligent methods to control those systems. Neural networks provide more accurate models than conventional methods, in the
identification of some systems, especially for non-linear systems
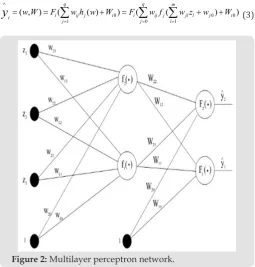
with variable parameters [4]. The multilayer perceptron network (or MLP), see Figure 2, is probably the most widely used type of network. The main reason for this selection is its ability to model, in a simple way, complex function-al relationships. This has been proved through numerous practical applications (Figure 2). The class of MLP network considered here has a single hidden layer with a hyperbolic tangent activation function (f) and in the output layer a linear activation function (F):
0 0 0
1 0 1
( , ) i( q ij j( ) i) i(q ij j(m jl l j ) i )
t
j j i
w W F w h w W F w f w z w W
y
∧= = =
= =
∑
+ =∑
∑
+ + (3)Figure 2: Multilayer perceptron network.
training process. The examples, or training data, constitute the set of systems u t( ), and their corresponding outputs
y t
( )
. The training set is given by:{[ ( ), ( )]|
1,..., }
NZ
=
u t y t t
=
N
(4)The identification can be seen as the determination of the
mapping of the training data set, to the set of possible weights: N
Z →
θ
∧so that, the network can produce a prediction y t∧( ) as close as possible to the actual output y t( ). A method of predicting error, which is the strategy applied here, is based on the introduction of a measure of proximity in terms of the least square’s criterion.1 1 ( , ) [ ( ) ( / )] ....[ ( ) ( / )] 2 N N T N I
V Z y t y t y t y t
N
θ
∧θ
∧θ
=
=
∑
− − (5)The weights are calculated as:
arg min ( , N)
N
V Z
θ∧= θ (6) Through some kind of iterative minimization scheme:
( 1)i ( )i ( )i
f
( )iθ
+=
θ
+
µ
+
(7)Where θ( )i specifies the current iteration (number ‘i’), is the
search direction, and
µ
( )i the step.As in any process of identification of a dynamic system, the
four classic steps were followed: obtaining the input-output data, selecting the structure of the model, estimating the model and validating it. Regarding the selection of the structure of the model, it is not only necessary to select a set of regressors, but also the architecture of the network. The procedure used is described in
[10]. The idea is to select the regressors based on the identification
of linear systems and then determine the best possible network architecture with the regressors given as input. The
Levenberg-Marquardt was used as a training algorithm. The MATLAB® program
and the identification toolbox with neural networks developed by
M Nørgaard [10] were used as a software to carry out the research.
Analysis of the Experiments Carried Out
Several experiments using binary pseudo random sequences
(APRBS) of order 5 to the input variables were applied, and multiple
replicas were made in order to achieve an adequate longitude of the input signal. The sampling period was calculated in three seconds taking into account the dynamics of the process. Details on the conditions under which the trials were conducted can be found in
[11]. The model based on artificial neural networks for the
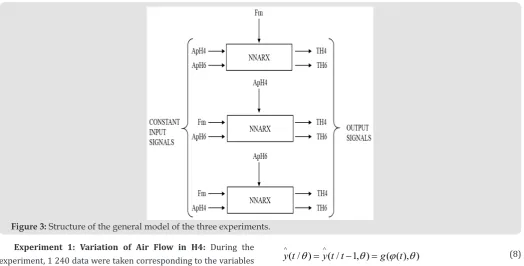
post-combustion sub-process of the ore reduction furnace is shown in Figure 3. The vertical sig-nals are also considered as inputs of the three models, but they vary in time (Figure 3).
Figure 3: Structure of the general model of the three experiments.
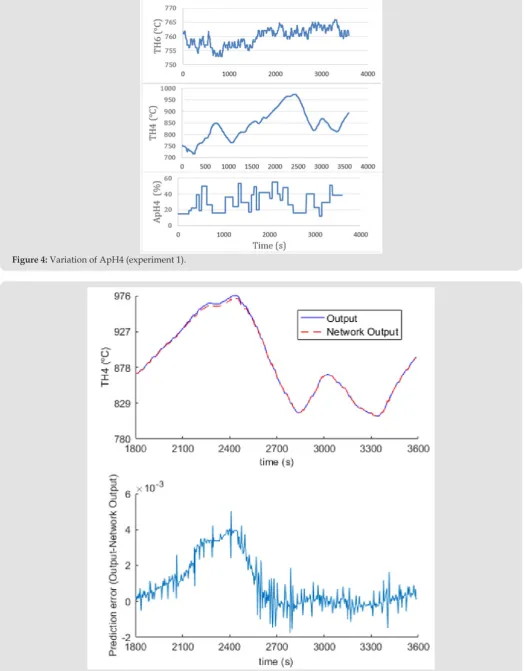
Experiment 1: Variation of Air Flow in H4: During the experiment, 1 240 data were taken corresponding to the variables
TH4, TH6 and ApH4. In this case, the opening of the hearth four
experienced a variation of 12 to 57 % of its total distance, the opening of the valve of the six-hearth remained constant at 40 %
and the flow of ore fed to the furnace was 18.2 t/h . In Figure 4,
the measurements of the input and output variables can be seen (Figure 4).
In this case, the non-linear autoregressive model (NNARX) was
selected:
( / )
( / 1, )
( ( ), )
y t
θ
y t t
θ
g
ϕ
t
θ
∧ ∧
=
−
=
(8)( ) [ ( 1)... (
) (
)... (
1)]
Ta k b k
t
y t
y t n u t n
u t n n
ϕ
=
−
−
−
− −
+
(9)Specifically, a totally connected network architecture composed of five neurons, hyperbolic tangent in the hidden layer and a linear
Figure 4: Variation of ApH4 (experiment 1).
Figure 6: Network output vs. Actual output and error prediction for TH6.
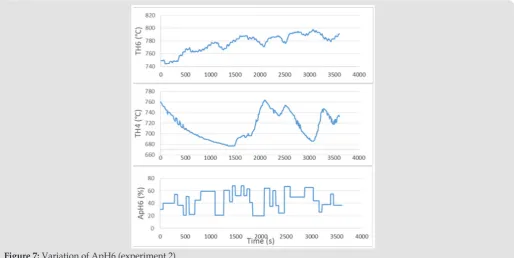
Experiment 2: Variation of Air Flow in H6: During the experiment, 1 240 data were taken corresponding to the variables
TH4, TH6 and ApH6. In this case, the opening of home six
experienced a variation of 20 to 68 % of its total distance, while the opening of the valve of the hearth four was kept constant at 25 % ,
with a flow of ore fed to the furnace of 18.2 t/h . Figure 7 shows the
measurements of the input and output variables. After following the same procedure described for the first experiment, prediction
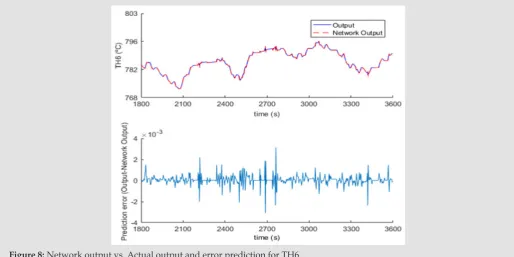
errors of 0.3 % are made for the hearth temperature six (Figure 8). Figure 9 shows the validation test for hearth temperature four, where prediction errors of 0.5 % are made (Figures 7-9).
Figure 8: Network output vs. Actual output and error prediction for TH6.
Figure 9: Network output vs. Actual output and error prediction for TH4.
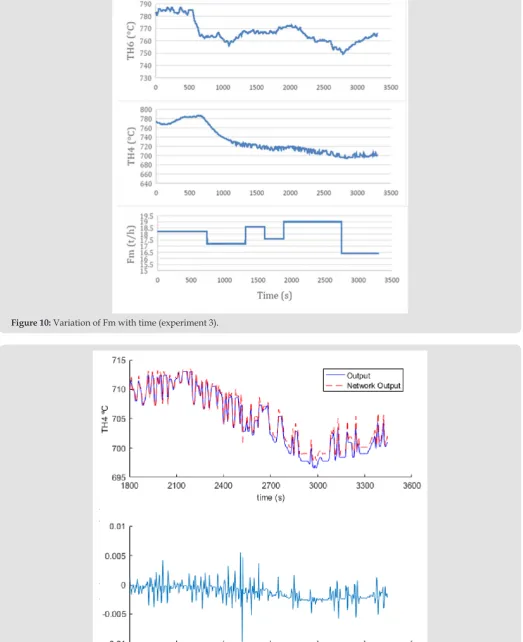
Experiment 3: Variation of Mineral Flow: During the experiment, 1 103 data were taken corresponding to the variables TH4, TH6 and Fm. Figure 10 shows the results of the input and
output variables obtained after experimenting with ore flows of 16
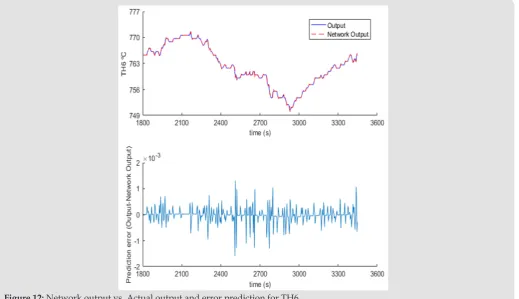
to 19 t/h , while the valve openings of hearths four and six were kept constant in 20 and 30 % , respectively (Figure 10). Figures 11 & 12 show the results during the validation for the observed
outputs, where lower pre-diction errors are observed for the home temperature six with respect to the home temperature four (Figures 11 & 12). The results of the comparison showed that the model
obtained through the use of ANN, reflects with more accuracy the
dynamic characteristics of the post-combustion sub-process than the linear models obtained in [7], thus, testing the potentialities
Figure 10: Variation of Fm with time (experiment 3).
Figure 12: Network output vs. Actual output and error prediction for TH6.
Conclusion
Despite the significant effort made on the research about
gas-solid reactions that occur during material processing operations, the knowledge of such reactors is still essentially incomplete; particularly in the context of the reduction of laterites, to which
the present study is linked. The artificial neural networks models
of temperatures in hearths four and six before changes in their
air flow, were obtained. These models were validated, providing
superior adjustments to those achieved with the linear models.
Acknowledgment
To the master’s degree in Higher Education Adelfa Verdecia
Cruz for her valuable contribution in this paper´s translation.
References
1. Castellanos J, Casto R, García I (1986) Elabo-ración de minerales oxidados de níquel por el esquema carbonato amoniacal. Minería & Geología 4 (2): 77-91.
2. Ramírez M (2002) Control Borroso de la Post-combustión en un Horno de Múltiples Hoga-res, Tesis de doctorado, Instituto Superior Politécnico José Antonio Echeverría, Ciudad de La Habana.
3. Caldas O, Jiménez S, Mejía E, Hernán dez J, Avilés O (2012) Identificación paramétrica en lazo cerrado de sistema de accionamien-to neumático
para cilindro de doble efecto. Revista Facultad de Ingeniería UPTC 21(33): 9-19.
4. Santos M (2011) Un Enfoque Aplicado del Con-trol Inteligente. RIAI
8(4): 283-296.
5. Habashi F (1997) Handbook of Extractive Metal-lurgy, Wiley-VCH,
Weinheim, Germany. 2(3).
6. (2007) Manual de operaciones de la Planta Hornos de Reducción de la empresa. Comandante Ernesto Ché Guevara de Moa.
7. Montero D, Ramírez M, Gilbert A, Perdi ces S (2015) Modelación matemática para el con-trol de la postcombustión en un horno de reducción de níquel. RIELAC 36(3): 21-34.
8. Ramírez M (2002) Modelado del proceso de postcombustión en un horno de reducción de níquel. Revista de Metalurgia, España 38(2): 150-157.
9. Ricardo Valverde Gil, Diego Gachet Páez (2007) Identificación de sistemas dinámicos utilizando redes neuro-nales RBF. RIAI 4(2): 32-42.
10. Nørgaard M (2000) Neural Network Based System Identification Toolbox, Report. 00-E-891, Department of Automation, Technical
Uni-versity of Denmark.
11. Montero D (2018) Modelación de la postcombus-tión en un horno de múltiples hogares utili-zando redes neuronales artificiales, Tesis de
Submission Link: https://biomedres.us/submit-manuscript.php
Assets of Publishing with us • Global archiving of articles
• Immediate, unrestricted online access • Rigorous Peer Review Process • Authors Retain Copyrights
• Unique DOI for all articles
https://biomedres.us/
This work is licensed under Creative Commons Attribution 4.0 License
ISSN: 2574-1241
DOI:10.26717/BJSTR.2019.21.003633