Texture Segmention : Comparasion between
Clustering and Classification
Sunita Dalai1, Manaswini sahu2
1
Asst. Prof., Dept. of ECE
2
M.Tech scholar, Dept. of ECE
1, 2
Centurion University of Technology & Management
1, 2
Bhubaneswar, Odisha, India
Abstract- In this paper, for region segmentation some methods are used to segment the image. The main steps of texture processing technique such as filterization, feature extraction, segmentation, classification. For filterization, the Gabor/Gabor Wavelet filters are to be used and then some useful informations are to be extracted from the filtered images through spatial smoothing method. Further step is to clustering the feature vectors through K Means and Fuzzy C-mean clustering. Then we compare between Gabor and Gabor Wavelet. And also compare between K means and Fuzzy c mean clustering. Clustering is an unsupervised classification technique. For better result, supervised classification technique have been used which is feed forward back propagation Neural network. In this paper, the comparison of segmentation results generated using unsupervised and supervised approach is presented. Supervised approach using Feed Forward Back Propagation algorithm shows promising result compared to unsupervised technique.
Keywords- Texture Segmentation, Gabor filter, Gabor-wavelet filter, Clustering, Classification.
I. INTRODUCTION
Texture is generally used to finding the specified objects or regions in an image. The use of image texture can be used as a description for regions into segments. There are two main types of segmentation based on image texture, region based and boundary based [2]. Generally texture may be smooth or rough and soft or hard etc. Texture segmentation is the separating an image into different regions to recognize the boundary between different textures in the image. Texture segmentation is an important facet of pattern recognition and digital imaging [6], [7]. Here textures are used for region recognition. There are different steps for region segmentation.
Filter design:the input image is decomposed into no. of filtered images through Gabor or Gabor Wavelet filters [3], [7], [8], [9].
Feature Extraction: then some useful information is extracted from the filtered images by the spatial smoothing method [4], [8].
Clustering (Unsupervised technique): feature vectors are to clustered through K-means or Fuzzy c mean clustering [9]
Instead of unsupervised classification technique , we have used supervised classification technique by using feed forward back propagation neural network.
Supervised approach using Feed Forward Back Propagation algorithm shows promising result compared to unsupervised technique.
In next section, the basic concept of texture segmentation process is presented, while Section II A deals with filter bank design, section II B shows the feature extraction method and setion II C.I deals with the clustering ,II C.II shows the classification technique. The experimental result are discussed in section III. The experiments on the Brodatz datasets are discussed in Section III A and finally Section IV draws conclusions.
II. TEXTURE SEGMENTATION
Fig. 1 Flow diagram of Texture segmentation process
The process of texture segmentation using multi-channel filtering involves the following steps:
A. Filter Bank Design
An input image is decomposed into no. of filtered images through Gabor/Gabor Wavelet filters. Gabor features is only a rotation inavariant technique. The process of texture segmentation using Gabor filters involves proper design of a filter bank tuned to different spatial-frequencies and orientations to cover the spatial-frequency space.
Transfer function in spatial domain,
2 2
0
2 2
1
1
(x,y)
exp
.cos(2 u x)
2
x y2
x yx
y
h
Transfer function in spatial-frequency domain,
2 2 2 2
0
( , ) exp{ 2 [
x(
)
y]}
H u v
u u
v
2 2 2 2
0
exp{ 2 [
x(
u u
)
yv
]}
The frequencies used for the filters are
1√2, 2√2, 3√2,………….., and (Nc/4)√2 cycles/image width
But Gabor Wavelet is both rotation and scaling invariant features. Here the input image is decomposed into no. of filtered images through Gabor Wavelet transform.
2D wavelet transform
0 00 0
1
, , , , ,
x y x y x yx
x
y
y
b b x y x y
b
b
b b
Where
x
, y
is the 2-D mother wavelet, with b x and by the scaling Parameters. x0 and y0 the spatial shifting.
2D Gabor wavelets
2 2 2
2 2
2 2
( , )
x y
f
exp
f
x
rf
y
rexp 2
j
fx
rK
B. Feature Extraction of Filter Outputs
Filter outputs by default are not appropriate for identifying key texture features. A number of feature extraction methods are used to extract useful information from the filtered outputs. Some of the feature extraction methods include:
using the magnitude response,
applying spatial smoothing,
using only the real component,
using a non-linear sigmoidal function,
using pixel adjacency information.
applying full wave rectification,
creating moments based on the spatial frequency plane.
Here spatial smoothing method is used for feature extraction.
C. Clustering and Classification of pixels in the Feature Space
1) Clustering in the Feature Space: At the end of the
feature extraction step we are left with a set of feature images extracted from the filtered outputs. Pixels that belong to the same texture region have the same texture characteristics, and should be close to each other in the feature space. The final step in unsupervised texture segmentation is to cluster the pixels into a number of clusters representing the original texture regions. Labeling each cluster yields the segmented image.
There are two approaches to clustering the feature vector.
a) K Means clustering: Here, we use the basic K
-means clustering algorithm for simplicity. It is a hard partitive technique. K-Means clustering technique is an unsupervised clustering algorithm that classifies the input data points into multiple classes based on their inherent distance from each other.
The Algorithm as follows:
i. Assign initial means
v
i(centroid)i
1, 2, ,
C
ii. Assign each data pattern (point)
X
k to the clusterU
i for the closest mean.iii. New updated centroid Xk Ui k i i
X
v
C
iv. Repeat step 2 and 3 until the updated centroid become stable.
b) Fuzzy C Mean clustering: FCM is soft partitive
clustering. Each data point is associated with every cluster using a membership function, which gives degree of belonging to the clusters.
The Algorithm as follows:
The FCM algorithm consists of the following steps:
i. Assign initial means
v
i (centroid)i
1, 2, , c
.Choose value of fuzzifier m and threshold t
max. Set iteration counter t=1.
ii. Repeat step 3-4 by incrementing t until
max
(t)
(t 1)
ik ik
t
iii. Compute
ik for c clusters and N datapatterns 2
1 1
1
ik m c ik j jkd
d
iv. Update means
v
i, using 11
(
)
(
)
N m ik k ki N m
ik k
X
v
2) Classification using Neural Network: Neural
network consist of sets of adaptive weights and are capable of approximating non-linear functions of their inputs. Neural neworks are usually organized in layers. Layers are made up of a number of interconnected 'Neurons' which contain an 'activation function'. Patterns are presented to the network via the 'input layer', which is connected to one or more 'hidden layers' where the actual processing is done via a system of weighted 'connections'. The hidden layers then link to an 'output layer' which will be the result. The arichitecture of the Neural network is shown in fig.2.
Fig. 2: Architecture of Neural Network
Input Layer
Hidden Layer
Output Layer
Every neurons in the input layers is connected to the every neurons of hidden layer. There must be some weight between each pair of layers to decide the boundary among different classes. For example, first neuron is connected to first neurons of hidden layer, so the weight is W11. Weight is also assigned between hidden layer and output layer. Weights are updated during each iteration of training by minimizing the mean square error. It will be done iteratively until the weight will be updated. Some error will be found. Then it will be passed through the sigmoidal function. But during training we calculate error (desired output-calculated output) using feed forward calculation. To learn nonlinear relationships between input and output vectors, a Multi-Layer Perceptron (MLP) has multiple layers with nonlinear transfer functions. Feed forward networks often have one or more hidden layers ofsigmoid neurons followed by an output layer. MLP is trained by adjusting theweights using Least Square Error (LSE) that minimizes the mean square error. The total square error between the desired class and the actual output in output layer K is calculated. To train the neural network, the gradient is determined by using a back propagation technique which involves performing computations backwards through the network. After the back propagation network is trained properly, it typically provides reasonable answers when presented with that it has never seen. Our MLP uses the sigmoid transfer function in all three layers. During training, random selected quantized feature vectors are assigned to proper classes.
III. EXPERIMENTAL RESULT
A. Datasets
For experimental purposes, two different texture database is used – (i) Brodatz texture database, and (ii) as the natural texture samples [1]. The database was formed by cropping nine 128 128 sub images from the centers of 111 different original 8-bit 512 512 images. Samples of Brodatz grayscale textures are shown in Fig. 3.
Fig. 3: Samples of Brodatz grayscale texture database
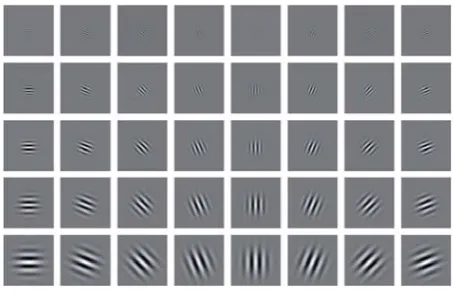
This figure 4 shows a family of Gabor wavelets with 4 scales and 8 orientations.
Fig. 4: An example of the real part of Gabor wavelets with 5 scales and 8 orientations.
After getting filtered images through Gabor/ Gabor Wavelet filter,then some useful information is extracted from those filtered images. Then feature vectors are to clustered through K means and Fuzzy C Mean technique. Some of the databases are used in this paper. Those are shown in below:
1) Two class problem:
Input image K-means using Gabor feature
FCM using Gabor feature
Fig. 4: comparision between k Means and Fuzzy C Mean using Gabor feature
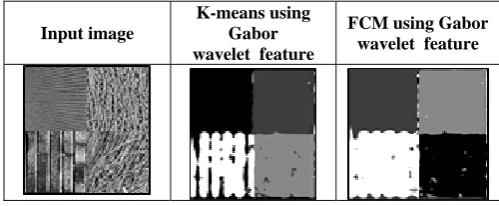
Input image K-means using Gabor Wavelet
FCM using Gabor Wavelet
Features
Fig. 5: comparision between k Means and Fuzzy C Mean using Gabor Wavelet feature
Fig 5 shows Segmentation through FCM using Gabor Wavelet feature gives better result than K-means using Gabor Wavelet features.
Similarly four class problem is done which is shown in below:
2) Four class problem:
Input image K-means using Gabor feature
FCM using Gabor feature
Fig. 6: comparision between k Means and Fuzzy C Mean using Gabor feature in Four class problem.
Input image
K-means using Gabor wavelet feature
FCM using Gabor wavelet feature
Fig. 7: comparison between k Means and Fuzzy C Mean using Gabor Wavelet feature in Four class problem.
There are some scene images which is shown in figure .8
Fig. 8: two different scene images
Input image K-means using Gabor feature
FCM using Gabor feature
Fig. 9: comparison between k Means and Fuzzy C Mean using Gabor feature
Input image K-means using Gabor feature
FCM using Gabor feature
Fig. 10 : comparison between k Means and Fuzzy C Mean using Gabor feature
Input image
K-means using Gabor wavelet
feature
FCM using Gabor wavelet feature
Fig. 11: comparison between k Means and Fuzzy C Mean using Gabor Wavelet feature
From the result below it is concluded that Fuzzy C Mean(FCM) clustering using Gabor Wavelet feature is giving better segmented image.
So overall Segmentation through FCM using Gabor Wavelet features gives better performance
Input image
K-means using Gabor wavelet
feature
FCM using Gabor wavelet
feature
Instead of unsupervised classification technique, I have used supervised classification technique in this paper to get a segmented image.
In this figure, ground truth image have been used for experimental evaluation.
Input Image Ground Truth Segmented Output Image
Fig. 13: segmented output image using classification technique
Input image Ground Truth Segmented Output Image
Fig. 14: comparison between k Means and Fuzzy C Mean using Gabor Wavelet feature
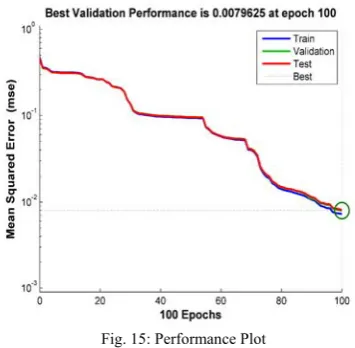
Fig. 15: Performance Plot
3) Performance Plot: The Figure.15 shows the
performance plot of the training record. Number of iteration is on X-axis and mean square error is on Y-axis. Mean square error reduces as number of iteration of training increases.
Classification of texture feature using supervised learning is giving a better segmentation of textured image
IV CONCLUSION
Gabor filtering gives the rotation invariant features. It is variant to texture at different scale. Gabor wavelet features are used for texture segmentation at different scale and orientation of textures. Clustering is an unsupervised classification technique. FCM clustering gives better result compare to K-means clustering in texture segmentation. Classification of texture feature using supervised learning is giving a better segmentation of textured image.
REFERENCES
[1] P. Brodatz. Textures: A Photographic Album for Artists and Designers. Dover, New York, 1966.
[2] S. Todorovic, N. Ahuja, “Texel-based texture segmentation,” Computer Vision, 2009 IEEE 12th International
Conference on , vol., no., pp.841-848, Sept. 29 2009-Oct.
[3] Naotoshi Seo, “Texture Segmentation using Gabor Filters”
ENEE731 Project, November 8, 2006.
[4] R. M. Haralick, K. Shanmugam, and I. Dinstein, “Textural features for image classification,” IEEE Trans. Systems Man Cybernet, 3(1), 1973, 610-621
[5] I. Dinstein, A. C. Fong, L. M. Ni, and K. Y. Wong, “Fast discrimination between homogneous and textured regions,” in Proceedings, 7th International Conference on Pattern Recognition,
Montreal, Canada, July 30-August 2, 1984. Pp. 361-363.
[6] G. h. Granlund, “Description of texture using the general operator approach, in Proceeding,” 5th International Conference on Pattern
Recognition, Miami Beach, Florida, December 1-4, 1980, pp.
776-779.
[7] S. Arivazhagan, L. Ganesan, “Texture segmentation using wavelet transform”, Pattern Recognition Letters, Volume 24, Issue 16, December 2003, Pages 3197-3203.
[8] Xiang-Fa Song, Zhi-Guo Chen, Cheng-Lin Wen, and Quan-Bo Ge, "Wavelet transform-based texture segmentation using feature smoothing," Machine Learning and Cybernetics, 2003 International
Conference on , vol.4, no., pp. 2370- 2373 Vol.4, 2-5 Nov. 2003.
[9] A.K. Jain, F. Farrokhnia, "Unsupervised texture segmentation using Gabor filters," Systems, Man and Cybernetics, 1990. Conference
Proceedings., IEEE International Conference on , vol., no.,
pp.14-19, 4-7 Nov 1990.T.
[10] A. Rakhlin and A. Caponnetto, “Stability of K-Means clustering”,
Advances in Neural Information Processing Systems, MIT Press,
Cambridge, MA, 2007, pp. 216–222.