ABSTRACT
ANAND, SHREY. Content-Based Creative Suggestions for User Queries. (Under the direction of Dr. Munindar P. Singh).
Existing information retrieval approaches focus on question answering, especially with respect to entity-based queries. However, users often have subtle information needs, such as to make sense of a knowledge space and to find paths through that space. These goals can be more important than obtaining answers when a user’s task is complex. In such cases, the user may not be able to formulate a precise query or there may be no definitive answer that would satisfy the user’s information need.
We therefore focus on the problem of suggesting questions instead of answers in response to a user question. A particular goal is to produce creative suggestions that are surprising to the user while retaining relevance to the user’s question: to draw the user’s interest to peripheral scenarios and to stimulate the user’s imagination.
We propose two metrics to evaluate the creativity of suggested queries:Relevance, to measure how much the suggestion set is related to the search intent of the user, andDiversity, to measure how different the suggestions are from the search intent of the user and other suggestions in the suggestion set.
© Copyright 2019 by Shrey Anand
Content-Based Creative Suggestions for User Queries
by Shrey Anand
A thesis submitted to the Graduate Faculty of North Carolina State University
in partial fulfillment of the requirements for the Degree of
Master of Science
Computer Science
Raleigh, North Carolina
2019
APPROVED BY:
Dr. Collin F. Lynch Dr. David L. Roberts
DEDICATION
BIOGRAPHY
ACKNOWLEDGEMENTS
I would like to thank my advisor Professor Munindar P. Singh for his guidance and support through-out the project. He was always involved in my work and helped me in formulating and executing ideas. I hope to continue collaborating with him and learn from his experience, dedication, and work ethic.
I am sincerely thankful to my advisory committee, Dr. Collin F. Lynch and Dr. David L. Roberts, for their suggestions. I would also like to thank Dr. Nirav Ajmeri for his constant support. He introduced me to good research practices that helped me improve the quality of the project.
A special thanks to my friends who participated in the user study: Kavya Bhardwaj, Anshul Atriek, Shivam Chamoli, Kapil Chopra, Kalyan Ghosh, Hui Guo, Zhen Guo, Amanul Haque, Vidhisha Jaswani, Siddharth Lalwani, Shashank Makkar, Mohit Satarkar, Chakshu Singla
TABLE OF CONTENTS
LIST OF TABLES . . . vi
LIST OF FIGURES. . . vii
Chapter 1 INTRODUCTION . . . 1
1.1 Related Works . . . 2
1.1.1 Query Suggestion . . . 2
1.1.2 Metrics . . . 4
1.1.3 Application in Analytics . . . 4
Chapter 2 Framework. . . 6
2.1 MS MARCO Dataset . . . 8
2.2 Query Representation . . . 8
2.3 Metrics . . . 8
2.3.1 Relevance . . . 9
2.3.2 Diversity . . . 10
2.4 Suggestion Methods . . . 10
2.4.1 Naïve . . . 10
2.4.2 Sampling . . . 11
2.4.3 Bi-Criteria Optimization: Maximal Marginal Relevance (MMR) . . . 12
2.4.4 Bi-Criteria Optimization: F-Maximal Marginal Relevance (FMMR) . . . 12
Chapter 3 Results and Discussion . . . 14
3.1 Method Evaluation . . . 14
3.1.1 Impact of parameterk andλ. . . 14
3.1.2 Comparison . . . 15
3.2 Qualitative . . . 18
3.3 User Study . . . 18
3.3.1 Study Design . . . 21
3.3.2 Inter-Annotator Agreement . . . 23
3.4 Metric Correlations . . . 23
3.5 Conclusion . . . 24
3.6 Limitations and Future Directions . . . 26
BIBLIOGRAPHY . . . 27
APPENDIX . . . 32
LIST OF TABLES
Table 1.1 Example query and associated document excerpts . . . 2
Table 1.2 Related concepts. . . 3
Table 2.1 Dataset Statistics. . . 7
Table 3.1 Example suggestions . . . 19
Table 3.2 Definition and scale for ratings. . . 22
Table 3.3 Example response to instruct participants. . . 22
Table 3.4 Reasoning for the example response to instruct participants. . . 22
Table 3.5 Krippendorff’sαfor inter-annotator agreement. . . 23
Table 3.6 Spearman and Pearson correlation coefficients . . . 25
Table A.1 Krippendorff’sαfor full and reduced data. . . 34
LIST OF FIGURES
Figure 2.1 Creative query suggestion framework. . . 7
Figure 2.2 Query representation in two dimensions. . . 9
Figure 3.1 Metric values for the Naive method . . . 15
Figure 3.2 Metric values for the Sampling method . . . 16
Figure 3.3 Metric values for the MMR method . . . 16
Figure 3.4 Metric values for the FMMR method . . . 17
Figure 3.5 Performance comparison of all the methods. . . 17
Figure 3.6 Wordcloud for the example query . . . 18
Figure 3.7 Wordclouds for general and specific alternatives. . . 19
Figure 3.8 Wordclouds for sibling alternatives. . . 20
Figure 3.9 Wordclouds for associated alternatives. . . 20
Figure 3.10 Scatter plot of Relevance metric values and human ratings. . . 24
Chapter
1
INTRODUCTION
The information retrieval (IR) and question answering (QA) research communities focus on find-ing answers to entity-based queries such as “Where was Obama born” through knowledge banks and machine comprehension. However, users may require information that cannot be retrieved through simple queries. Consider the query: “why should alcohol be banned?” The web has various documents with opinions on the topic (Table 1.1) but there may not be a definitive correct answer.
Another case where searching for answers could be ineffective is when users formulate queries that do not match their intent. Formulating a query for the IR engine that would produce desired results is a complex task that requires human intelligence. The task is even more challenging in the initial stages of discovering new ideas for solving a problem. Often, for complex queries, users formulate several alternative queries to retrieve the desired results.
Practical techniques for idea formulation include the brainstorming exercise where participants collectively discuss and solve problems. Researchers have observed that the participants tasked with asking fresh questions rather than searching for solutions produce novel insights[Gregersen, 2018]. Drawing inspiration from Gregersen, we approach the problem of understanding user intent and delivering information from the perspective of asking questions instead of finding solutions.
Table 1.1Example query and associated document excerpts from MS MARCO dataset[Nguyen et al., 2016].
S. No. Document excerpts forfacts on why alcohol should be banned
1 ... Alcohol is not something like water, or air that is required to live on this earth ... 2 ... 11,000 people are KILLED each year in America just from Alcohol related car crashes ... 3 ... not be banned as it helps people to get jobs and keeps people in business ...
4 ... it serves no other purpose than to get people drunk and kill kids ... 5 ... draft legislation to provide a total ban is to be presented to Parliament ... 6 ... People would still find a way to buy and drink it ...
7 ... tax revenues would be lost if alcohol were banned ...
8 ... Alcohol can cause cardiovascular diseases, cancer, chronic lung disease and diabetes... 9 ... prohibition doesn’t work. It should work, but it doesn’t ....
10 ... draft legislation to provide a total ban is to be presented to Parliament ...
well.
In this work, we address two major research questions:
RQ1: What are the methods that produce creative suggestions for a user query?
RQ2: What are the metrics that evaluate creativity of the suggested queries?
For the example in Table 1.1, we may identify an alternative that reformulates the question of banning alcohol from a perspective of a similar historical event. For example, we identify an alternative query “what impact did prohibition have on the development of organized crime.” The alternative is not exactly similar to the input scenario but is based on it and benefits from knowledge of it. The transition from banning alcohol to an alternative that links the historical 18th U.S. constitutional amendment (better known as Prohibition) to organized crime guides the search in a new direction.
1.1
Related Works
1.1.1 Query Suggestion
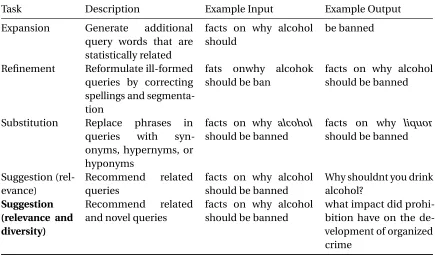
Query suggestion, like query expansion[Chirita et al., 2007; Cui et al., 2003; Theobald et al., 2005; Xu and Croft, 2017], query refinement[Guo et al., 2008; Kraft and Zien, 2004; Vélez et al., 1997], and query substitution[Jones et al., 2006]aims to improve queries submitted by the users[Ma et al., 2008]. Table 1.2 explains and contrasts these concepts with examples.
Table 1.2Related concepts.
Task Description Example Input Example Output
Expansion Generate additional query words that are statistically related
facts on why alcohol should
be banned
Refinement Reformulate ill-formed queries by correcting spellings and segmenta-tion
fats onwhy alcohok should be ban
facts on why alcohol should be banned
Substitution Replace phrases in queries with syn-onyms, hypernyms, or hyponyms
facts on why alcohol should be banned
facts on why liquor should be banned
Suggestion (rel-evance)
Recommend related queries
facts on why alcohol should be banned
Why shouldnt you drink alcohol?
Suggestion (relevance and diversity)
Recommend related and novel queries
facts on why alcohol should be banned
what impact did prohi-bition have on the de-velopment of organized crime
terms of the clicked URLs associated with them (query-URL bipartite graph). The distance between queries is measured through overlapping URLs in this approach. Beeferman and Berger[2000]; Li et al.[2008]use the query-URL graph with agglomerative clustering to find related queries for suggestion. Wen et al.[2001]combine information from the query-URL graph and query terms for clustering. Ma et al.[2008]combine user-query and query-URL graphs for recommending similar queries.
Several works approach query suggestion based on the session data, which is a collection of queries submitted by the users as an attempt to refine the query. The aim is to develop models that predict the next query through learned embeddings of the query text[Ahmad et al., 2018; Song et al., 2017; Sordoni et al., 2015].
Although useful, the similarity-based approaches may have a tendency of developing “echo chambers”[Jamieson and Cappella, 2008]where methods repetitively show the same informa-tion, therby insulating users from potential alternatives. We aim to suggest queries that allow for alternative and competing ideas through an emphasis on peripheral scenarios.
present in the documents associated with queries. With the advancement in information retrieval, appropriate sections of documents can be effectively mapped to a query. In our work, we represent queries through the rich semantic information present in document excerpts to recommend relevant and novel alternatives.
1.1.2 Metrics
Query suggestion frameworks are generally evaluated using metrics that compare either ranks or word-overlaps of predicted and ground-truth suggestions. The ground-truth suggestions are assumed to be the next query issued by the user in a session[Ahmad et al., 2018]. A popular choice for rank comparison is Mean Reciprocal Rank (average of reciprocal ranks of predicted queries). Bi-Lingual Evaluation Understudy (BLEU)[Papineni et al., 2002], Recall Oriented Understudy for Gisting Evaluation (ROUGE)[Lin, 2004], and their variants use word-overlap to compare the quality of the suggestions. BLEU is a modified version of precision where the number of times each n-gram in the predicted query is considered is clipped by the frequency of the n-gram in the ground-truth query. ROUGE computes the fraction of groud-truth query’s n-grams present in the predicted query’s n-grams. These metrics are indicative of similarity between the predictions and the ground truth but they assume availability of the ground truth and do not capture relevance and novelty of the suggestions.
Recommendation systems require metrics other than the classical measures of accuracy, preci-sion, and recall. Herlocker et al.[2004]address the need for quality metrics that capture novelty in recommendation systems so that algorithms can make suitable trade-offs with accuracy metrics. McNee et al.[2002]rate their recommendation systems through human validation on the scale of usefulness, novelty, and quality without the definition of an explicit metric. Zhang et al.[2012] define the metric “serendipity” that represents unusualness or surprise in their work on music recommendation. Along the lines of distance-based novelty by Vargas and Castells[2011], Zhang et al.[2012]define serendipity as the distance between user history and the recommendations. In this study, we define metrics for relevance and diversity in terms of a representation derived from user queries.
1.1.3 Application in Analytics
Experiments have shown that, given a problem, typical subjects produce fewer than a fifth of the acceptable hypotheses[Mehle, 1982]with an overconfidence bias[Gettys et al., 1979]. As a result, several tools have been developed for aiding analysts in hypothesis generation. Broadly, current computational approaches can be categorized into knowledge-based reasoning systems and sensemaking systems. The former approach uses a case-specific knowledge base with a predefined representation to infer and rank hypotheses[Adams and Goel, 2007; Keppens and Schafer, 2006]. On the contrary, sensemaking tools structure, record, and visualize the problem, usually without a reasoning model[Shrinivasan and van Wijk, 2008; Stasko et al., 2008; Wright et al., 2006].
Chapter
2
Framework
We design a framework for suggesting creative alternative queries (Figure 2.1). Algorithm 1 summa-rizes the steps in the framework. We begin with a user query and topmrelevant document excerpts that may answer the query. Then, we represent the query through vector embeddings trained on a knowledge base of query to document mapping (Section 2.1). After representing the queries, we define metrics that can evaluate suggestions for an input query (Section 2.3). Finally, we define methods that estimate a query function f that aims to select suggestions that are relevant and diverse (Section 2.4).
Algorithm 1:Creative query suggestion framework
input :Knowledge base (K B) of the mapping from queries (Q) to relevant documents (D)
K B:Q→D, User query (q) output :Suggested queries (R)
1 Dm←topmrelevant documents that may answerq 2 Dm v←embedding(Dm)
3 Represent queries:qv←mean vector ofDm v
4 Compute the candidate setC ←nnearest neighbors ofqv
5 ComputeR←f(qv,C)wheref is the query function that retrieves and ranks the set of
suggested queries (R)
d1 d2 dk
q'1 q'2 q'm Query (q)
Representation
Query - Document mapping
Suggestion Method Search Engine
and Information Retrieval
Suggestions (q')
Metric
Figure 2.1Creative query suggestion framework.
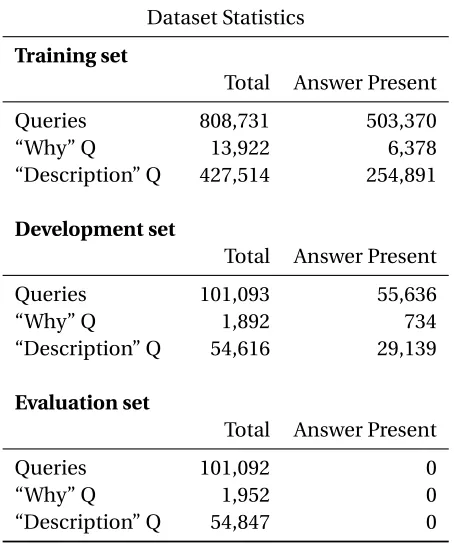
Table 2.1Dataset Statistics.
Dataset Statistics
Training set
Total Answer Present
Queries 808,731 503,370
“Why” Q 13,922 6,378
“Description” Q 427,514 254,891
Development set
Total Answer Present
Queries 101,093 55,636
“Why” Q 1,892 734
“Description” Q 54,616 29,139
Evaluation set
Total Answer Present
Queries 101,092 0
“Why” Q 1,952 0
2.1
MS MARCO Dataset
MS MARCO or Microsoft MAchine Reading COmprehension is a dataset of anonymized Bing and Cortana queries[Nguyen et al., 2016]. Along with the queries, the dataset contains an average of 10 shuffled document excerpts for each query that may contain the answer. We use the termpassages as in the dataset while referring to document excerpts. These passages and their hyperlinks are extracted through Bing’s information retrieval engine. If one (or more) of the passages contain the answer to the query, human annotators flag the passages. For queries that cannot be answered using the given information, the answer field is set to “No Answer Present.” In addition, through a classifier, each query is tagged with a type:numeric,entity,location,person, ordescription. For our study, we focus on thedescriptioncategory queries because they seek explanations that may not be straightforward. Table 2.1 provides the statistics of the dataset.
2.2
Query Representation
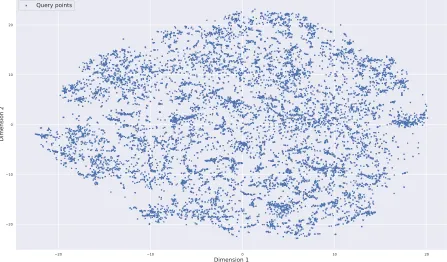
Representing queries through feature vectors allows computational methods to find similar and different queries. Instead of query-URL bipartite graphs or query terms, we focus on the rich se-mantic information present in documents associated with the query. We use a 100 dimensional paragraph vector (doc2vec) to represent each document excerpt. To learn a representation, the doc2vecapproach uses a Distributed Memory Model of Paragraph Vectors (PV-DM) trained on all the document words and their IDs[Le and Mikolov, 2014]. For representing the query, we use the mean vector of all its associated documents. The intuition behind this approach is that the mean vector of the documents captures the intent of query. Figure 2.2 visualizes representation of a sample set of 10,000 queries in two dimensions using t-SNE[Maaten and Hinton, 2008]. We use this representation to build the candidate set (C), i.e., a set ofnnearest neighbors (based on cosine distance) from the query. Since we use vectors derived from textual data, we define the distance between them through cosine of the vectors following standard practice[Mikolov et al., 2013].
2.3
Metrics
20 10 0 10 20
Dimension 1
20 10 0 10 20
Dimension 2
Query points
Figure 2.2Representation of a subset of queries in MS MARCO. The two dimensional figure visualizes the distance between the queries in the vector space. Semantically similar queries are closer to each other.
The metrics rely on the query representation but are method agnostic, i.e., they can rate a set of suggestions produced by any method.
2.3.1 Relevance
In recommendation and information retrieval models, the notion of relevance is usually measured through accuracy and precision over the ground-truth user data[Herlocker et al., 2004]. In our case, since we have contextual information from document excerpts instead of user ratings and interactions, we define Relevance based on the representation of the query. The intuition is that queries similar to the user query conform to the search intent of the user and thus are relevant.
Definition 2.3.1(Relevance). A relevant query set contains queries that are similar to the user query.
Relevance= 1
|R| X
i∈R
cos(qv,qvi) (2.1)
2.3.2 Diversity
We begin with understanding novelty as it maps directly to the originality aspect of creativity. The English wordnoveltyis defined as “something new or unusual.” Quantifying novelty is complicated because to defineneworunusualthere has to be something old and usual. In other words, for the task of query suggestion, defining novelty requires a frame of reference. Ideally, the domain knowledge of the user who formulated the query would be the frame of reference for defining a metric for novelty. Practically, obtaining domain knowledge of the user is challenging. Since we do not have access to such data, we use diversity as a surrogate for novelty. The difference between novelty and diversity is subtle. If the frame of reference for novelty is the suggestion set itself, i.e., a suggestion is novel if it is different from the other elements of the set, then the aggregated novelty of the set is termed as diversity[Castells et al., 2015].
We define the diversity of a set as the average distance between its elements and the user query. Along the lines of the metricIntra List Distance[Smyth and McClave, 2001], Diversity computes the pairwise distance between the recommended queries and the user query.
Definition 2.3.2(Diversity). A diverse query set contains queries that are different from each other and the user query.
Diversity=1− 1 |R0|(|R0| −1)
X
i∈R0 X
j∈R0
cos(qvi,qvj) (2.2)
where,qvi andqvj are the mean vectors of theit h andjt hsuggested queries’ passage, andR0is union of the set of suggested queries and user queryq.
2.4
Suggestion Methods
We experiment with four methods that produce Topk creative suggestions. Each method has a tunable parameterλthat facilitates a trade-off between objectives for relevance and diversity, that is, the methods return recommendations that contain highly relevant queries whenλ=1, and recommendations that are highly diverse whenλ=0.
2.4.1 Naïve
Algorithm 2:Naïve
input :Orginal query (q), candidate set (C), the number of suggestions (k), parameter (λ) output :Recommended queries (R)
1 S←sortC in a decreasing order of similarity withq 2 c←n×(1−λ)
3 R←Si:i∈[c−k/2,c+k/2] 4 returnR
2.4.2 Sampling
Beeferman and Berger[2000]use agglomerative clustering to group queries through the associated URLs to suggest related queries within the cluster. Boim et al.[2011]cluster the candidate set to find the most representative points from each cluster promoting diversity in a collaborative filtering item recommender. We adapt these approaches to our problem of finding relevant and diverse queries. Sampling (Algorithm 3) groups the candidate set intok clusters of similar queries using agglomerative clustering. This approach diversifies the suggestions by sampling one query from each cluster. Within each cluster, we sort the queries in decreasing order of similarity with the user query. As for the naïve method, the parameterλdetermines the query that is selected. If the value ofλis 1, the query closest to the user query is selected from each cluster. If the value is 0, then the query farthest to the user query is selected from each cluster.
Algorithm 3:Cluster Sampling
input :Orginal query (q), candidate set (C), the number of suggestions (k), parameter (λ) output :Recommended queries (R)
1 A←Set ofkclusters forC
2 R←φ
3 foreacha∈Ado
4 S←sort clusterain a decreasing order of similarity withq 5 i←l×(1−λ)wherel is the length of the clustera
6 R←R∪ {si}
2.4.3 Bi-Criteria Optimization: Maximal Marginal Relevance (MMR)
The bi-criteria optimization method, MMR, was introduced by Carbonell and Goldstein[1998]. Such objective functions are frequently used for diversification tasks[Boudin et al., 2008; Gollapudi and Sharma, 2009; Zhu et al., 2011]. Since we use diversity as a surrogate for novelty, we want to obtain result sets that are diverse while retaining the relevance to the user query. MMR (Algorithm 4) uses an objective function that incorporates components for both relevance and diversity. It successively builds the recommendation set (S) using the objective function described in Equation 2.3. When the parameterλis close to 1, the method focuses on similarity with the user query and when it is close to 0, the method focuses on the diversity of the suggestion list.
f =max ci∈C
λs i m(ci,q)−(1−λ)max sj∈S
(s i m(ci,sj))
(2.3)
whereq is the user query,Sis the subset of queries already selected for recommendation,C is the candidate set of queries.
Algorithm 4:Bi-Criteria Optimization: MMR
input :User query (q), candidate set (C), the number of suggestions (k), parameter (λ) output :Suggested queries (R)
1 S←φ
2 while|S|<k do
3 Compute cos(q,ci)whereQi∈C
4 Find maximum cos(ci,sj)for allci∈C andsj ∈S
5 Compute objective function (Equations 2.3) for eachci∈C 6 q0←query corresponding to max objective function 7 S←S∪ {q0}
8 C←C \ {q0}
9 R←S
10 returnR
2.4.4 Bi-Criteria Optimization: F-Maximal Marginal Relevance (FMMR)
instead of optimizing them individually. If we setλas 0.5, the function finds queries that have equally high values for both of the criteria. The motivation for this method is derived from the optimization of F-measure for precision and recall[Musicant et al., 2003].
Algorithm 5:Bi-Criteria Optimization: FMMR
input :User query (q), candidate set (C), the number of suggestions (k), parameter (λ) output :Suggested queries (R)
1 S←φ
2 while|S|<k do
3 Compute cos(q,ci)whereQi∈C
4 Find maximum cos(ci,sj)for allci∈C andsj ∈S
5 Compute objective function (Equations 2.4) for eachci∈C 6 q0←query corresponding to max objective function 7 S←S∪ {q0}
8 C←C \ {q0}
9 R←S
10 returnR
f =max ci∈C
1
λ
s i m(ci,q)+
(1−λ) maxs j∈S(1−s i m(ci,sj))
Chapter
3
Results and Discussion
In this chapter, we describe our experiments and discuss our results. Sections 3.1 compares the performance of the methods and Section 3.2 presents qualitative results for an example query. Section 3.3 describes the user study and reports the inter-annotator agreement. In Section 3.4, we present the correlation between the human scores and the metric scores. We conclude our discussion and list future works in Sections 3.5 and 3.6.
3.1
Method Evaluation
In this section, we investigate RQ1:What are the methods that produce creative suggestions for a user query?We vary the parameterλandk to observe each method and then compare them using the Relevance and Diversity metrics.
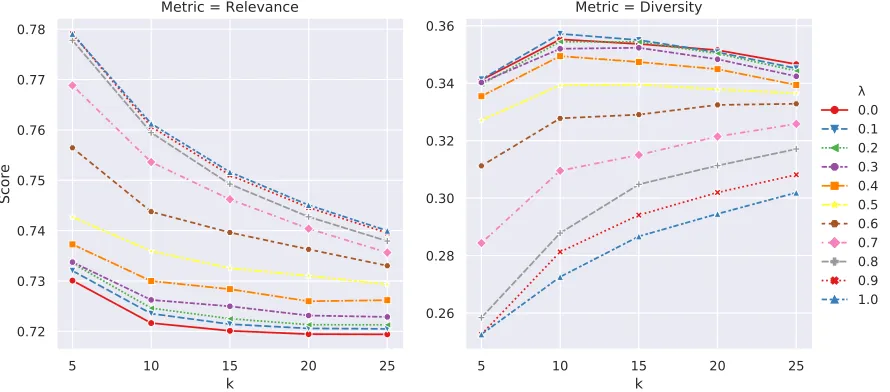
3.1.1 Impact of parameterk andλ
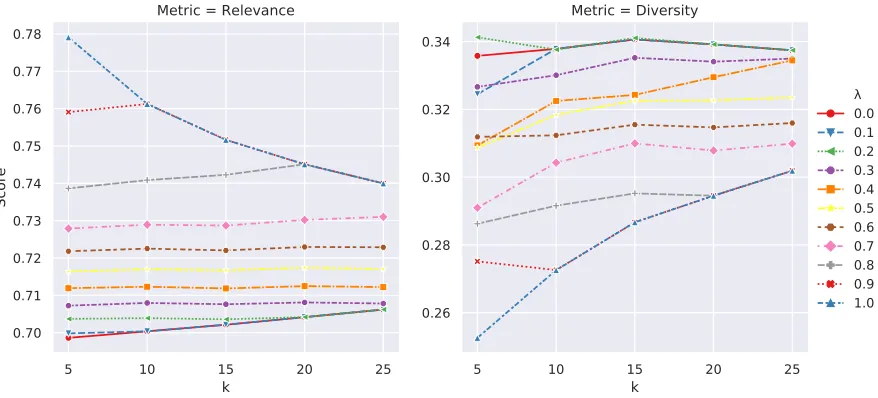
We set up an experiment to observe the behavior of the methods described in Section 2.4. We set
n=50 and varyk ∈[5, 10, 15, 20, 25]andλ∈[0, 1]with a step size of 0.1. Figures 3.1, 3.2, 3.3, and 3.4 illustrate the behavior of each method for different values ofλandk. In all the methods, changing theλvalue reflects the trade-off between the Relevance and Diversity scores, i.e., at low values ofλ, the Relevance metric score is low and Diversity metric score is high. Similarly, at high values ofλ, the Relevance metric score is high and the Diversity metric score is low.
retrieving relevant suggestions and thus the overall Relevance score (Figures 3.1 and 3.2). MMR and FMMR preserve the downward trend as they are built successively (Figures 3.3 and 3.4). For the Diversity metric, we observe an opposite trend. In the Sampling and Nai¨ve methods, Diversity decreases withk for lower values ofλand increases for higher values ofλ. For MMR and FMMR methods with low values ofλ, Diversity first increases and then decreases due to the addition of less novel instances in the recommendation set. These trends highlight the similarities and the differences between the outputs of the methods.
5 10 15 20 25
k
0.70 0.71 0.72 0.73 0.74 0.75 0.76 0.77 0.78Score
Metric = Relevance
5 10 15 20 25
k
0.26 0.28 0.30 0.32 0.34Metric = Diversity
0.0 0.1 0.2 0.3 0.4 0.5 0.6 0.7 0.8 0.9 1.0
Figure 3.1Relevance and the Diversity metric scores for the Naive method. For values ofλ <0.8, askis increased, Relevance and Diversity scores show a constant trend approximately. For higher values ofλ, as
kis increased, Relevance score decreases and Diversity score increases.
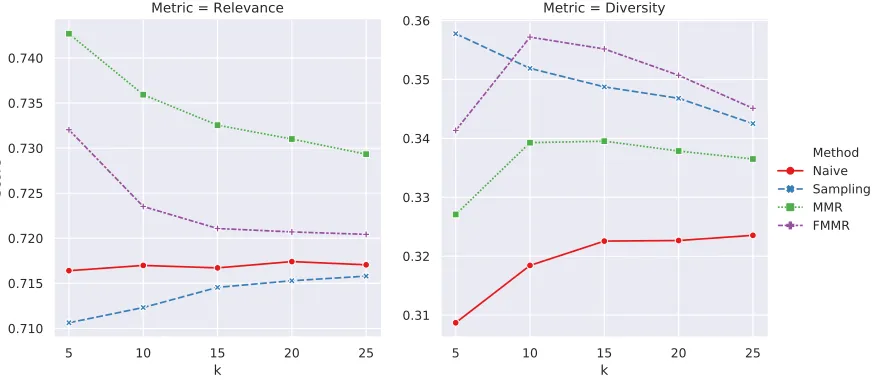
3.1.2 Comparison
5 10 15 20 25
k
0.705 0.710 0.715 0.720 0.725 0.730 0.735Score
Metric = Relevance
5 10 15 20 25
k
0.330 0.335 0.340 0.345 0.350 0.355 0.360Metric = Diversity
0.0 0.1 0.2 0.3 0.4 0.5 0.6 0.7 0.8 0.9 1.0
Figure 3.2Relevance and the Diversity metric scores for the Sampling method. For values ofλ <0.7, as
kis increased, Relevance score increases and Diversity score decreases. For higher values ofλ, askis increased, Relevance score decreases and Diversity score increases approximately.
5 10 15 20 25
k
0.72 0.73 0.74 0.75 0.76 0.77 0.78Score
Metric = Relevance
5 10 15 20 25
k
0.26 0.28 0.30 0.32 0.340.36
Metric = Diversity
0.0 0.1 0.2 0.3 0.4 0.5 0.6 0.7 0.8 0.9 1.0
Figure 3.3Relevance and the Diversity metric scores for the MMR method. Askis increased, Relevance score decreases. For values ofλ <0.5, Diversity score first increases and then decreases. For values of
5 10 15 20 25
k
0.72 0.73 0.74 0.75 0.76 0.77 0.78Score
Metric = Relevance
5 10 15 20 25
k
0.26 0.28 0.30 0.32 0.340.36
Metric = Diversity
0.0 0.1 0.2 0.3 0.4 0.5 0.6 0.7 0.8 0.9 1.0
Figure 3.4Relevance and the Diversity metric scores for the FMMR method. Askis increased, Relevance score decreases and Diversity score first increases and then decreases. Forλ=1, Diversity score increases with increase ink.
5 10 15 20 25
k 0.710 0.715 0.720 0.725 0.730 0.735 0.740 Score
Metric = Relevance
5 10 15 20 25
k 0.31 0.32 0.33 0.34 0.35
0.36 Metric = Diversity
Method Naive Sampling MMR FMMR
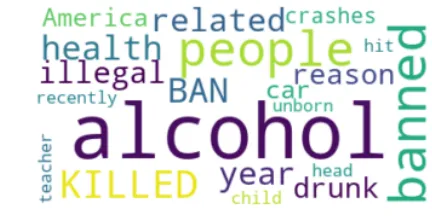
Figure 3.6Wordcloud for the example query:facts on why alcohol should be banned.
3.2
Qualitative
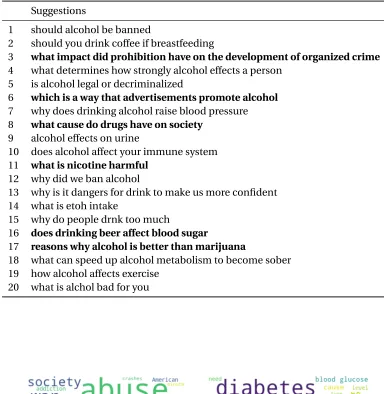
For our introductory example, Figure 3.6 shows the wordcloud of the top 10 retrieved documents. We analyze some of the interesting suggestions produced by the FMMR method. The user-written suggestions, listed in Table 3.1, link to wordclouds that cover different aspects of the knowledge space. The suggestion “does drinking beer affect blood sugar” talks aboutbeerand specific effects of alcohol. On the contrary, the example “what cause do drugs have on society?” is interesting because alcoholis a type ofdrug. The alternative can be related as a parent class of the input query and such a generalized suggestion can be useful (Figure 3.7). Similarly, the example “why is nicotine harmful?” aboutnicotinecan be related as a sibling class of the input query. The example “reasons why alcohol is better than marijuana” compares two sibling classes, i.e.,alcoholandmarijuana(Figure 3.8). In some examples, the relationship between the suggestion and the input query can be more subtle and thus surprising. For instance, the alternative “which is a way that advertisements promote alcohol” links to advertisements and promotion of alcohol. Another interesting alternative, “what impact did prohibition have on the development of organized crime,” links a historical event to the query that could direct the users towards case studies (Figure 3.9). The transition from banning alcohol to alternatives with subtle relationships that are surprising guides the search in a new direction.
3.3
User Study
Table 3.1Example user-written suggestions for the query:Why should alcohol be banned?
Suggestions
1 should alcohol be banned
2 should you drink coffee if breastfeeding
3 what impact did prohibition have on the development of organized crime 4 what determines how strongly alcohol effects a person
5 is alcohol legal or decriminalized
6 which is a way that advertisements promote alcohol 7 why does drinking alcohol raise blood pressure 8 what cause do drugs have on society
9 alcohol effects on urine
10 does alcohol affect your immune system 11 what is nicotine harmful
12 why did we ban alcohol
13 why is it dangers for drink to make us more confident 14 what is etoh intake
15 why do people drnk too much
16 does drinking beer affect blood sugar
17 reasons why alcohol is better than marijuana
18 what can speed up alcohol metabolism to become sober 19 how alcohol affects exercise
20 what is alchol bad for you
(a)Suggestion about effects of drugs on soci-ety. User query: what cause do drugs have on society.
(b)Suggestion about beer and its effect on blood sugar. User query: does drinking beer affect blood sugar.
(a)Suggestion about nicotine. User query: what is nicotine harmful.
(b)Suggestion that compares alcohol and marijuana. User query: reasons why alcohol is better than marijuana.
Figure 3.8Wordclouds for sibling alternatives.
(a)Suggestion about how advertisements promote alcohol. User query: which is a way that advertisements promote alcohol.
(b)Suggestion about how Prohibition im-pacted organised crime. User query: what impact did prohibition have on the develop-ment of organized crime.
We used the wordsurprisalinstead ofnoveltyas the latter is perceived in conjunction with relevance. In a separate pilot, we observed that participants rate an alternative high onnoveltyonly if it is also relevant.
3.3.1 Study Design
We selected 10 sample queries and designed the study using the following procedure:
• Fetch all thewhyquestions since they are reasoning based questions and they may not have straightforward answers.
• Remove entity specific questions using Stanford’s NER.[Finkel et al., 2005], i.e., questions concerning a particular person, date, or an organization.
• Fetch 200 random queries from the list.
• Select 10 queries that are from different topics and easy to understand for the users in the study.
• Retrieve 50 alternatives for each query and shuffle their order.
• Provide keywords for each alternative to help the participants understand the intent of the alternative.
• For difficult words and concepts, provide web links to the participants.
Instructions to Participants
You will be presented with a query and its keywords.
Example: “facts on why alcohol should be banned” Keywords:alcohol, banned
Rating Alternative Queries:
• Read and understand each alternative query and its keywords
• Rate each alternative on two measures: relevance and surprisal (Table 3.2)
Table 3.2Definition and scale for ratings.
Relevance Surprisal
Definition A relevant query will be semantically similar to the original query
A surprising query will be new and unex-pected with respect to the original query
Scale
Very relevant Relevant
Neither relevant nor not relevant Not relevant
Not at all relevant
Very surprising Surprising
Neither surprising nor not surprising Not surprising
Not at all surprising
Table 3.3Example response to instruct participants.
Alternative Query Keywords Relevance (sim-ilarity)
Surprisal (unex-pectedness)
1 what impact did prohibi-tion have on the develop-ment of organized crime
prohibition, orga-nized crime
Very relevant Very surprising
2 why did we ban alcohol alcohol, ban Very relevant Not at all sur-prising
3 how do we know if smoking causes lung cancer?
smoking, lung can-cer
Not at all rele-vant
Very surprising
4 is alcohol a depressant Alcohol, depressant Relevant Surprising
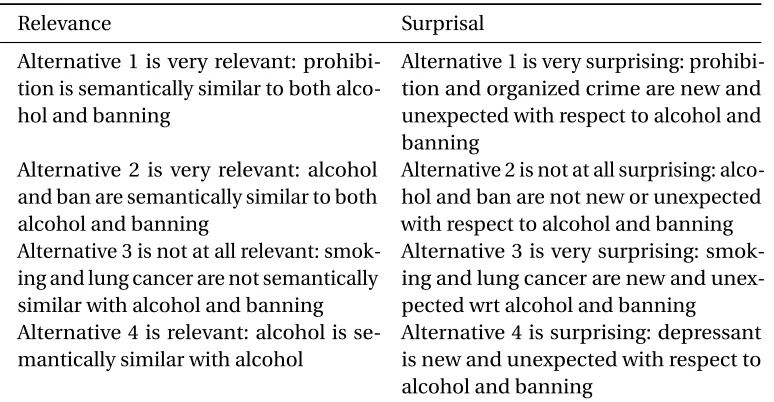
Table 3.4Reasoning for the example response to instruct participants.
Relevance Surprisal
1 Alternative 1 is very relevant: prohibi-tion is semantically similar to both alco-hol and banning
Alternative 1 is very surprising: prohibi-tion and organized crime are new and unexpected with respect to alcohol and banning
2 Alternative 2 is very relevant: alcohol and ban are semantically similar to both alcohol and banning
Alternative 2 is not at all surprising: alco-hol and ban are not new or unexpected with respect to alcohol and banning 3 Alternative 3 is not at all relevant:
smok-ing and lung cancer are not semantically similar with alcohol and banning
Alternative 3 is very surprising: smok-ing and lung cancer are new and unex-pected wrt alcohol and banning
4 Alternative 4 is relevant: alcohol is se-mantically similar with alcohol
3.3.2 Inter-Annotator Agreement
We compute the inter-annotator agreement among the participants using the Krippendorff’s alpha [Krippendorff, 2011]since it is generalizable across different scales and accommodates more than two annotators[Hallgren, 2012]. The minimum acceptable value of the metric is 0.67[Krippendorff, 2018]and all of the queries have a score less than that. The disagreement between the participants is because of the difference in their understanding of the notion of relevance and surprisal. For example, for the query, “why using less energy is good,” the alternative “why is it necessary to use energy saving bulbs” receives polar opposite ratings for surprisal. Second, the use of a Likert scale can distort the true ratings because of central tendency biases and personality traits[Baron, 1996].
For the analysis, we take the median ratings of all the participants. In Appendix A, we also show the results for a reduced dataset with the best pair of raters for a query.
Table 3.5Krippendorff’sαfor inter-annotator agreement.
S. No. Query Relevanceα Surprisalα
1 why is economic security important 0.324 0.356 2 which theory of why we sleep explains
why we sleep when we do
0.058 0.205
3 why do honey bees pollinate plants 0.529 0.439 4 why do we need fiber in our diet 0.425 0.640 5 reasons why primary sources aren’t
reli-able
0.010 0.175
6 why should medical marijuana be legal-ized
0.409 0.274
7 why using less energy is good 0.089 0.003
8 why did the civil rights movement use nonviolence
0.068 -0.112
9 why pilgrims migrated to america 0.350 0.195
10 why is reasoning important 0.281 0.168
3.4
Metric Correlations
In this section, we evaluate the Relevance and the Diversity metrics defined in response to RQ2: What are the metrics that evaluate creativity of the suggested queries?
setn=50,k=5, andλ∈[0, 1](with a step size of 0.1) to retrieve suggestions for all the 10 queries in our experiments. Then, we average human scores for each set of suggestions and compute the Spearman and Pearson correlation coefficients for the metric and the human scores. Table 3.6 shows correlation coefficients of Relevance and Diversity metrics with human scores. For the ordinal data obtained from the Likert scale, Spearman coefficient makes less assumptions and thus could be a better indicator of correlation[Spearman, 1904]. The positive correlation indicates that the metrics cohere with the human intuition of relevance and surprisal (Figures 3.10 and 3.11).
0.3
0.4
0.5
0.6
0.7
0.8
0.9
1.0
Human
0.650
0.675
0.700
0.725
0.750
0.775
0.800
0.825
0.850
Metric
Model
MMR
FMMR
Naive
Sampling
Figure 3.10Scatter plot of Relevance metric values and human ratings.
3.5
Conclusion
0.2
0.3
0.4
0.5
0.6
0.7
0.8
Human
0.15
0.20
0.25
0.30
0.35
0.40
0.45
Metric
Model
MMR
FMMR
Naive
Sampling
Figure 3.11Scatter plot of Diversity metric values and human ratings.
Table 3.6Spearman and Pearson correlation coefficients for the metrics and the human scores (all values are statistically significant, i.e.,p<0.05).
Method Spearman Pearson
Relevance Diversity Relevance Diversity
Naive 0.432 0.521 0.482 0.589
Sampling 0.280 0.376 0.340 0.413
MMR 0.497 0.694 0.544 0.731
FMMR 0.326 0.581 0.407 0.658
All 0.424 0.589 0.484 0.653
3.6
Limitations and Future Directions
An important aspect of our framework is the query representation which can be a basis for more extensive experimentation. A better query representation that captures the intent of the query and the documents could result in better candidates and suggestions. Recently, researches have introduced advanced language representation models[Devlin et al., 2019; Radford et al., 2019]. We plan to experiment with such representations to improve the quality of the suggestion sets for the input query.
BIBLIOGRAPHY
Summer Adams and A. Goel. Making sense of VAST data. InProceedings of IEEE Conference on Intelligence and Security Informatics, pages 270–273. IEEE, 2007.
Wasi U. Ahmad, Kai-Wei Chang, and Hongning Wang. Multi-task learning for document ranking and query suggestion. InInternational Conference on Learning Representations, 2018. URL
https://openreview.net/forum?id=SJ1nzBeA-
.Helen Baron. Strengths and limitations of ipsative measurement. Journal of Occupational and Organizational Psychology, 69(1):49–56, Mar 1996.
Doug Beeferman and Adam Berger. Agglomerative clustering of a search engine query log. In Proceedings of the 6th ACM SIGKDD International Conference on Knowledge Discovery and Data Mining, pages 407–416. ACM, 2000.
Rubi Boim, Tova Milo, and Slava Novgorodov. Diversification and refinement in collaborative filtering recommender. InProceedings of the 20th ACM International Conference on Information and Knowledge Management, pages 739–744. ACM, 2011.
Florian Boudin, Marc El-Bèze, and Juan-Manuel Torres-Moreno. A scalable mmr approach to sentence scoring for multi-document update summarization. InProceedings of the 22nd Inter-national Conference on Computational Linguistics (Companion volume: Posters and Demon-strations), pages 23–26, 2008.
Jaime G. Carbonell and Jade Goldstein. The use of mmr and diversity-based reranking for reodering documents and producing summaries. InProceedings of the 21st Meeting of International ACM SIGIR Conference, pages 335–336, 1998.
Pablo Castells, Neil J. Hurley, and Saul Vargas. Novelty and diversity in recommender systems. In Recommender Systems Handbook, pages 881–918. Springer, 2015.
Paul-Alexandru Chirita, Claudiu S. Firan, and Wolfgang Nejdl. Personalized query expansion for the web. InProceedings of the 30th Annual International ACM SIGIR Conference on Research and Development in Information Retrieval, pages 7–14. ACM, 2007.
Hang Cui, Ji-Rong Wen, Jian-Yun Nie, and Wei-Ying Ma. Query expansion by mining user logs.IEEE Transactions on Knowledge and Data Engineering, 15(4):829–839, Jul 2003.
Jacob Devlin, Ming-Wei Chang, Kenton Lee, and Kristina" Toutanova. BERT: Pre-training of deep bidirectional transformers for language understanding. InProceedings of the Conference of the North American Chapter of the Association for Computational Linguistics: Human Language Technologies, volume 1, pages 4171–4186. Association for Computational Linguistics, Jun 2019. URL
https://www.aclweb.org/anthology/N19-1423
.Mouzhi Ge, Carla Delgado B., and Dietmar Jannach. Beyond accuracy: Evaluating recommender systems by coverage and serendipity. InProceedings of the 4th ACM Conference on Recommender Systems, pages 257–260. ACM, 2010.
Charles Gettys, Tom Mehle, Suzanne Baca, Stanley Fisher, and Carol Manning. A memory retrieval aid for hypothesis generation. Technical report, Oklahoma University Norman Decision Process Lab, 1979.
Sreenivas Gollapudi and Aneesh Sharma. An axiomatic approach for result diversification. In Proceedings of the 18th International Conference on World Wide Web, pages 381–390. ACM, 2009.
Hal Gregersen. Better brainstorming. Harvard Business Review, Mar 2018. URL
https://hbr.
org/2018/03/better-brainstorming
.Jiafeng Guo, Gu Xu, Hang Li, and Xueqi Cheng. A unified and discriminative model for query refinement. InProceedings of the 31st Annual International ACM SIGIR Conference on Research and Development in Information Retrieval, pages 379–386. ACM, 2008.
Kevin A. Hallgren. Computing inter-rater reliability for observational data: an overview and tutorial. Tutorials in Quantitative Methods for Psychology, 8(1):23, Jul 2012.
Jonathan L. Herlocker, Joseph A. Konstan, Loren G. Terveen, and John T. Riedl. Evaluating collabora-tive filtering recommender systems.ACM Transactions on Information Systems (TOIS), 22(1): 5–53, Jan 2004.
Kathleen H. Jamieson and Joseph N. Cappella.Echo chamber: Rush Limbaugh and the Conservative Media Establishment. Oxford University Press, 2008.
Sheriff Jolaoso, Russ Burtner, and Alex Endert. Toward a deeper understanding of data analysis, sensemaking, and signature discovery. InProceedings of Human-Computer Interaction, pages 463–478. Springer, 2015.
Rosie Jones, Benjamin Rey, Omid Madani, and Wiley Greiner. Generating query substitutions. In Proceedings of the 15th International Conference on World Wide Web, pages 387–396. ACM, 2006.
Jeroen Keppens and Burkhard Schafer. Knowledge based crime scenario modelling.Expert Systems with Applications, 30(2):203–222, Feb 2006.
Reiner Kraft and Jason Zien. Mining anchor text for query refinement. InProceedings of the 13th International Conference on World Wide Web, pages 666–674. ACM, 2004.
Klaus Krippendorff. Computing krippendorff’s alpha-reliability, Jan 2011. URL
https://
repository.upenn.edu/asc_papers/43/
.Klaus Krippendorff.Content Analysis: An Introduction to its Methodology. Sage Publications, 2018.
Lin Li, Zhenglu Yang, Ling Liu, and Masaru Kitsuregawa. Query-url bipartite based approach to personalized query recommendation. InProceedings of Association for the Advancement of Artificial Intelligence, volume 8, pages 1189–1194, 2008.
Chin-Yew Lin. Rouge: A package for automatic evaluation of summaries. InProceedings of the ACL Workshop, Text Summarization Branches Out, pages 74–81, 2004.
Hao Ma, Haixuan Yang, Irwin King, and Michael R. Lyu. Learning latent semantic relations from click-through data for query suggestion. InProceedings of the 17th ACM Conference on Information and Knowledge Management, pages 709–718. ACM, 2008.
Laurens van der Maaten and Geoffrey Hinton. Visualizing data using t-SNE.Journal of Machine Learning Research, 9:2579–2605, Nov 2008.
Yossi Matias, Dvir Keysar, Gal Chechik, Ziv Bar-Yossef, and Tomer Shmiel. Generating related questions for search queries, 2015. US Patent 9,213,748.
Sean M. McNee, Istvan Albert, Dan Cosley, Prateep Gopalkrishnan, Shyong K. Lam, Al Mamunur Rashid, Joseph A. Konstan, and John Riedl. On the recommending of citations for research papers. InProceedings of ACM Conference on Computer Supported Cooperative Work, pages 116–125. ACM, 2002.
Thomas Mehle. Hypothesis generation in an automobile malfunction inference task.Acta Psycho-logica, 52(1-2):87–106, Nov 1982.
Qiaozhu Mei, Dengyong Zhou, and Kenneth Church. Query suggestion using hitting time. In Proceedings of the 17th ACM Conference on Information and Knowledge Management, pages 469–478. ACM, 2008.
Tomas Mikolov, Kai Chen, Greg Corrado, and Jeffrey Dean. Efficient estimation of word representa-tions in vector space. arXiv preprint arXiv:1301.3781, 2013.
David R. Musicant, Vipin Kumar, Aysel Ozgur, et al. Optimizing f-measure with support vector machines. InProceedings of FLAIRS conference, pages 356–360, 2003.
Tri Nguyen, Mir Rosenberg, Xia Song, Jianfeng Gao, Saurabh Tiwary, Rangan Majumder, and Li Deng. Ms marco: A human generated machine reading comprehension dataset. arXiv preprint arXiv:1611.09268, 2016.
Kishore Papineni, Salim Roukos, Todd Ward, and Wei-Jing Zhu. Bleu: A method for automatic evaluation of machine translation. InProceedings of the 40th Annual Meeting on Association for Computational Linguistics, pages 311–318. Association for Computational Linguistics, 2002.
Alec Radford, Jeffrey Wu, Rewon Child, David Luan, Dario Amodei, and Ilya Sutskever. Language models are unsupervised multitask learners. OpenAI Blog, 1(8), 2019.
Yedendra B. Shrinivasan and Jarke J. van Wijk. Supporting the analytical reasoning process in infor-mation visualization. InProceedings of the SIGCHI Conference on Human Factors in Computing Systems, pages 1237–1246. ACM, 2008.
Barry Smyth and Paul McClave. Similarity vs. diversity. InProceedings of International Conference on Case-based Reasoning, pages 347–361. Springer, 2001.
Jun Song, Jun Xiao, Fei Wu, Haishan Wu, Tong Zhang, Zhongfei Mark Zhang, and Wenwu Zhu. Hierarchical contextual attention recurrent neural network for map query suggestion. IEEE Transactions on Knowledge and Data Engineering, 29(9):1888–1901, May 2017.
Alessandro Sordoni, Yoshua Bengio, Hossein Vahabi, Christina Lioma, Jakob Grue S., and Jian-Yun Nie. A hierarchical recurrent encoder-decoder for generative context-aware query suggestion. InProceedings of the 24th ACM International on Conference on Information and Knowledge Management, pages 553–562. ACM, 2015.
Charles Spearman. The proof and measurement of association between two things. American Journal of Psychology, 15(1):72–101, Jan 1904.
John Stasko, Carsten Görg, and Zhicheng Liu. Jigsaw: Supporting investigative analysis through interactive visualization. Information Visualization, 7(2):118–132, Jan 2008.
Martin Theobald, Ralf Schenkel, and Gerhard Weikum. Efficient and self-tuning incremental query expansion for top-k query processing. InProceedings of the 28th Annual International ACM SIGIR Conference on Research and Development in Information Retrieval, pages 242–249. ACM, 2005.
Saúl Vargas and Pablo Castells. Rank and relevance in novelty and diversity metrics for recommender systems. InProceedings of the 5th ACM Conference on Recommender Systems, pages 109–116. ACM, 2011.
Bienvenido Vélez, Ron Weiss, Mark A. Sheldon, and David K. Gifford. Fast and effective query refinement. InProceedings of the 20th International ACM SIGIR Conference on Research And Development In Information Retrieval, volume 31, pages 6–15. Citeseer, 1997.
Ji-Rong Wen, Jian-Yun Nie, and Hong-Jiang Zhang. Clustering user queries of a search engine. In Proceedings of the 10th International Conference on World Wide Web, pages 162–168. Citeseer, 2001.
William Wright, David Schroh, Pascale Proulx, Alex Skaburskis, and Brian Cort. The sandbox for analysis: Concepts and methods. InProceedings of the SIGCHI Conference on Human Factors in Computing Systems, pages 801–810. ACM, 2006.
Jinxi Xu and W. Bruce Croft. Query expansion using local and global document analysis. SIGIR Forum, 51(2):168–175, Aug 2017. ISSN 0163-5840. doi: 10.1145/3130348.3130364. URL
http:
//doi.acm.org/10.1145/3130348.3130364
.Appendix
A
Appendix A
Table A.1Krippendorff’sαfor full and reduced data.
S. No. Query Full data Reduced data
Relevanceα Surprisalα Relevanceα Surprisalα
1 why is economic security important 0.324 0.356 0.412 0.366
2 why do honey bees pollinate plants 0.529 0.439 0.647 0.533
3 why do we need fiber in our diet 0.425 0.640 0.606 0.627
4 reasons why primary sources aren’t reli-able
0.010 0.175 0.424 0.398
5 why should medical marijuana be legal-ized
0.409 0.274 0.354 0.279
6 why pilgrims migrated to america 0.350 0.195 0.238 0.258
7 why is reasoning important 0.281 0.168 0.199 0.263
Table A.2Pearson correlation coefficients for the metrics and the human scores for full and reduced data (all values are statistically significant, i.e.,p<0.05).
Method Full data Reduced data
Relevance Diversity Relevance Diversity
Naive 0.528 0.633 0.675 0.594
Sampling 0.305 0.307 0.629 0.324
MMR 0.558 0.681 0.693 0.697
FMMR 0.390 0.572 0.573 0.575
![Table 1.1 Example query and associated document excerpts from MS MARCO dataset [Nguyen et al., 2016].](https://thumb-us.123doks.com/thumbv2/123dok_us/1303965.1163014/11.612.93.546.97.258/table-example-associated-document-excerpts-marco-dataset-nguyen.webp)