1
Analysis of Remotely Sensed Data for Mapping Land Cover
Types by Applying a Maximum Likelihood Classifier
Algorithm, in Al-Ahsaa Oasis, Eastern Region, Saudi Arabia
Abdelrahim.A.M.Salih
Al-Imam Muhammad Ibn Saud Islamic University, Department of Geography, Al-Ahsaa, Saudi Arabia. Corresponding Author: E-mail address: +966538802619, E-mail Address: [email protected]
Abstract
Accurate, detailed and recent Information about land cover/use is important and much more needed for different aspects of sustainable development and environmental management. As remote sensing datasets are becomes one of the most important and effective tools to generate such information, this study aimed to generating land cover map for sub area in Al-Ahasaa Oasis, Saudi Arabia, by using and classifying a subset of Landsat-ETM+ image of the selected study area, as bases and required input for future studies and researches. Different image preprocessing techniques in addition to a will-known and widely used classification method (i.e., Maximum Likelihood classifier) were applied. To be reliable with the final product, accuracy assessment was carried out with 89% agreement and accepted according to the applied method. Different land cover classes were found in the study area, which includes (Sand dunes, Water bodies, Sabakha, Bare soil, Urban, and Agricultural lands). The study also revealed that the dominant land cover class is sand dunes with
approximately ± 70% in area. The study strongly indicated that the area has long been affected by sand movement. Finally, the study suggested that, further researches with more advanced methods rather than traditional methods are needed in the future to support the findings of this study, with high degree of accuracy.
Keywords: Remote sensing, classification, Al-Ahsaa, Saudi Arabia, Land cover
2
1. Introduction
Land cover characterization, mapping, monitoring and assessment are the
most important and typical applications of remotely sensed data (King,
2002). Land cover is a fundamental variable that impacts on and links different parts of the human and natural environment (Food, 2002). The availability and accessibility of accurate and timely land cover information play an important role in many global land development, and in many scientific studies and socioeconomic assessments because they are essential inputs for environmental and ecological models (Bontemps et al,
2012), primary reference for ecosystem control and management (Yang
et al, 2013), and required information for understanding coupled human and natural system (Mora et al, 2014). The need for accurate and up to date information regarding land cover and its dynamic are increasingly necessary at different spatial and temporal scales (Chen et al., 2015a; Jin et al., 2013), and also in regional and local scale. Knowledge about land cover is important for many planning and management activities concerned with the surface of the earth (Giri, 2012). Understanding the distribution of land cover is crucial to the better understanding of the
earth’s fundamental characteristics and processes, including productivity of the land, the diversity of plant and animal species, and the
biogeochemical and hydrological cycles (Giri, 2012). Several authors
3
analysis methods to increase the degree of classification accuracy. To obtain accurate information from remote sensing data, different pre-processing algorithms should be applied on the satellite image.
However, in the study area, little information and a few studies about the
land use/cover have been found. Accurate and up –to-date information
regarding land cover is much more needed, and the available information needs further investigation. The overall aim of this paper is to classify Landsat-ETM+ satellite image to extracting and mapping the current land cover thematic classes in the study area, using a standard supervised (i.e., Maximum Likelihood) classification method, aided by different image preprocessing techniques.
2. The study area
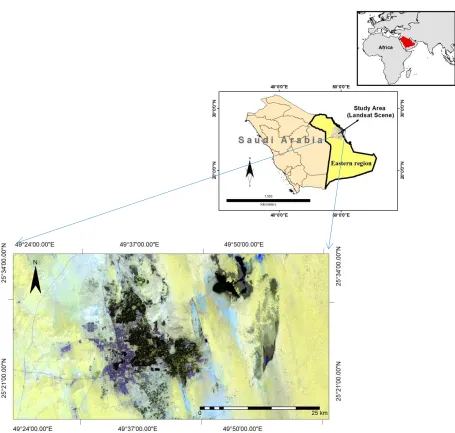
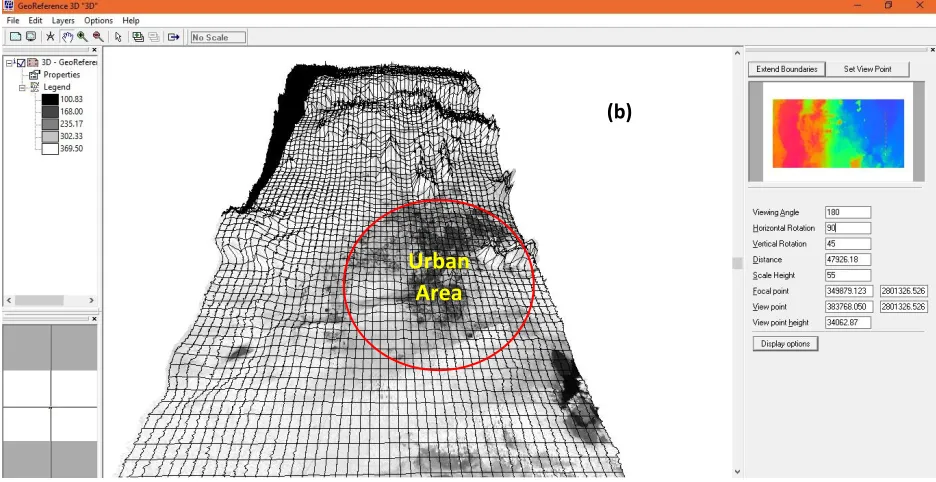
The area used in this study is Hufu area, which is located in Al-Ahsaa, eastern region, Saudi Arabia. It cover approximately 2268.72 km2 in area, with the geographical coordinates (49º.24-49º.48 E and 25º. 24-25º.36 N), (see Fig.1). The study area is mainly covered by active sand dunes. The topography as shown in (Fig.2, a/b) is very gently with little relief and a few surrounding ridges. The elevation is ranging from 345 to 510 meters above sea level. The study area is affected by the arid and semi-arid climate, with average annual rainfall less than 46 mm, and
mean annual temperature is approximately 28 Cº. The rain falls almost
4
5
Figure 2. 3D view of the study area; a) the internal relife, and b) the urban build-up area. Red cercle indicate the centre of the study area
3. Materials and Data sources
Hofyf city
Urban Area
(a)
6
The data sets used are derived from two major sources. These are; field work data and remote sensing data. A set of 100 ground truths, collected in June 2017, were used in this study. A group of 50 points were used to define and collect the training samples, while the reset were used to perform the accuracy assessment of the classification results.
A Garmin GPS device was used in determining the locations of the points. Field work was documented by taking a numbers of digital photographs for difference land cover materials. These photos were used to perform the visual interpretation of the satellite image.
A one, cloud-free, LANDSAT-7 ETM+ scene (WRS_ROW/PATH: 042/164, Date: October 2017, pixel size: 30 x 30 meters, sun elevation:
47º, sun azimuth: 143º, Channels: 1,2,3,4,5,7) covering the study area,
has been obtained from USGS website (https://earthexplorer.usgs.gov/)
was used to carry out this study.
3. Methodology
To generating the land cover map, several and essential image pre-processing and analysis techniques were used. All the image pre-processing and analyses have been carried out by using an Integrated Land and Water Information system (ILWIS) open source software. ILWIS is software with Geographical Information System (GIS) and Image Processing capabilities.
7
For several reasons, raw remotely-sensed data generally contain geometric and radiometric errors (Mather, 2004). To classify, identify and extract spectral and spatial classes representing different thematic features from these data (Liu and Mason, 2009), these errors have to be removed or eliminated. In this study, the geometric corrections were already done by the data provider, while the necessary radiometric corrections were accomplished as previously described in (Irish, 2002 and Mather 1987).
3.2.
Image classification
There is a relationship between land cover and measured reflection values in image data, which is depend on the local characteristics (ILWIS,
2001). In order to extract information from the image data, this
relationship must be found. The process to find this relationship is called classification. Digital image classification is customarily made by applying
either supervised or unsupervised classification methods (Lillesand and
Kiefer, 1989, cited in Osman, 1996). For satellite image applications, the latter is generally considered much more important and widely used (ILWIS, 2001). In this study, the supervised classification method was applied to classify sub-scene of Landsat-7 ETM+ image. In the following steps, the classification procedures were given:
1. By using three uncorrelated bands (7, 5, and 1) have been obtained by using the optimum index factor (O.I.F), a false colour composite image was created.
2. Three image transformation methods were used. These are: a)
8
dimensionality (Liu and Mason, 2009), b) Image subtraction
(differencing) was used for spectral enhancement and removal of background illumination bias(Mather 1987):, c) Image division (ratio) was used to enhancing spectral features, and finally d) Normalized Difference Vegetation Index (NDVI) was used for detection vegetation spectral response.
3. By using data derived from step 1 and 2, two set of signature files
were defined and collected aided by the groups of “
ground truth
points
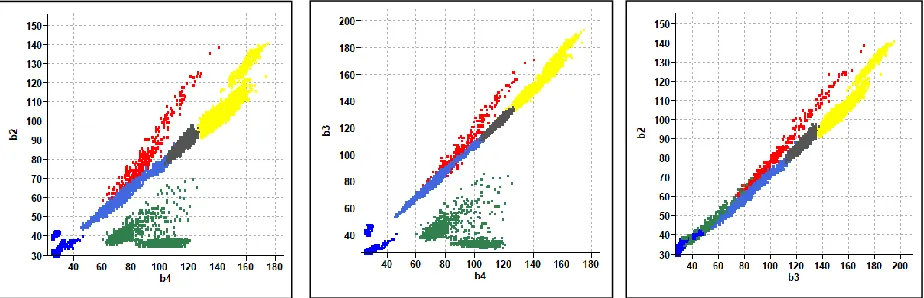
”.4. For signatures evaluation, the created signature files were plotted in colors feature space (see Fig.3), to confirm and judgment that, the selected land cover classes are spectrally distinguished and each class corresponds to only one spectral cluster (ILWIS, 2001), (i.e., no obvious overlap exist) between different features.
5. By using the signature files generated in step three, the supervised classification (maximum likelihood algorithm) was applied in a semi-automatic way and the obtained result was evaluated and tested for accuracy.
4. Results
9
4.1. Image transformation results
The results of the eigenvalues and covariance matrix analysis of the subset digital image are presented in Table (1). As the PCA operation made the bands independent from one another, bands with high amount of information (i.e., PC1, PC2, and PC3) are used to create a colour composite image as shown in Fig (3). The eigenvalues representing the variances of PCs shown in Table (3) indicates that a very large portion of information (data variance) is concentrated in PC1 with 94 % variance accounts.
Table 1 The PCA eigenvalues of the covariance matrix of Landsat-7 ETM+ sub-scen
Variance per bands:
5007.30, 242.67, 31.08, 41.46, 10.38, 1.06 Variance percentage per band:
94.35, 4.57, 0.59, 0.27, 0.20, 0.02
band1 band2 Band5 Band3 Band4 Band7
PC 1 0.276 0.231 0.655 0.390 0.289 0.454
PC 2 0.753 0.299 -0.279 0.232 0.074 -0.453
PC 3 0.289 0.076 -0.077 -0.005 -0.845 0.437
PC 4 0.180 -0.185 0.682 -0.396 -0.268 -0.489
PC 5 0.431 -0.164 -0.140 -0.696 0.354 0.396
PC 6 0.232 -0.889 -0.046 0.390 0.017 0.032
10
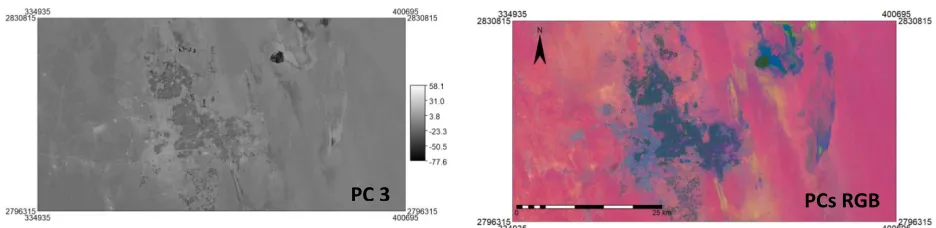
Figure 4. PC images derived from six reflective spectral bands of a subset of Landsa-7 ETM+ image, along with the colour composite RBG of the three PCs.
Fig. (4 and 5) shows the image transformation results. The results
highlighted the cover feature classes in the image by enhancing spectral features separability and suppressing topographic shadows. Accordingly, the definition and collection of training areas were easily done with less overlap as indicated in Fig. 2. From Fig. (5 and 6), the areas covered by sand and barren lands or bare soil were easily distinguished and sampled. The concentrations of Iron oxides and hydroxides in minerals, made the spectral reflectance of sand (represented by pink colour in Fig. 5 and by red colour in Fig.6 more apparent in the resulting images than the original one. The urban (Built-up) areas are more apparent in Fig. 6 than Fig. 5 which indicated by blue colour. Therefore, it was easily sampled and classified. Agricultural areas are indicated by green colour in Fig. 5 and turquois colour in Fig. 6 due to highly moisture content of this cover type. The
Sabakha
’s
feature
is indicated and highlighted by brown colour as shown in Fig.5. However, image transformation (i.e., PCs and ratios) techniques are very useful and valuable to highlighting and distinguishing specific land cover classes spectrally rather than spatially. Therefore, it is usage was restricted just to define and collect the training areas.11
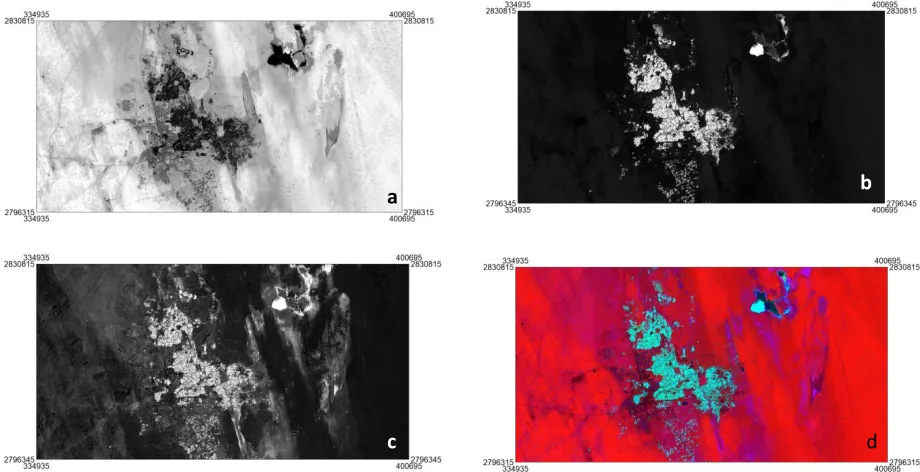
Figure 5. Difference images and colour composite image of subset of a Landsat-7 ETM+ image: a) b3-b1 displayed in red colour, shows iron oxides; b) b4-b3 displayed in greed, detecting vegetation features; c) b5-b7 displayed in blue, shows the clay miner
Figure 6. Ratio images and ratio colour composite: a) the ratio image of b3/b1; b) the ratio image of b4/b3; c) the ratio image of b5/b7; and d) the ration colour composite of b5/b7 in blue, b4/b3 in green and b3/b1 in red.
a b
c d
a b
12
Fig.7 shows the healthy vegetation cover in the study area as difference and summation of the Near Infrared (NIR) and red spectrally calibrated bands (i.e., NDVI) index. This index was applied to make vegetation cover more distinguishable from the other ground objects for better classification results. The derived NDVI values ranging from -0.30 as minimum NDVI value representing the area covered by water body, to 0.60 as maximum NDVI value, representing the area covered by vegetation.
Figure 7. Vegetation spectral response of the study area, using Normalized Difference Vegetation Index (NDVI) algorithm
4.2. Image classification results
13
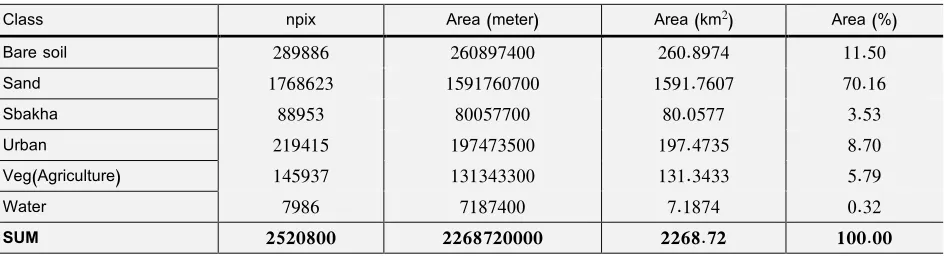
namely: (Vegetation (Agriculture), Sabakha, Sand, Bare soil, Water body, and Urban). Information about areal and percentage of thematic classes are summarized and presented in Table 2. By referencing to Table 2, the sand dune class is dominant in the study area, it cover about 70% of the study area. The absence of vegetation cover on the study area sides is conspicuous. There are, however, a few vegetation cover near water bodies in the form of bushes. Fig.8 also shows that the agricultural areas are only cover 5% in area, mainly date trees with a few vegetables around it. Urban areas cover approximately 8% of the study area. According to the urban shape and pattern, it is clear that the urban growth and extension of the study area is in the North-South and East direction. This meant that the extension of the urban is restricted with different factors (e.g., Sand dunes).
14
4.3. Accuracy Assessment
Table (3) shows the statistical report of the cross function that was used to evaluating the accuracy of the classification result, using the second set of signature file. The overall accuracy is 79 %, with average accuracy 89 % and average reliability 83 %, which demonstrate that the good performance of classification procedures. Generally speaking, statistical information from Table (3) indicates that the error of accuracy and reliability is less than 17 percent. By referencing to the accuracy and reliability statistical information, the classification results are accepted as basis for better planning and management of the existing land resources in the study area.
Table 2. Major land-cover class found in the area in (ha, Km2 and percentage) created by the classification of Landsat-7 ETM+ subset image (channel 1,5,7)
Class npix Area (meter) Area (km2) Area (%)
Bare soil 289886 260897400 260.8974 11.50
Sand 1768623 1591760700 1591.7607 70.16
Sbakha 88953 80057700 80.0577 3.53
Urban 219415 197473500 197.4735 8.70
Veg(Agriculture) 145937 131343300 131.3433 5.79
Water 7986 7187400 7.1874 0.32
15
Table 3 . Classification accuracy assessment results of Landsat-7 ETM+ subset image, Date: October 2017, bands combination (1,5,7)
Average Accuracy = 89.08 % Average Reliability = 83.03 % Overall Accuracy = 79.05 %
Bare soil
Sand Sabakha Urban Vegetation (Agriculture)
water UNCLASSIFIED ACCURACY
Bare soil 1 0 0 0 0 0 0 1.00 Sand 1 1107 0 0 0 0 0 1.00 Sabakha 1456 0 869 4 0 0 0 0.37 Urban 1 0 0 459 0 10 0 0.97 Vegetation
(Agriculture) 0 0 0 1 1364 2 0 1.00 water 0 0 0 0 0 1771 0 1.00 RELIABILITY 0.00 1.00 1.99 0.99 1.00 0.99
5. Discussions
A study of Landsat-ETM+ image in the study area reveals that a large variety of sand dune shapes were found. With a total area estimated at 1591 square kilometer, has sand cover. At least one-third of the study area has been affected by sand movement. The problem of sand movement has been controlled for several years by planting different type of trees utilized to control and stabilize the sand movement toward the urban built-up area. Difference shapes and sizes of sand dunes have been found in the study area. Holm (1960) pointed out that the main sources for these sand dunes are: the Rub’ al Khali, Nafud’s, and Dahna
16
about ± 150 meters. The second more interesting cover type has been
found in the study area is
Sabakha
’s
features (indicated by blue colour in the land cover map). A study by Holm (1960) pointed out that the name is from the Arabic, and thesabakha
is a saline flat area, and are found inland from the coast at elevations up to 150 meters near Hofuf (The focus of this study). Most of this type of land cover has long been concentrated at Eastern part of the study area (see Fig.8). Also Holm (1960) reported that there are two types ofsabakha’s
formation along the Arabian cost, these are: 1) arenaceous, filled with sand, and 2) aregillaceous, filled with clay. For more details and more information about the formation of this land cover type, the study has been carried out by (Holm, 1960) can be considered and suggested. Also from Table 2, can be seen that the agricultural areas only cover around 131 square kilometer (i.e., approximately 5%) from the whole study site. One may interpret that for some reasons; the first reason is that the study area has long been affected by difference kinds of drought (e.g., hydrological droughts), the second reason is that the study area has been experiencing steady growth in its population since 2000 until today(). From 2000 until today, the built-up areas are increased to reachapproximately ±197 km2 in area in 2017. In addition to that the extension
of built-up area has recently restricted by sand dune to be extend in specific directions (i.e., toward the agricultural lands). All this factors lead to decrease the areas covered by crop land in the study area. Different
land use/ cover classes have been found by Aldakheel and Al-Hussaini
(2005). They also revealed that channel 3 of Landsat TM image may
17
land cover classes in change detection method. However, what they have been found and what has been found in this study, needed more investigation and in deep research using more ground truth and different methods of remotely sensed data analysis (e.g., Object-based classification, decision trees and support vector machines) than traditional methods (i.e., supervised or unsupervised) to better findings and generalizing the findings for the whole region and generating more accurate and reliable land use/ cover map.
6. Conclusions
The aim of this study was to generate up-to-date land-cover map of the Al-Hofuf study site based on a will-known and widely applied (i.e., maximum likelihood classifier algorithm) standard supervised classification method using Landsat-7 ETM+ subset image data. From the obtained results, the study concludes that:
1) Results from the study revealed that using image transformations
prior to image classification decreased the topographical effects (i.e., shadows) on the satellite image and make it more consistence for classification application, and more appropriate for the definition and collection of training areas, especially for (urban and sabakha). It is also concluded that correlation matrix (i.e., O.I.F) was very useful to obtain multivariate statistical information of a data set for 3-band combination.
18
information regarding land use/cover mapping, and very useful to carry out land use/ cover studies in wide arid and semi-arid area.
3) Finally, the. The results also pointed out that the study area has long been affected by sand movement. Therefore, more studies in the future should taking place in the study area for more information about this phenomenon (i.e., Sand Encroachment).
References
Aldakheel, Y. and Al-Hussaini, A., (2005). The use of multi-temporal Landsat TM imagery to detect land cover/use changes in Al-Ahssa, Saudi Arabia. Scientific Journal of King Faisal University (Basic and Applied Sciences), Vol. 6 No.1 1426.
Bontemps, S., Herold, M., Kooistra, L., van Groenestijn, A., Hartely, A., Arino, O., et al., (2012). Revisiting land cover observation to address the needs of the climate modeling community. Biogeosciences 9. 2145-2157.
Chen, J., Chen, J., Liao, A., Cao, X., Chen, L., Chen, X., et al., (2015a). Global land cover mapping at 30 m resolution: A POK-based operational approach. ISPRS J. Photogramm. Remote Sens. 103, 7-27.
Erener, A., Düzgün, S., Yalciner, A. C., (2011). Evaluating land use/cover
change with temporal satellite data and information system.
Procedia Technology 1 (2012) 385-389.
http://doi:10.1016/j.protcy.2012.02.079 .
19
Giri, C. P., (2012), Remote Sensing of Land Use and land Cover: Principles and Applications. Taylor & Francis Series in Remote Sensing Applications. Qihao Weng.
Holm, D. A., (1960). Desert Geomorphology in the Arabian Peninsula: Distinctive land forms provide new clues to the Pleistocene and Recent history of a desert region. Science, V 132, Number 3437.
ILWIS 3.0 Academic, (2001). User’s Guide, Aerospace Survey and Earth
Sciences (ITC) Enschede, The Netherlands.
Irish, R., (2002). Landsat 7 Science Data Users Handbook. NASA
Goddard Spaceflight Centre, MD, URL:
http://ltpwww.gsfc.nasa.gov/IAS/handbook/ handbook toc.html.
Date accessed: 13 May 2003.
Jin, S., Yang, L., Danielson, P., Homer, C., Fry, J., Xian, G., (2013). A comprehensive change detection method for updating the National Land cover Database to circa 2011. Remote Sens. Environ. 132, 159-175.
King, R. B., (2002). Land cover mapping principles: a return to interpretation fundamentals. International Journal of Remote Sensing data, Remote Sensing of the Environment 86, 530-541.
Lillesand, T. M. and Kiefer, R. W., (1989). Remote Sensing and Image Interpretation, John Wiley & Sons Ltd., London, 721p.
Liu, J. G., and Mason, P. J., (2009). Essential Image Processing and GIS for Remote Sensing. John Wily & Sons Ltd, The Atrium, Southern Gate, Chichester, West Sussex, PO19 8SQ, UK.
20
Mora, B., Tesndbazar, N.E., Herold, M., Arino, O., (2014). Global land cover mapping: Current status and future trend. In: Lu, M., Chen, J., Tang, H., Rao, Y., Yang, P., Wu, W., (2016). Land cover change detection by integrating object-based data blending model of Landsat and MODIS. Remote Sensing of Environment 184, 374-386. http://dx.doi.org/10.1016/j.rse.2016.07.028 .
Osman, B. T., (1996). GIS-Hydrological Modelling In Arid Lands: A geographical synthesis of surface waters for the African Red Sea region in the Sudan. Doctor’s thesis, Department of Physical
Geography, University of Lund, Sweden, 202p.
Pilesjö, P., (1992). GIS and Remote Sensing for Soil Erosion Studies in
Semi-arid Environment: Estimation of Soil Erosion Parameters at Different Scales. Doctor’s thesis No. CXIV, Department of Physical
Geography, University of Lund, Sweden, 203p.
Salih, A. A.M., Ganawa, E., and Elmahl, A. A., (2017). Spectral mixture analysis (SMA) and change vector analysis (CVA) methods for monitoring and mapping land degradation/desertification in arid and semi-arid area (Sudan), using Landsat imagery. The Egyption Journal of Remote Sensing and Space Sciences 20, S21- S29. http://dx.doi.org/10.1016/j.ejrs.2016.12.008 .
Sobrino, J. A., Munoz, J. C. J, and Paolini, L., (2004). Land surface temperature retrieval from LANDSAT TM5. Remote Sensing of Environment 90 (2004) 434-440.doi:10.1016/j.rse.2004.02.003.
U.S. Geological Survey (USGS) website https://earthexplorer.usgs.gov .