Prediction of Discharge Capacity of Labyrinth Weir with
Gene Expression Programming
Hossein Bonakdari 1*, Isa Ebtehaj 2, Bahram Gharabaghi 3, Ali Sharifi 4, Amir Mosavi 5
1Department of Soils and Agri‐Food Engineering, Laval University, Québec, G1V0A6, Canada 2Department of Civil Engineering, Razi University, Kermanshah, Iran
3School of Engineering, University of Guelph, Guelph, Ontario, NIG 2W1, Canada 4Department of Statistics, Razi University, Kermanshah, Iran
5 Department of Mathematics and Informatics, J. Selye University, 94501 Komarno, Slovakia *Corresponding author, Phone: +1 418 656-2131, Fax: +1 418 656-3723, E-mail:
Abstract. This paper proposes a model based on gene expression programming for predicting discharge coefficient of triangular labyrinth weirs. The parameters influencing discharge coefficient prediction were first examined and presented as crest height ratio to the head over the crest of the weir (p/y), crest length of water to channel width (L/W), crest length of water to the head over the crest of the weir (L/y), Froude number (F=V/√(gy)) and vertex angle (𝜃) dimensionless parameters. Different models were then presented using sensitivity analysis in order to examine each of the dimensionless parameters presented in this study. In addition, an equation was presented through the use of nonlinear regression (NLR) for the purpose of comparison with GEP. The results of the studies conducted by using different statistical indexes indicated that GEP is more capable than NLR. This is to the extent that GEP predicts discharge coefficient with an average relative error of approximately 2.5% in such manner that the predicted values have less than 5% relative error in the worst model.
Keywords:Discharge coefficient, Soft computing, Weir, Sensitivity analysis, Nonlinear regression
1
Introduction
Conventional weirs are structures used to control, regulate and measure water level and flow volume in irrigation and drainage networks and water and wastewater treatment plants. A conventional weir is usually installed along the flow and perpendicular to channel axis. Conventional weirs include rectangular, V-notch, labyrinth and complex weirs. Many theoretical and experimental studies investigated passing flow from conventional weirs. Taylor [1] presented an experimental study on hydraulic labyrinth weirs. Hay and Taylor [2] described how the head on the labyrinth weir effects the discharge ratio. Tullis et al. [3] investigated trapezoid labyrinth weirs and indicated that their discharge capacity was a function of total head, effective length of weir crest and
coefficient of discharge of labyrinth weir. Wormleaton and Soufiani [4] studied hydraulic features and aeration of triangle labyrinth weirs. They found that aeration efficiency of triangle labyrinth weirs is more than linear weirs with equal length. Also, Wormleaton and Tsang [5] studied aeration of rectangular weirs experimentally. Emiroglu and Baylar [6] investigated the effects of weir included angle and water sill slope of weir on aeration in triangle labyrinth weirs. Tullis et al. [7] studied hydraulic behavior and flow head on submerged labyrinth weirs. They concluded that the flow over submerged labyrinth weirs did not depend on labyrinth weir sidewall angles. Bagheri and Heidarpour [8] used free vortex theory to estimate discharge coefficient of sharp-crested rectangular weirs as a function of flow features, channel geometry and conventional weir. Kumar et al. [9] experimentally investigated discharging capacity of triangle labyrinth weirs. They suggested a relation to calculate the flow over triangle labyrinth weirs through analyzing experimental data.
Considering the complexity of engineering problems and the growing number of engineering studies, new methods called soft computing, were significantly used during recent decade that were more efficient and more accurate in solving complicated and difficult engineering issues and, facilitating studies [10-13]. Soft computing and artificial intelligence were used by different researchers to estimate and predict different hydraulic and hydrologic problems especially discharge coefficient [14-17]. Emiroglu et al. [18] used Adaptive Neuro Fuzzy Inference System (ANFIS) techniques to predict discharge capacity of the triangular labyrinth side weir. They introduced an equation for discharge coefficient in this type of side weirs. The diversion flow passing over sharp-crested rectangular side weirs were predicted using Feed Forward Neural Networks (FFNN) and Radial Basis Neural Networks (RBNN) by [19]. Bilhan et al. [19] introduced an equation for discharge coefficient as a function of geometric and hydraulic features for sharp-crested rectangular side weirs. Emiroglu et al. [20] used artificial neural networks to introduce a relation which calculated discharge coefficient of triangle labyrinth weirs located in rectangular in under critical flow conditions.
Gene Expression Programming (GEP) is one method used in water hydraulic engineering during recent years. Unlike artificial neural system and neuro fuzzy systems which include a black box, the suggested method showed high accuracy in estimating the given parameter and relation [21-25].
Using Gene Expression Programming (GEP), the present study aims to introduce an equation to predict discharge coefficient. Therefore, the parameters influencing discharge coefficient are first determined and then an equation is presented using GEP. Following that, the effect of each of the dimensionless parameters is examined on predicting discharge coefficient through using sensitivity analysis. Also, the results of the GEP model are compared with that of nonlinear regression (NLR).
2
Data collection
m depth was used in their tests. The used triangle weir was located 11 m away from the channel entrance. Water was provided for the channel through an inlet pipe from an overhead tank supplied with an overflow arrangement to keep a constant head. The water height over weir crest was measured by point gages having ±0.1 mm accuracy. Ventilation holes were installed on both sides of the weir’s downstream for the purpose of aeration of the nappe. Wave suppressors and Grid walls were structured at the upstream of the channel to break and dissipate the surface disturbances and to enlarge the size of eddies, respectively. They conducted their experiments on 30, 60, 90, 120, 150, and 180 degree weirs. They also used varied discharges for each of the mentioned angles. They eventually carried out 123 different experiments for different discharges and angles. Schematic of Kumar et al. [9] experimental model is illustrated in Fig. 1. Table 1 shows the parameters used in the present study.
Fig. 1. Schematic of Kumar et al. [9] experimental model
Table 1. Parameters used to estimate discharge coefficient [9] p/y L/W F W/y θ (degree) Cd
min 0.581 1 0.608 1.62 30 0.54
3
Overview of Gene Expression Programming
GEP is a developed genetic programming [26]. It is a search technique relying on computer programs such as decision tree, logical expressions, polynomial construct, and mathematics statements. GEP computer programs are coded as line chromosomes and the final presentation is in the form of expression trees (ETs) [27] . ETs are complex computer programs which are developed to solve a given problem and are selected according to their fitness to the problem [25]. Considering that in GP, genotype and phenotype are mixed in a simple replicator system, GEP of a genotype/phonotype system is developed where genotype is completely separated from phenotype. Therefore, developed GEP genotype/phonotype system is 100 to 60000 times more effective than GP system [28, 29] .
In GEP process, the first chromosome of each independent parameter is randomly generated in the population. Then, they are developed and all independent parameters are evaluated based on fitness function and are used as a part to produce new generation with different characteristics. People of the new generation develop through confrontation with the selection environment, expression of the genomes and reproduction with modification. The process continues until getting the predefined generation or getting the answer [28, 29] .
Ferreira [30] described the fitness of an individual function (i) for the fitness model (j) as: 𝐼𝑓 𝐸(𝑖𝑗) ≤ 𝑝, 𝑡ℎ𝑒𝑛 𝑓(𝑖𝑗)= 1, , 𝑒𝑙𝑠𝑒 𝑓(𝑖𝑗)= 0
(1)
where p and E(ij) are the precision and error, respectively. Then the absolute error can be obtained from:
𝐸(𝑖𝑗) = |𝑝(𝑖𝑗)− 𝑇𝑗| (2)
Where the (fi) for an individual function calculated as follows:
𝑓𝑖 = ∑(𝑅 − |𝑝(𝑖𝑗)− 𝑇𝑗) (3)
where Tj, R and p(ij) are the target values, selection range, and predicted values,
Fig. 2. Gene Expression Programming flowchart
4
Derivation discharge coefficient based on GEP
Reviewing the recent studies conducted on estimating discharge coefficient in weirs, crest height (p), head over the crest of the weir (y), crest length of the weir (L), channel width (W), and Froude number (F=V/√(gy)) parameters can be named [19,18,20, 31]. The dimensionless parameters in estimating discharge coefficient can be presented as equation 4 through using dimensional analysis.
𝐶𝑑= 𝑓( 𝑤 𝑦, 𝐿 𝑏, 𝐿
𝑦, 𝐹, 𝜃) (4)
The manner of function estimation through using the GEP method to predict discharge coefficient will be presented in this section. For training 20% of data set is used randomly as suggested by Kumar et al. [9]. Furthermore, 80% of data can be used for testing. To produce an initial population of, according to Ferreira’s [28] the range of 30-100 is suggested In the next step a fitness function is calculated using MSE as follows:
j ij i i
i
for
E
p
O
E
1
100
f
=
−
+
=
(5)where Pij, and Qij represent the predicted and fitness case values for i individual
chromosome for fitness case j. The set of terminals are developed as follows:
𝑇 = {𝐶𝑑, 𝑤 𝑦, 𝐿 𝑏, 𝐿
𝑦, 𝐹, 𝜃)} (6)
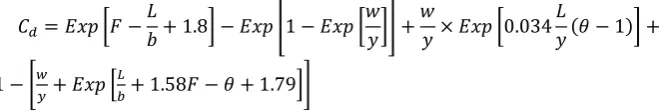
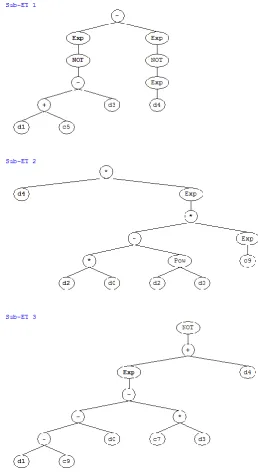
Where the number of genes and their head and tail length are calculated for every chromosome. In the present study, three genes were used in each chromosome. In this study, the {+} operator is utilized to link function among the genes. The {x} function presented in Table 2 provides the (1-x) amount. Using equation (4) and the expression tree presented in Fig. 3, the model presented by using GEP can be expressed as equation (7); its parameters’ values are presented in Table 3.
𝐶𝑑= 𝐸𝑥𝑝 [𝐹 −
𝐿
𝑏+ 1.8] − 𝐸𝑥𝑝 [1 − 𝐸𝑥𝑝 [ 𝑤
𝑦]] + 𝑤
𝑦× 𝐸𝑥𝑝 [0.034 𝐿
𝑦(𝜃 − 1)] +
1 − [𝑤
𝑦+ 𝐸𝑥𝑝 [ 𝐿
𝑏+ 1.58𝐹 − 𝜃 + 1.79]]
(7) where Cd is coefficient of discharge, w/y the ratio of crest height to head over the
crest of the weir, L/W ratio of crest length of water to channel width, L/y the ratio of crest length of water to the head over the crest of the weir, F, Froude number and 𝜃
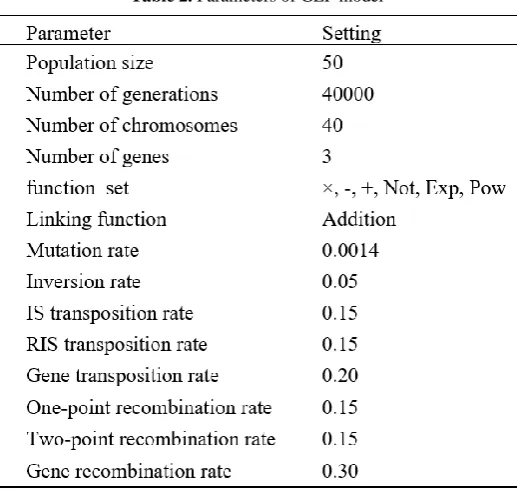
Table 2. Parameters of GEP model
Table 3. The values of the parameters used in ET (Fig. 3)
Parameter value Parameter value
d0 θ G1C5 2.8
d1 L/W G2C9 -3.38 d2 L/y G3C7 1.58
d3 F G3C9 1.79
d4 p/y - -
5
Result and discussion
In order to verify the accuracy of the estimated model at each step of model development, the results of analysis of GEP and NLR is based on the criteria of the coefficient of determination (R2), Root Mean Square Error (RMSE), Mean Absolute
Percentage Error (MAPE), Adjusted Coefficient of Efficiency (CE) and Scatter Index (SI) as defined in the following forms:
𝑅2=
[
∑𝑛𝑖=1(𝐶𝑑𝐸𝑋𝑃𝑖−𝐶𝑑𝐸𝑋𝑃)(𝐶𝑑𝐺𝐸𝑃𝑖−𝐶𝑑𝐺𝐸𝑃)
√∑𝑛𝑖=1(𝐶𝑑𝐸𝑋𝑃𝑖−𝐶𝑑𝐸𝑋𝑃)2∑𝑛𝑖=1(𝐶𝑑𝐺𝐸𝑃𝑖−𝐶𝑑𝐺𝐸𝑃)2
]
2
(8)
𝑅𝑀𝑆𝐸 = √(1
𝑛) ∑ (𝐶𝑑𝐸𝑋𝑃𝑖− 𝐶𝑑 𝐺𝐸𝑃𝑖)
2 𝑛
𝑖=1 (9)
𝑀𝐴𝑃𝐸 = (1
𝑛) ∑ (
|𝐶
𝑑𝐸𝑋𝑃𝑖−𝐶𝑑𝐺𝐸𝑃𝑖|
𝐶𝑑𝐸𝑋𝑃𝑖 ) 𝑛
𝑖=1 × 100 (10)
𝐶𝐸 = 1 −∑ |𝐶𝑑𝐸𝑋𝑃𝑖−𝐶𝑑𝐸𝑋𝑃𝑖|
𝑛 𝑖=1
∑𝑛𝑖=1|𝐶𝑑𝐸𝑋𝑃𝑖−𝐶𝑑𝐸𝑋𝑃| (11)
𝑆𝐼 = 𝑅𝑀𝑆𝐸
𝐶𝑑𝐸𝑋𝑃 (12)
where 𝐶𝑑𝐸𝑋𝑃
𝑖 and 𝐶𝑑 𝐺𝐸𝑃𝑖 denote the actual and modeled discharge coefficient values
and 𝐶𝑑 𝐸𝑋𝑃 and 𝐶𝑑𝐺𝐸𝑃 represent the mean actual and modeled discharge coefficient
values, respectively.
The closer the value of index R2 to 1, the more it shows the compatibility of the
estimated value with the real value. Results which are obtained from coefficient of determination (R2) have been simulated in relation with linear dependence between real
and corresponding values (for the present case, the actual and simulated discharge coefficient values) and they are sensitive towards deviated points; so in evaluating the results, we cannot solely rely on this index. Thus, other statistical indexes like mean absolute percentage error (MAPE) - which shows the difference between real and estimated models in form of percentage of actual values- and root mean square error (RMSE) - which considers the weight of larger errors by powering the difference between actual and estimated values - are needed in order to estimate the function of the models. Both MAPE and RMSE indexes can include zero value (best mode) and infinity (worst value). Also, dimensionless RMSE criterion which is stated in SI form can be applied in estimating different models without considering dimension of parameters. Besides, as a complementary criterion, the "adjusted coefficient efficiency (CE)" could be utilized for evaluating the precision of models. This index reports the difference between the proportion of remainders variance (numerator term) and the data variance (denominator term) from 1. If this index equals 1, the presented model has done data estimation in the best way. Simultaneous use of these indexes could provide sufficient information for precision of the applied models [32].
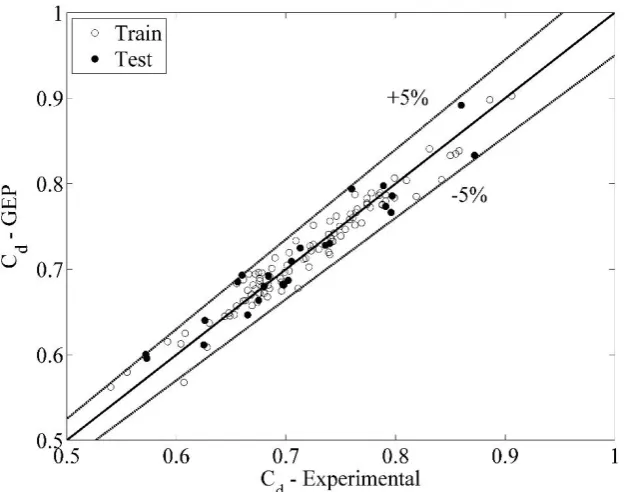
indicates the actual values and y axis presents the values predicted by GEP. It could be seen in the figure that almost the majority of the predicted amounts predict the discharge coefficient fairly accurately in both states of test and train. The GEP model presented in the train predicts the train-state values with R2=0.95 and an average relative error
percentage approximate to 2% (MAPE). Most of the values presented in this state have a less- than- 5% relative error. The other statistical indexes used in the train state of this research are RMSE=0.017, CE=0.78 and SI=0.02 indexes MAPE and RMSE have very low amounts - as can be seen almost zero - which indicates the high accuracy of the presented model. The predicted values have an R2=0.93 and a MAPE=2.53% in the test
state which are almost similar to that of the train state. Also SI, CE, RMSE indexes are equal to 0.021, 0.67 and 0.029 respectively for the test state of this model. Therefore, considering Fig. 3 and the presented statistical indexes for train and test states of the presented GEP model, it could be stated that GEP predicts the discharge coefficient of triangular labyrinth weirs very well.
Fig. 4. Comparing estimated discharge coefficient with experimental result (Test and Train)
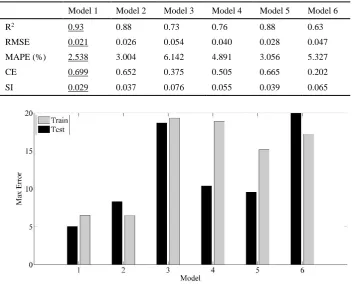
the results of all the statistical indexes are better for model 1 when compared to the rest of the models for both train and test states. Also, Fig. 5 indicates that the maximum relative error of model 1is lesser than all other models. Therefore, it could be stated that the simultaneous use of dimensionless parameters of crest height ratio to the head over the crest of the weir (p/y), crest length of water to channel width (L/W), crest length of water to the head over the crest of the weir (L/y), Froude number (F=V/√(gy)) and vertex angle (𝜃) is fixed in predicting discharge coefficient of rectangular labyrinth weirs. To examine the effect of each of the dimensionless parameters, the results of the statistical indexes of each model must be compared with regard to model 1 which is the best model and is presented as equation (7). It could be observed that model 2, which considers all the parameters of model 1 except for the vertex angle (θ), presents better results in comparison with models 3, 4, 5, and 6. Therefore, it could be stated that among the five presented dimensionless parameters, vertex angle (θ) parameter has the least value of effect on predicting discharge coefficient of triangular labyrinth weirs. Models 3, 4, 5 and 6 which disregard Froude number (F=V/√(gy)), crest length of water to the head over the crest of weir (L/Y), crest length of water to channel width (L/w), and crest height ratio to the head over the crest (p/y) dimensionless parameters respectively, do not present better results in comparison with models 1 and 2. Therefore, not using these parameters prevents predicting discharge coefficient relatively accurately in such manner that in some cases their maximum relative error is approximately 20% regarding Fig. 5. Therefore, it is essential to use these parameters in predicting discharge coefficient.
Table 4. Dependent parameters in discharge coefficient prediction
Independent parameter Dependent parameter Model No. p/y, L/W, L/y, F, 𝜃 Cd 1
p/y, L/W, L/y, F Cd 2
p/y, L/W, L/y, 𝜃 Cd 3
p/y, L/W, F, 𝜃 Cd 4
p/y, L/y, F, 𝜃 Cd 5
L/W, L/y, F, 𝜃 Cd 6
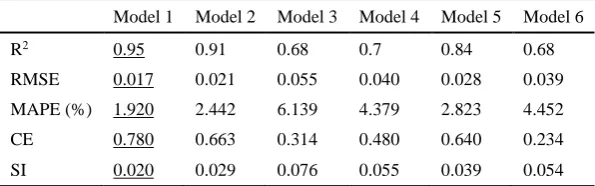
Table 5. Statistics Indexes (Train)
Model 1 Model 2 Model 3 Model 4 Model 5 Model 6
R2 0.95 0.91 0.68 0.7 0.84 0.68
Table 6. Statistics Indexes (Test)
Model 1 Model 2 Model 3 Model 4 Model 5 Model 6
R2 0.93 0.88 0.73 0.76 0.88 0.63
RMSE 0.021 0.026 0.054 0.040 0.028 0.047 MAPE (%) 2.538 3.004 6.142 4.891 3.056 5.327
CE 0.699 0.652 0.375 0.505 0.665 0.202
SI 0.029 0.037 0.076 0.055 0.039 0.065
Fig. 5. Highest errors in six different models
Also, this study presents an equation (Eq. 13) that employs nonlinear regression (NLR) in MINITAB to predict discharge coefficient of triangular labyrinth. The set of data selected to train GEP were also used in this state in predicting the following equation. Also, through employing the data used by random selection without replacement for testing GEP, the accuracy of the following equation is used in this section.
𝐶𝑑= 0.466 + 0.338 ( 𝑝
𝑦) − 0.183 ( 𝐿
𝑊) − 0.022 ( 𝐿
𝑦) + 0.31𝐹 + 0.12𝑠𝑖𝑛(𝜃)
(13)
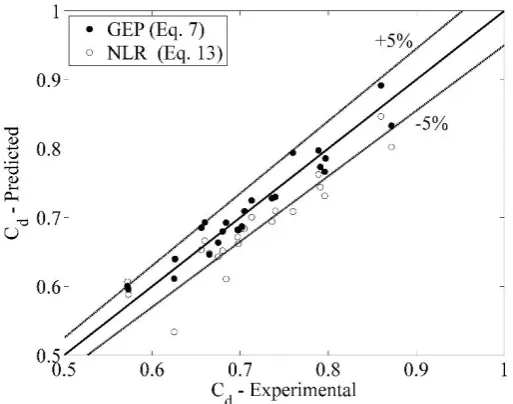
NLR mostly presents the discharge coefficient to be less than the actual value which leads to underestimating the prediction of the passing discharge and so causes underestimating. It could also be observed that the predicted values have a relative error greater than 5% in this state as opposed to GEP equation.
Fig. 6. Comparison of GEP and NLR in prediction of discharge coefficient of triangular labyrinth weirs (test)
Table 7 shows the results of the statistical indexes presented in this study in order to verify the accuracy of the equations presented by using GEP and NLR in predicting discharge coefficient for both states of train and test. Careful consideration of the table indicates that R2 is more and less than 0.9 in both states of train and test of GEP and
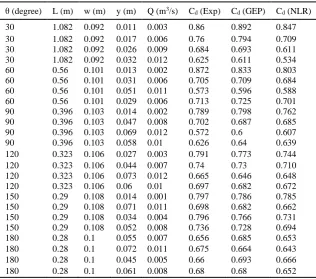
NLR respectively. It could also be seen that the average relative error is approximately 2.5% for GEP in test state and it is almost 4.5% for NLR. It is also observed that the results of RMSE and SI indexes for GEP are less than NLR and considering the fact that approaching these two indexes to zero indicates the higher accuracy of the model, it could be stated that the GEP model presented in this study is relatively less accurate with regard to the results obtained from NLR. The values predicted using equations (7), (GEP), and (13), (NLR), are presented in Table 8 for different hydraulic conditions.
Table 7. Comparing different statistical indexes for the discharge coefficients predicted by using GEP and NLR
Statistics Train Test
Indexes GEP (Eq.7) NLR (Eq. 13) GEP (Eq.7) NLR (Eq. 13)
RMSE 0.015 0.044 0.021 0.040 MAPE (%) 1.620 4.664 2.538 4.583
CE 0.780 0.341 0.699 0.495
SI 0.020 0.061 0.029 0.055
Table 8. Predicted coefficient of discharge using GEP and NLR θ (degree) L (m) w (m) y (m) Q (m3/s) C
d (Exp) Cd (GEP) Cd (NLR) 30 1.082 0.092 0.011 0.003 0.86 0.892 0.847 30 1.082 0.092 0.017 0.006 0.76 0.794 0.709 30 1.082 0.092 0.026 0.009 0.684 0.693 0.611 30 1.082 0.092 0.032 0.012 0.625 0.611 0.534 60 0.56 0.101 0.013 0.002 0.872 0.833 0.803 60 0.56 0.101 0.031 0.006 0.705 0.709 0.684 60 0.56 0.101 0.051 0.011 0.573 0.596 0.588 60 0.56 0.101 0.029 0.006 0.713 0.725 0.701 90 0.396 0.103 0.014 0.002 0.789 0.798 0.762 90 0.396 0.103 0.047 0.008 0.702 0.687 0.685 90 0.396 0.103 0.069 0.012 0.572 0.6 0.607 90 0.396 0.103 0.058 0.01 0.626 0.64 0.639 120 0.323 0.106 0.027 0.003 0.791 0.773 0.744 120 0.323 0.106 0.044 0.007 0.74 0.73 0.710 120 0.323 0.106 0.073 0.012 0.665 0.646 0.648 120 0.323 0.106 0.06 0.01 0.697 0.682 0.672 150 0.29 0.108 0.014 0.001 0.797 0.786 0.785 150 0.29 0.108 0.071 0.011 0.698 0.682 0.662 150 0.29 0.108 0.034 0.004 0.796 0.766 0.731 150 0.29 0.108 0.052 0.008 0.736 0.728 0.694 180 0.28 0.1 0.055 0.007 0.656 0.685 0.653 180 0.28 0.1 0.072 0.011 0.675 0.664 0.643 180 0.28 0.1 0.045 0.005 0.66 0.693 0.666 180 0.28 0.1 0.061 0.008 0.68 0.68 0.652
Considering the estimation of coefficient of discharge relation and discharge equation on sharp-crested weir under free flow in channel, defined as follow, equation (7) shows the outflow as:
𝑄 =2
3𝐶𝑑√2𝑔𝐿𝑦
1.5 (14)
where Cd is coefficient of discharge, w/y the ratio of crest height to head over the
crest of the weir, L/W ratio of crest length of water to channel width, L/y the ratio of crest length of water to the head over the crest of the weir, F Froude number, L crest length of water, y head over the crest of the weir, g acceleration due to gravity and 𝜃
6
Conclusions
There are many ways to control flood such as using weirs which are either located aside or along the channel. To predict the coefficient of discharge of a weir along the channel, the present study made use of the ratio of crest height to head over the crest of the weir (p/y), crest length of water to channel width (L/W), crest length of water to the head over the crest of the weir (L/y), Froude number (F=V/√(gy)) and vortex angle (θ) and an equation has been presented as equation 7 using GEP. The accuracy of the presented model was examined through taking different statistical indexes into consideration and the results indicated that equation 7 predicts discharge coefficient with an approximate relative error of 2.5% for hydraulic conditions which had no role in training the model. Also, the amounts of all the Cd predicted through using this
method had a relative error less than 5%. Following that, different models were presented in order to examine the effect of each of the dimensionless parameters presented in this study. The results demonstrate that vortex angle (θ) parameter had lesser effect in predicting Cd in comparison with the other models. Also, the
simultaneous use of crest height ratio to the head over the crest of the weir (p/y), crest length of water to channel width (L/W), crest length of water to head over the crest of weir (L/W), Froude number (F=V/√(gy)), and vertex angle (θ) dimensionless parameters is necessary in predicting the discharge coefficient. Then, in order to examine the accuracy of the models presented by using GEP, in comparison with nonlinear regression analysis (NLR), an equation was presented through using NLR as equation 13 and the results indicated the higher accuracy of GEP in comparison with NLR.
7
References
1. Taylor, G.: The performance of labyrinth weir. PhD thesis, Nottingham, England. University of Nottingham (1968).
2. Hay, N., Taylor, G.: A computer model for the determination of the performance of labyrinth weirs. In: 13th Congress of IAHR, pp. 361-378, Koyoto, Japan (1969).
3. Tullis, J.P., Amanian, N., Waldron, D.: Design of labyrinth spillways. Journal of hydraulic engineering 121(3), 247-255 (1995)
4. Wormleaton, P.R., Soufiani, E.: Aeration performance of triangular planform labyrinth weirs. Journal of environmental engineering 124(8), 709-719 (1998)
5. Wormleaton, P.R., Tsang, C.C.: Aeration performance of rectangular planform labyrinth weirs. Journal of environmental engineering 126(5), 456-465 (2000).
6. Emiroglu, M.E., Baylar, A.: Influence of included angle and sill slope on air entrainment of triangular planform labyrinth weirs. Journal of hydraulic engineering 131(3), 184-189 (2005).
7. Tullis, B.P., Young, J.C., Chandler, M.A.: Head-discharge relationships for submerged labyrinth weirs. Journal of Hydraulic Engineering 133(3), 248-254 (2007).
8. Bagheri, S., Heidarpour, M.: Application of free vortex theory to estimating discharge coefficient for sharp-crested weirs. Biosystems engineering 105(3), 423-427 (2010) 9. Kumar, S., Ahmad, Z., Mansoor, T.: A new approach to improve the discharging capacity
10. Ebtehaj, I., Bonakdari, H.: Bed load sediment transport estimation in a clean pipe using multilayer perceptron with different training algorithms. KSCE Journal of Civil Engineering 20(2), 581-589 (2016)
11. Bonakdari, H., & Ebtehaj, I. (2014). Verification of equation for non-deposition sediment transport in flood water canals. In: 7t International conference on fluvial hydraulics, RIVER FLOW, pp. 1527-1533, (2014)
12. Azimi, H., Bonakdari, H., Ebtehaj, I., Talesh, S.H.A., Michelson, D.G., Jamali, A.: Evolutionary Pareto optimization of an ANFIS network for modeling scour at pile groups in clear water condition. Fuzzy Sets and Systems 319, 50-69 (2017).
13. Ebtehaj, I., Bonakdari, H.: Evaluation of sediment transport in sewer using artificial neural network. Engineering Applications of Computational Fluid Mechanics 7(3), 382-392 (2013).
14. Azimi, H., Bonakdari, H., Ebtehaj, I.: Sensitivity analysis of the factors affecting the discharge capacity of side weirs in trapezoidal channels using extreme learning machines. Flow Measurement and Instrumentation 54, 216-223 (2017).
15. Azimi, H., Bonakdari, H., & Ebtehaj, I.: Design of radial basis function-based support vector regression in predicting the discharge coefficient of a side weir in a trapezoidal channel. Applied Water Science 9(4), 78 (2019).
16. Azimi, H., Shabanlou, S., Ebtehaj, I., Bonakdari, H., Kardar, S.: Combination of computational fluid dynamics, adaptive neuro-fuzzy inference system, and genetic algorithm for predicting discharge coefficient of rectangular side orifices. Journal of Irrigation and Drainage Engineering 143(7), 04017015 (2017).
17. Ebtehaj, I., Bonakdari, H., Gharabaghi, B.: Development of more accurate discharge coefficient prediction equations for rectangular side weirs using adaptive neuro-fuzzy inference system and generalized group method of data handling. Measurement 116, 473-482 (2018).
18. Emiroglu, M.E., Kisi, O., Bilhan, O.: Predicting discharge capacity of triangular labyrinth side weir located on a straight channel by using an adaptive neuro-fuzzy technique. Advances in Engineering Software 41(2), 154-160 (2010).
19. Bilhan, O., Emiroglu, M. E., Kisi, O.: Application of two different neural network techniques to lateral outflow over rectangular side weirs located on a straight channel. Advances in Engineering Software 41(6), 831-837 (2010)
20. Emiroglu, M.E., Bilhan, O., Kisi, O.: Neural networks for estimation of discharge capacity of triangular labyrinth side-weir located on a straight channel. Expert Systems with Applications 38(1), 867-874 (2011).
21. Zakaria, N.A., Azamathulla, H.M., Chang, C.K., Ghani, A.A.: Gene expression programming for total bed material load estimation—a case study. Science of the total environment 408(21), 5078-5085 (2010).
22. Ghani, A.A., Azamathulla, H.M.: Gene-expression programming for sediment transport in sewer pipe systems. Journal of pipeline systems engineering and practice 2(3), 102-106, (2011)
23. Khan, M., Azamathulla, H.M., Tufail, M., Ghani, A.A.: Bridge pier scour prediction by gene expression programming. Proceedings of the Institution of Civil Engineers 165(9), 481-493 (2012)
24. Guven, A., Azamathulla, H.M.: Gene-expression programming for flip-bucket spillway scour. Water Science and technology 65(11), 1982-1987 (2012).
26. Koza, J.R.: Genetic Programming: On the Programming of Computers by Means of Natural Selection. A Bradford Book, MIT Press: Cambridge, Mass, (1992).
27. Azamathulla, H.M., Ahmad, Z., Ghani, A.A.: computation of discharge through side sluice gate using gene‐expression programming. Irrigation and Drainage 62(1), 115-119 (2013). 28. Ferreira, C.: Gene Expression Programming in Problem Solving, invited tutorial of the 6th
Online World Conference on Soft Computing in Industrial Applications. Origins of Functionalist Theory9, 10-24 (2001).
29. Ferreira, C.: Gene expression programming: a new adaptive algorithm for solving problems. Complex Systems 13, 87-129 (2001).
30. Ferreira, C.: Gene Expression Programming: Mathematical Modeling by an Artificial Intelligence. 2nd Edition, Springer-Verlag, Germany (2006).
31. Dursun, O.F., Kaya, N., Firat, M.: Estimating discharge coefficient of semi-elliptical side weir using ANFIS. Journal of hydrology 426, 55-62 (2012).
![Table 1. Parameters used to estimate discharge coefficient [9]](https://thumb-us.123doks.com/thumbv2/123dok_us/7932229.1317089/3.595.120.418.565.616/table-parameters-used-estimate-discharge-coefficient.webp)