Comparative Analysis of Genetic Algorithm Based
Approach for Gene Cancer Classification using
prominent features with PSO for Dimensionality
Reduction and FFBNN as Classifier
Vaishali P Khobragade, M.Anup Kumar
Vivekananda Institute of Technology & Science, CSE Department, JNTU Hyderabad Karimnagar, Telangana 505001, India
Abstract: The advancement in genome technology has change the outlook of the researchers in the field of gene cancer classification. These developed techniques mainly comprises of, dimensionality reduction, feature selection, and gene classification for the ;process of gene cancer classification.. In our work, microarray gene classification by GA with FFBNN was proposed for precise classification of genes to their corresponding gene types. But, it is not sure that the GA and FFBNN will perform their operations properly in gene classification process. Thus, analysis is necessary for the techniques that are utilized in the gene classification process. Hence, in this study, we present a comparative analysis of familiar methods that are utilized in the microarray gene classification process. We compare the GA with FFBNN approach with that of PSO with FFBNN .The performances of the classification methods are evaluated by the performance measures such as accuracy, specificity, and sensitivity. Moreover, the classification performance of each method is compared with the other methods to validate the high score performance in microarray gene classification.
Keywords - Microarray gene expression, Classification, Dimensionality Reduction, Feature Selection, Genetic Algorithm (GA), Feed Forward Back propagation Neural Network (FFBNN)Partial Swarm Optimizer(PSO).
I. INTRODUCTION
With the aid of deoxyribonucleic acid (DNA) microarray technology, it is possible to determine the expression levels of vast number of different genes simultaneously [9]. Microarray techniques also play an imperative role in personalized medicine for the reason that they can be used to find out the individual’s unique genetic vulnerability to treat the diseases [1]. A standard microarray dataset comprises the expression levels of large number of genes in a number of experimental samples or conditions [10]. The expression data is represented in a matrix form, where the rows indicate genes and the columns indicate samples and this form of matrix is called as gene expression matrix [11]. For disease analysis especially for cancer diagnosis, the gene expression data is often employed [8]. Gene expression data from DNA microarray are represented by several variables (genes) with only a small number of observations (experiments) [7] [17]. Prediction, classification, and clustering methods are utilized for analysis and understanding of the data [2]. One significant application of gene expression microarray data is the
here we proposed a comparative analysis of well known methods that are used in the microarray gene classification process. The performances of well-known methods such as GA (Genetic Algorithm) are analyzed with the AI techniques namely, FFBNN. The methods that are employed for microarray gene classification process are GA with FFBNN All these methods separately perform the aforementioned three basic steps. The performances of the classification methods are evaluated by the performance measures such as accuracy, specificity, and sensitivity. The rest of the paper is organized as follows: Section 2 reviews the recent related works of the microarray gene classification process. The well known classification method such as GA and PSO with FFBNN is explained in Section 3. The experimental result and conclusion of this paper are given in Section 4 and 5, respectively.
II RELATED WORK
There has been huge amount of work carried out in literature for the successful microarray gene cancer classification. Here we review some of the recent works available in the literature[30][31].Ahmad M. Sarhan [20] has introduced an Artificial Neural Network (ANN) and Discrete Cosine Transform (DCT) based system for the identification of stomach cancer. Here, DCT has been applied to extract the classification features from the stomach microarrays. Subsequently, the features extracted from the DCT coefficients have been applied to an ANN for the classification in order to find whether the microarray contains tumor or non-tumor. Here, microarray images have been taken from the database called Stanford Medical Database (SMD), which is one of the famous microarray databases. From the simulation results, it has been found that the proposed system has achieved a very high success rate.Bharathi et al. [21] have aimed to identify the minimum set of genes that can provide an exact classification of cancer from microarray data with the aid of supervised machine learning algorithms. The proposed method comprises two steps. In the first stage, a 2 way Analysis of Variance (ANOVA) ranking approach has been employed to select some relevant genes. While in the second stage, a good classifier called Support Vector Machines has been applied to analyze the classification potency of all simple combinations of those relevant genes. Finally, the proposed method has achieved a very high precision with only two genes. Gene expression data gathered from DNA microarray are characterized by several variables (genes) with only a little number of observations i.e., experiments. Bo Li et al. [22] have presented a manifold learning technique to map the gene expression data to a low dimensional space, and then to analyze the basic structure of the features in order to categorize the microarray data more precisely. The proposed algorithm has projected the gene expression data into a subspace with high intra-class compactness and inter-class separability. Experiments conducted on six DNA microarray datasets have proved that the proposed method was efficacious for discriminant feature extraction as well as gene expression data classification. It has been found that evaluating microarray data using manifold learning
datasets and it has been found that the technique was faster than neural network and the classification performance was also high compared to neural network.
III. MICROARRAY GENE CANCER CLASSIFICATION As discussed our previous work[30] the microarray gene classification technique involves three major steps namely (i) Dimensionality reduction, (ii) Feature selection, and (iii) Gene classification. The GA technique performs the dimensionality reduction process for obtaining the dataset with small size. The features like Standard Deviation, Probability of GA-indexed gene, and new statistical features are extracted from the dimensionality reduced dataset. After that, the gene classification is carried out by using the features extracted during the feature extraction process. Here we use FFBNN perform the gene classification process. The basic microarray gene classification process is explained in the following subsections.
DIMENSIONALITY REDUCTION
Initially,[30]the dimensionality reduction process is carried out on the microarray cancer gene dataset for diminishing the complexity in the gene classification. This process is performed because the dataset size is high dimensional, which increases the processing time and does not produce accurate result for the classification process. Let,
G
j
S
i
M
ij;
1
,
1
be the microarray cancer gene data, where,S
indicates the number of samples andG
indicates the number of genes. DatasetM
ij containsN
number of cancer class types, which is represented as}
,
,
{
1 2 Nc
l
l
l
D
. The gene dataset can berepresented as,
) , ( ) 2 , ( ) 1 , ( ) , 2 ( ) 2 , 2 ( ) 1 , 2 ( ) , 1 ( ) 2 , 1 ( ) 1 , 1 ( G S S S G G ijg
g
g
g
g
g
g
g
g
M
(1) Each row and column of the gene expression dataset index values are represented as,}
,
,
{
},
,
,
{
1 2 G j 1 2 Si
r
r
r
C
o
o
o
R
(2)
DIMENSIONALITY REDUCTION BY GA
The dimensionality reduction by GA process is briefly explained in the prior work[30]. Initially in GA, the initial chromosome, Cm[r11(m) r22(m) r33(m) rnK(m)] ;
1
0mNp , where
K
is the value based on size of thechromosome and
n
represents the genes row index value inM
ij wheren
r
G. The fitness function is carried outto choose the best chromosomes among the generated chromosomes. The fitness function is given as,
1 ) ( ) ( ) ( ) ( ) ( ) (
*
*
*
*
*
1
2 1 ) (t
T
E
S
S
S
S
f
m m N s m C C l l l C
(3)where, ( )
) (s m
C
S
is the standard deviation of thechromosome (s)
m
C
andS
(l1),
S
(l2),
S
(lN) are also the standard deviations of the genes cancer class types. All the generated chromosomes gene values are given to the networks such as FFBNN, ANFIS and Fuzzy ANN toobtain the error (
E
(Cm)) and time (T
(Cm)) parametersof the chromosome
C
m.E
(Cm) is the error producedwhen the networks are trained by the chromosome
C
m.Time parameter
T
(Cm)represents the time taken by the networks to train theC
m, and 1t
is the defined thresholdvalue. The best
N
p/
2
chromosomes containingminimum fitness values are selected. The selected chromosomes are involved in the crossover and mutation operations with the single point crossover at crossover rate
R
C
and mutation rateM
R, respectively. This process is repeated until it reaches the utmost number of iterationsI
. Once it reachesI
, theN
p/
2
chromosomes havingminimum fitness value are selected. The dimensionality reduced dataset from GA is represented as
P
uv.
DIMENSIONALITY REDUCTION BY PSO
The dimensionality reduction process is performed over the microarray gene expression dataset
M
ij by utilizing anoptimization algorithm called PSO. The procedure of PSO is discussed below. PSO define each particle as a possible solution to a problem in D-dimensional space. We arbitrarily generate initial particles for genes and velocities for each particle. The randomly generated initial particles and velocity of each particle are represented as,
)
p
...
p
,
p
,
p
(
P
1 2 3 nn
= 1, 2, 3……X
(4))
v
...
v
,
v
,
v
(
V
1 2 3 nn
1, 2, 3 ……X
(5)The generated particles and velocities are bounded between the minimum and maximum values i.e., all particles should be within the specified intervals. Before each iteration, the particles are checked to find whether those particles are within the intervals. The gene values of particles are randomly generated between the intervals
particles, the maximum fitness value is selected as an optimum value. Initially, the optimum value is considered as a pbest (flocal) value and then as a gbest (fglobal) value. The evaluation function can be calculated as,
1 2 1
t
*
T
*
E
S
*
S
*
S
*
S
F
) p ( ) p (
) l ( ) l ( ) l ( ) p (
n n
N )
s (
n
(6)
where, (p ) ) s ( n
S
is the standard deviation of theparticle (s)
n
p
andS
(l1),
S
(l2),
S
(lN) are also the standard deviations of the genes cancer class types. All the generated particles gene values are given to the networks such as FFBNN, ANFIS and Fuzzy ANN to obtain theerror (
E
(pn )) and time (T
(pn)) parameters of the particlep
n .E
(pn) is the error produced when the networks are trained by the particlep
n. Time parameter) p ( n
T
is the time taken by the networks to train thep
n, and 1t
is the defined threshold value. In initial iteration, the values of velocity are assigned as zero. Using the randomly generated and initial velocity of particles, the fitness values of these particles are determined. We define pbest and gbest values from this fitness result. The pbest value is called local best and gbest value is called global best. All particles having fitness values evaluated by the fitness function need to be optimized. The particles fly through the problem space by following the current optimum particles. After finding the best values, all particles try to change its position and velocity. To change the position, two data are used. First one is the distance between the current particle position and pbest, and second one is the distance between the current position and gbest. This modification can be represented by velocity. Velocity of each particle can be modified by using the following equations,) x fglobal ( ) ( r f ) x flocal ( ) ( r f V
Vn(o1) n(o) 11 n n(o) 22 n (no) (7)
) o ( n ) o ( n ) o (
n
x
V
x
1
1 (8)Where,
V
n(o) is the velocity of nth particle at iterationo, and
f
1,f
2 are the learning factors.flocal
is the position of the best fitness value of the particle at current iteration,fglobal
is the position of the particle with thebest fitness value in the swarm,
r
1,
r
2 are the randomnumbers generated in the range of [0, 1] and
x
(no) is the current position of the particlen
at iteration o. Each particle knows its best value (pbest) and position. Also, each particle knows the best value in the group (gbest) among the pbest. Particles change their position andvelocity for each iteration until it reaches the termination criteria. This process is repeated until the utmost number of iterations is reached. Once the maximum number of iterations is achieved, then the process gets terminated. The last solution pointing the particle is considered as the best possible particles. The dimensionality reduced dataset from
PSO is represented as ' uv
P
.FEATURE SELECTION
The features [30] are selected from the dimensionality
reduced datasets
P
uv and ' uvP
. The features like StandardDeviation, Probability of GA-indexed gene, and new statistical features are selected from the dimensionality reduced dataset. The features that are selected from the dataset
uv
P
are briefly explained in the previous work.From this dataset, the extracted features are
F
(d),F
(c), )A (
F
,F
(D),F
(p) andF
(ss) . Also, the similar features are extracted from the dataset 'uv
P
, which isrepresented as
F
(d)',F
(c)',F
(A)',F
(D)',F
(p)'and
F
(ss)'.GENE CLASSIFICATION
Using the SD, Probability of GA-indexed gene, and new statistical features determined in the previous phase, the gene classification process is carried out. To perform the classification process, here we utilized three AI techniques such as Feed Forward Back Propagation Neural Network (FFBNN), ANFIS, and Fuzzy NN. Each technique is trained and tested with the features that are obtained from
the dataset uv
P
and 'uv
P
, individually.CLASSIFICATION USING FFBNN Classification by FFBNN using the features from
uv
P
isalready explained in our previous work[30]. In this classification process, the FFBNN is designed with six input neurons,
H
d hidden layers, and one output layer. The FFBNN training process is performed with the bias and activation functions of input and output layers, respectively. After that, the network learning error rate is calculated and the error gets minimized by allocating weights to the hidden layer and output layer neurons via back propagation algorithm. Testing process is done for the column gene values in the dimensionality reduced datasetuv
P
. The well trained FFBNN classifies the column gene values into any one of the cancer class types by using the extracted features. The same FFBNN training and testingprocess is performed with the features from ' uv
P
.
The proposed classification technique is implemented in the MATLAB platform version 7.8 and evaluated using the microarray gene expression dataset. The dataset contains number of genes and samples i.e., 675x156. The high dimensional dataset is subjected to dimensionality reduction using a GA and PSO. The dimensionality reduced dataset from GA and PSO are the dimension of 10x156. Among these 156 samples, 1 to 139 samples are AD class type and 140 to 156 samples are NL class type. Then, the feature selection process is performed over the dimensionality reduced datasets and these selected features are given to the FFBNN, training and testing process. The FFBNN training and testing process is explained in our previous work[30].The abovementioned procedure is performed until all samples are involved in both training and testing process. The performance of proposed technique is evaluated by using the statistical measures. The statistical measures [27] are applied to determine the classification performance. The performance analysis has shown that the proposed technique has successfully classified the genes to their specified gene types. To analyze the performance of GA and PSO methods, the parameters in GA and PSO values are changed. The parameters of GA such as crossover, chromosome length, and mutation rate are changed as well as the PSO parameters such as population size and chromosome length are also changed.
PERFORMANCE OF GA WITH FFBNN From the parameter tuning process, the best and worst case values are selected and the performance of these selected best and worst case values are compared with the SVM best case values.
Based on the parameter tuning process he best and worst case values TP, TN, FP and FN are identified.
Statistical Measures
Number of GA
indexed genes Best Case Worst Case
Sensitivity (%)
10 96.40 89.21
20 99.28 89.93
30 99.28 87.77
FPR (%)
10 52.94 58.82
20 35.29 70.59
30 41.18 70.59
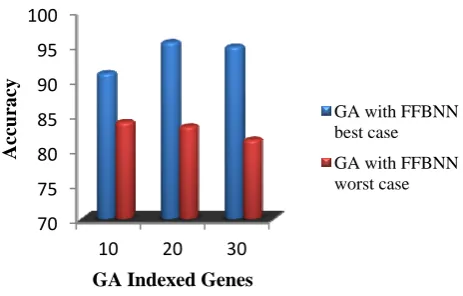
Accuracy (%)
10 91.03 83.97
20 95.51 83.33
30 94.87 81.41
Specificity (%)
10 47.06 41.18
20 64.71 29.41
30 58.82 29.41
PPV (%)
10 93.71 92.54
20 95.83 91.24
30 95.17 91.04
NPV (%)
10 61.54 31.82
20 91.67 26.32
30 90.91 22.73
FDR (%)
10 6.29 7.46 20 4.17 8.76 30 4.83 8.96
MCC (%)
10 49.00 27.20
20 74.83 18.43
30 70.72 15.38
Table 1: Performance of GA with FFBNN best, worst cases
The statistical performance analysis of the GA method has given 93.7 overall mean accuracy in the best case and in the worst case it has given 82.6% accuracy as result. To analyze the performance of the GA methods, these techniques are compared with the existing SVM classifier. This GA method best and worst case statistical measures are compared with the SVM is shown in the figures.
Figure 1: GA methods with FFBNN as classifier
The comparison graph 3 shows that the existing method has low classification performance than GA in all 10, 20 and 30 GA indexed gene values. The GA gene classification method has shown a high accuracy than the existing SVM classifier.
Performance of PSO with FFBNN
To analyze the performance of GA ,we use PSO method for dimentionality reduction , the parameters in PSO values are changed. The PSO parameters such as population size and chromosome length are also changed. In PSO, population and the particles lengths are changed in the performance analysis process. The best and worst case values are selected and the performance of these selected best and worst case values are compared with the SVM best case values. Table 8 tabulates the TP, TN, FP, and FN values from the PSO.
Population size
Particles Length
True Positive
(TP)
False Positive
(FP)
True Negative
(TN)
False Negative
(FN) ACC
10
10 131 12 5 8 87
20 139 7 10 0 96
30 133 9 8 6 90
20
10 130 5 12 9 91
20 137 7 10 2 94
30 134 8 9 5 92
30
10 133 5 12 6 93 20 131 6 11 8 91
30 136 7 10 3 94
Table 2: PSO parameters modification results of TP, FP, TN and FN values
Based on the accuracy values in table 8, the best and worst case values TP, TN, FP and FN are identified. The best and worst case values in table 8 are represented in bold, italic
70 75 80 85 90 95 100
10 20 30
Accuracy
GA Indexed Genes
formats. These best and worst cases statistical measure values are tabulated in the table 8.
Statistical Measures
Particles
Length Best Case Worst Case
Sensitivity (%)
10 100 94 20 99 94 30 98 94
FPR (%)
10 41.2 70.6 20 41.2 29.4 30 41.2 35.3
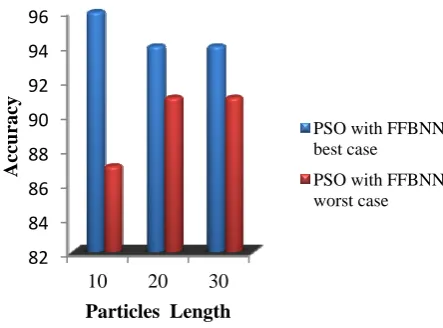
Accuracy (%)
10 96 87 20 94 91 30 94 91
Specificity (%)
10 59 29 20 59 71 30 59 65
PPV (%)
10 95 92 20 95 96 30 95 96
NPV (%)
10 100 38 20 83 57 30 77 58
FDR (%)
10 5 8 20 5 4 30 5 4
MCC (%)
10 74.1 27.3 20 66.4 57.1 30 63.2 55.2 Table 3: Performance of PSO with FFBNN
When compared with the GA with FFBNN method the PSO with FFBNN provides low accuracy than proposed GA with FFBNN with respect to GA index 20 and 30.
Figure 2: PSO with FFBNN
The statistical performance analysis of the GA and PSO methods has given 93.7&93.4% overall mean accuracy in the best case and in the worst case it has given 82.6&89.5% accuracy as result.
REFERENCES
[1] Mark A. Iwen, Willis Lang and Jignesh M. Patel, "Scalable Rule-Based Gene Expression Data Classification", In Proceedings of the IEEE 24th International Conference on Data Engineering, 2008 [2] Nguyen and Rocke, Classification of Acute Leukemia based on
DNA Micro array Gene Expressions using Partial Least Squares, Kluwer Academic, Dordrecht, 2001
[3] Jian J. Dai, Linh Lieu, and David Rocke, "Dimension Reduction for Classification with Gene Expression Micro array Data", Statistical Applications in Genetics and Molecular Biology: Vol. 5, No. 1, 2006 [4] Alok Sharma and Kuldip K. Paliwal, "Cancer classification by
gradient LDA technique using micro array gene expression data", Data & Knowledge Engineering, Vol. 66, pp. 338-347, 2008 [5] Yuh-Jye Lee and Chia-Huang Chao, "A Data Mining Application to
Leukemia Micro array Gene Expression Data Analysis", International Conference on Informatics, Cybernetics and Systems (ICICS), Kaohsiung, Taiwan, 2003
[6] Donald Geman, Bahman Afsari, Aik Choon Tan and Daniel Q. Naiman, "Micro array Classification from Several Two-Gene Expression Comparisons", In Proceedings of ICMLA, pp.583-585, 2008
[7] Chun-Hou Zheng, Bo Li, Lei Zhang and Hong-Qiang Wang, "Locally Linear Discriminant Embedding for Tumor Classification", In Proceedings of ICIC, pp.1093-1100, 2008
[8] Cheng-San Yang, Li-Yeh Chuang, Chao-Hsuan Ke and Cheng-Hong Yang, "A hybrid Feature Selection Method for Micro array Classification", International Journal of Computer Science, Vol. 35, No. 3, 2008
[9] James J. Chen and Chun-Houh Chen, "Micro array Gene Expression", Encyclopedia of Biopharmaceutical Statistics, 2nd Edition, Marcel Dekker, Inc., pp. 599-613, 2003
[10] Gad Getz, Erel Levine and Eytan Domany, "Coupled two-way clustering analysis of gene micro array data", In Proceedings of the National Academy of Sciences, Vol. 97, No. 22, pp. 12079-12084, 2000
[11] Andrej Kastrin, "Item Response Theory Modeling for Micro array Gene Expression Data", Advances in methodology and statistics, Vol. 6, No. 1, pp. 51-67, 2009
[12] Srinivas Mukkamala, Qingzhong Liu, Rajeev Veeraghattam and Andrew H. Sung, "Computational Intelligent Techniques for Tumor Classification (Using Micro array Gene Expression Data)", In Proceedings of World Congress on Lateral Computing, 2005 [13] Fei Pana, Baoying Wanga, Xin Hub and William Perrizoa,
"Comprehensive vertical sample-based KNN/LSVM classification for gene expression analysis", Journal of Biomedical Informatics, Vol. 37, pp. 240–248, 2004
[14] Peng Qiu, Z. Jane Wang and Ray Liu, "Ensemble Dependence Model-based Cancer Classification using Gene Micro array Data", IEEE International Workshop on Genomic Signal Processing and Statistics (GENSIPS), 2005
[15] Seeja and Shweta, "Microarray Data Classification Using Support Vector Machine", International Journal of Biometrics and Bioinformatics (IJBB), Vol. 5, No. 1, pp. 10-15, 2011
[16] Manoj Kumar, "The Widely Used Diagnostics “DNA Microarray”-A Review", American Journal of Infectious Diseases, Vol. 5, No. 3, pp. 207-218, 2009
[17] Danh V. Nguyen, David M. Rocke, "Tumor Classification by Partial Least Squares Using Micro array Gene Expression Data", Bioinformatics, Vol. 18, No. 1, pp. 39-50, 2002
[18] Pengyi Yang and Zili Zhang, "An Embedded Two-Layer Feature Selection Approach for Microarray Data Analysis", IEEE Intelligent Informatics Bulletin, Vol.10, No.1, pp. 24-32, 2009
[19] Yee Hwa Yang and Natalie P. Thorne, "Normalization for Two-color cDNA Microarray Data", Science and Statistics: A Festschrift for Terry Speed, Vol. 40, pp. 403-418, 2003
[20] Ahmad M. Sarhan, "Cancer Classification Based on Micro array Gene Expression Data Using DCT and ANN", Journal of Theoretical and Applied Information Technology, Vol. 6, No. 2, pp. 208-216, 2009
[21] Bharathi and Natarajan, "Cancer Classification of Bioinformatics data using ANOVA", International Journal of Computer Theory and Engineering, Vol. 2, No. 3, pp. 369-373, June 2010
[22] Bo Li, Chun-Hou Zheng, De-Shuang Huang, Lei Zhang and Kyungsook Han, “"Gene expression data classification using locally linear discriminant embedding", Computers in Biology and Medicine, Vol. 40, pp. 802–810, 2010
[23] Xiaosheng Wang and Osamu Gotoh, "A Robust Gene Selection Method for Micro array-based Cancer Classification", Journal of Cancer Informatics, Vol. 9, pp. 15-30, 2010
[24] Mallika and Saravanan, "An SVM based Classification Method for Cancer Data using Minimum Micro array Gene Expressions", World
82 84 86 88 90 92 94 96
10 20 30
Accuracy
Particles Length
PSO with FFBNN best case
Academy of Science, Engineering and Technology, Vol. 62, No. 99, pp. 543-547, 2010
[25] Chhanda Ray, "Cancer Identification and Gene Classification using DNA Micro array Gene Expression Patterns", International Journal of Computer Science Issues, Vol. 8, Issue 2, pp. 155-160, March 2011
[26] Seeja and Shweta, "Microarray Data Classification Using Support Vector Machine", International Journal of Biometrics and Bioinformatics (IJBB), Vol. 5, No. 1, pp. 10-15, 2011
[27] http://en.wikipedia.org/wiki/Sensitivity_and_specificity
[28] AnandaKumar and Punithavalli, "Efficient Cancer Classification using Fast Adaptive Neuro-Fuzzy Inference System (FANFIS) based on Statistical Techniques", International Journal of Advanced Computer ScienceandApplicationspp.132-1372011.
[29] Heiss, Held, Estévez, Perez,Holzmann and Perez, "Classification of Sleep Stages in Infants: A Neuro Fuzzy Approach", IEEE Engineering in Medicine and Biology Magazine, Vol. 21, No. 5, pp. 147-51., 2002
[30] P.K.Vaishali & Dr.A.VinayaBabu.”,A Classification of Microarray Gene Expression Data Using Hybrid Soft Computing Approach”, IJCSI Vol 9,Issue 6.