July, 1974
Measured Crop Performance
SMALL GRAIN
1974
JOHN C. RICE, Professor
A. R. ADAMS, Research Assistant
E. L. JONES, Agricultural Research Supervisor
G.
C. OLIVER, Agricultural Research AssistantDepartment of Crop Science NORTH CAROLINA STATE UNIVERSITY
TABLE OF CONTENTS
INTRODUCTION ...•••.••.•••.•..•.•.•.••••••.••.•.•••••••..••••.•••
EXPERI11ENTAL PROCEDURE ••...••.•...••.•.•.••.•.•.•••••••.•.•••0 • •
Agencies Sponsoring Entries .•.••••.•.••.•.••••••.••••••••.0
Test Locations •.••...•••.•.••...•.••.•.•••••••••••••••.•
CuI tural Prac tices ..•.••••.••.•.•••.••••••.•.••••.••••••.••
Seasonal Conditions •.••••.•.•••••••••••.•.••••.•.•.••••.•••
RESULTS AND DISCUSSION •.••••.•.••.•••.••••••.••••.•.••••...•••••
Barley ••••.•.•.••.•.•.••••.•.••.•.•.••.•.••••.•.0• • • •0 • • • • •
Oats •.••.•.••.•.•.••••••.••••••.•.••.•.••••.••••••.•.•••••.
Wheat .
Lodging
TABLES
Cultural practices
Characteristics of varieties •.••••.•.••••.•.••••.•••••..•.•
Barley performance in the Piedmont •.••••.•.••••••.••••...••
Barley performance in the Coastal Plain •.••••••.•••.•.•••••
Oat performance in the Piedmont ..•.••••.•••••••••••.•••••••
Oat performance in the Coastal Plain .•••••••••.•.••.•.•.••.
Wheat performance in the Piedmont ..••••.•••.••••.••••.•.•.•
Wheat perfonmance in the Coastal Plain ..•.••.•.•.•••0• • • • • • Lodging Data ..•••.••.••.•.•.••.•.••.•.•.•••••••••••.•.•.•.•
1974
PERFOIU1A1~CE OF SJ:v1ALL GRAIN VARIETIES IN NORTH CAROLINA
John C. Rice, E. L. Jones, Go C. Oliver, Ray Adams
l /
INTRODUCTION
The Official Variety Test on Small Grain varieties in North Carolina
is conducted annually by locating evaluation trials throughout the small
grain producing area of the state. These tests are conducted to determine
the value and suitability of commercially available and prospective
varieties of wheat, oats and barley for planting in North Carolina. The
results of these tests are intended to aid the growers and agricultural
workers in the selection of a variety best suited for their particular
area of the state or region.
Wheat production in North Carolina for the
1973-74
season is forecastat
8,400,000
bushels. This would be an increase of50
percent over the1973
crop. Acreage to be harvested for grain is estimated at210,000
or50,000
acres above the1973
harvested acreage.It is estimated that the yield per acre for the 197L~ crop will be
40
bushels per acre. This would be up five bushels from last year.The United States winter wheat production is forecast at a new record
high of
1,612
million bushels,27
percent above the previous high set lastyear and
36
percent above the1972
crop. This increase is attributed tomore acres for harvest and a higher average yield.
4
u.
S. acreage to be harvested for grain is estimatec at 45.8 millionacres for 1974. This is 19 percent above 1973 and 31 percent over 1972.
Yield per acre is expected to average 35.2 bushels per acre, nearly equal
to the record high set in 1971 and more than two bushels above last year's
average.
In North Carolina the oat acreage planted in the Fall of 1973 and
Spring of 1974 was 155,000 acres. This was three percent less than last
year's planted acreage and the lowest planted acreage since 1928.
The U. S. growers anticipated seeding a total of 18.9 million acres
to oats. Combined seedings last fall and intentions this spring are off
one percent from the 1973 acreage. Acreage devoted to oats has shown a
do~mward trend since the mid-1950's and the intended 1974 seedings would be
the smallest of this century_
The 1973-74 oat crop in North Carolina is estimated to yield 50 bushels
per acre. This would be an increase of five bushels per acre over the 1972
crop.
In 1973 the barley production in North Carolina was harvested from
62,000 acres with a yield of 46 bushels per acre. The 1973 acreage is
estimated at 70,000 acres. This is five percent below the 1973 crop and
seven percent below the 1972 planted acreage. The price increased from
1972 to 1973 by an average of from 0.98 to $1.50 per bushel.
Information on varietal performance is presented from six test
locations in the state, three in the Piedmont and three in the Coastal
Plain Area. In comparing the performance of varieties, data from the
area which most nearly represents the grower's conditions should be
variety which looks superior for one year may not be consistently
good, hence, varieties should be evaluated on the basis of performance
over several years. Depending upon the release date of the entry, data
are presented for performance from one to five years. All available
2/
data- were used in determining the pathologic and agronomic characteristics
of the varieties.
~/Special
acknowledgment is due Drs. T. 1. Hebert and C. F. Murphy for their6
EXPERIMENTAL PROCEDURE
Commercial varieties and experimental lines developed by public
and private agencies are included in these tests. Any individual or
firm may make application for having entries included by writing the
Department of Crop Science, North Carolina State University at Raleigh.
A fee is charged on an entry basis for all private entries. Personnel
of the testing program may include entries about which further information
is desired.
Agencies Sponsoring Entries
Coker's Pedigreed Seed Company
Georgia Agricultural Experiment Station Kentucky Agricultural Experiment Station McNair Seed Company, Inc.
North Carolina Agricultural Experiment Station Purdue University Agricultural Experiment Station South Carolina Agricultural Experiment Station University of Tennessee Agric. Expt. Station Virginia Agricultural Experiment Station
Test Locations
Hartsville, S. C. Athens, Georgia Lexington, Kentucky Laurinburg, N. C. Raleigh, N. C. Lafayette, Indiana Clemson, S. C. Knoxville, Tennessee Blacksburg, Virginia
Six locations were used in
1973-74
with three in the Piedmont and threein the Coastal Pla in as shown in Figure 1. Five tests were located on
. f
11
d hp rLvate ams- an one was on a res.earc station.
with four replications was used at each
location.~1
A randomized block design
111he
cooperative spirit and civic-minded service rendered by the farmers who provided land and the necessary cultural practices for these trials dnd the cooperation of the county agents are gratefully acknowledged.~/Statistical
analyses were made in the statistical laboratory under the1974
LOCATION OF SMALL GRAIN PERFORMANCE TRIALS
CO-OPERATORS
PIEDMONT
Rowan County: Mr. Clyde McSwain, Superintendent, Piedmont Research Station, Salisbury, North Carolina
County Extension Chairman, R. R. McNeely
Stanly County: Mr. Lester Moose, Route 1, New London, North Carolina County Extension Chairman, V. A. Huneycutt
Alamance County: Mr. Raymond Braxton, Route 2, Graham, North Carolina
County Extension Chairman, George R. Coble
COASTAL PLAIN
Nash County: Mr. W. M. Winstead, Route 3, Nashville, North Carolina County Extension Chairman, W. R. Shackelford
Columbus County: Mr. Graham Harrelson, Route 4, Whiteville, North Carolina
County Extension Chairman, Charles D. Raper
8
Cultural Practices
Cultural practices, such as seed bed preparation, date of planting,
fertilization and topdressing were in accord with good farming practices
and were uniform for all entries at a given location, Table 1. Several
months prior to planting each test location, soil samples were obtained
for the test field and fertilizer requirements made in accordance with
the soil analysis report. Lime was applied, if needed, to adjust the pH
to a desirable level for small grain production.
Starting in 1969 all tests were planted with cone-type,
tractor-mounted, spring-loaded disc equipment. The disc allowed for more accurate
seeding in areas with stubble or organic matter on the soil surface.
The seeding rate was one gram per foot of row. The rows were spaced one
foot apart. Each plot consisted of seven rows, 15 feet long with the two
outside rows used as borders. The border rows were removed prior to harvest
and only the five center rows were harvested. The date 6f planting and
fertilization at planting is shown in Table 1 for each test location.
A seven foot combine was modified slightly for harvesting individual
plots. Grain from individual plots was collected as it came from the
elevator and weighed. The combine was stopped at the end of each plot for
a short interval of time in order for the machine to clean out between
plots prior to weighing the grain from the plot. A sample of grain was
taken from each plot for the determination of test weight and moisture.
All plots were adjusted to 13% moisture. All samples were run through a
small thresher to remove the awns and foreign matter prior to taking
under which these varieties would be harvested on farms and it appeared
to give very satisfactory results.
Tests were topdressed with liquid nitrogen and weed control chemicals
during February. Special ackno\vledgment is due
F.e.X.
Wholesale ServicesTable 1. Cultural Practices for small grain tests - 1974.
Area and Fertilizer Topdress-1/ Date of Date of
Cooperator 1b s / A& Grad e lbs / A and date planting harvesting
-Piedmont Area
Stanly County 350 lbs. 65 N Ammonium Nitrate October 17 Barley - June 10
D. G. Harwood 10-20-20 March 1 Wheat - June 10
Oats - June 10
Alamance County 250 lbs. 55 N (1 Lqu i.d ) October 9 Barley - June 12
Raymond Braxton 10-20-20 Feb. 26 Oats - June 25
Wheat - June 12
Rowan County 600 1bs. October 12 Barley - June 10
Clyde McSwain 10-20-20 Oats - June 10 I--'
Wheat - June 10 0
Coastal Plain Area
Nash County 500 lbs. 65 N (1 iquid) October 11 Barley - June 7
W. M. Winstead 4-8-12 Feb. 27 Wheat - June 7
Oats - June 7
Wayne County 300 Lbs , 70 N (liquid) October 29 Barley - June 5
Wayland Price 10-20-20 Feb. 25 Oats - June 5
Wheat - June 5
Columbus County 700 lbs. 65 N (liquid) October 16 Barley - Discarded
Graham Harrelson 2-12-12 Feb. 25 Oats - Discarded
Wheat - Discarded
Seasonal Conditions
The 1973 fall seasonal conditions in North Carolina were characterized
by dry weather especially for two months during the normal small grain
seeding period. In spite of this condition, by the end of November about
85 percent of the state's intended small grain acreage had been seeded.
This was somewhat on schedule although the dry months were a problem with
a shortage of moisture in the Piedmont and very limited moisture conditions
in the Coastal Plain Area.
The six locations for the 1973-74 Official Variety Test; three in the
Piedmont and three in the Coastal Plain were selected to represent small
grain production areas.
~tember 1973: September weather was characterized by low amounts of
precipitation with most areas recording from one to three inches short of
normal rainfall.
October 1973: The dry vJeather continued during October except for a
fevJ showers near the Northern Coast as tropical storm Gilda move northward
off shore. The departure from normal precipitation increased in many areas
from two to three inches up to four to five inches below normal rainfall.
November 1973: Precipitation was reported at many of the reporting points
in the state during November but the rainfall amounts were generally quite
light. By the end of the month, the departure from normal had increased up
to eight inches in the Raleigh area as a shortage since September
10
TheCoastal Plain region was rated in poor shape as moisture supplies were
inadequate.
January 1974: The first month of the 1974 year was characteri~edby
12
Piedmont Areas and spreading each week to three-fourths an inch or less in
eastern portions of the state. The precipitation for the Mountain Area
was in excess of the departure from normal but still less than normal in
the Coastal Plain Areas. Temperatures averaged much above normal during
the period with high readings of 60's and 70's common during the latter
week of January.
February 197L~: Unseasonably warm weather was experienced during this
month with very little snow reported in the Mountains and only traces or
none at allover the rest of the state. Moderate to heavy rainfal~ was
reported in many sections and in between some of the short storms, pleasant
weather prevailed with mild afternoon temperatures. The month ended with
unseasonably warm conditions.
March 1974: Temperatures averaged above norn1al with record setting
warm temperatures over many sections of the state. During the latter
part of the month the Piedmont temperatures ranged around 80 on the 24th of
March.
April 1974: Temperatures in April were slightly above the normal in
the southeastern part of the state and again warm temperatures prevailed with
high readings in the upper 70's to 80's.
Mal
1974: Temperatures averaged one to two degrees above normal withwide spread precipitation across the state. Most reporting points showed
above average precipitation with Rocky Mount showing 3.6 inches departure
from normal since the March 1 date. Open weather during the latter part of
May was ideal for early harvest of small grain.
1973-74 General: The 1973-74 Small Grain Season was characterized by
months of January and February. This resulted in low vernalization of some
of the wheat varieties. The warm winter weather resulted in a large amount of
{~
insect population and some diseases on the small grain crops. The dry
fall of 1973 may have resulted in a lowering of the mildew infestation for
14
RESULTS AND DISCUSSION
The performance of the 1974 tests along with the previous four years
are presented by crop and area in a tabular form in this report. Since the
genetic expression of a variety is influenced greatly by the environment,
it is best to have several years' data from which to draw conclusions.
For example, if a variety appeared in the two-year average but not in the
three-years average, then it must be compared only within the two years and
not with the data in the three-year average since it is possible that the
third year could have been extremely good or poor and not comparable.
The 1974 data presented in this report have been analyzed statistically
and the least significant difference (L.S.D.), in terms of bushels per acre
is given. Unless the difference between two varieties is greater than the
L.S.D., the varieties should not be considered as being any different
statistically.
Barley
Table 5 shows the performance of barley in the Piedmont. The yields
varied from a high of 88.6 bushels per acre for Keowee to 46.1 bushels for the
variety, Rapidan. The mean of the test for the 1973-74 season was 69.8 bushels
per acre compared to 62.7 bushels per acre in 1972-730 The yield of all
entries was approximately seven bushels higher than the previous year and
the mean of the test was 7.1 bushels higher than last year.
The test weights of 48.6 for Barsoy and 47.8 for Keowee were the highest
test weights in pounds per bushel of all entries. Keowee continued to be
the highest five year average of four entries common to the test for this
period of time. The yield and test weight data for barley performance in
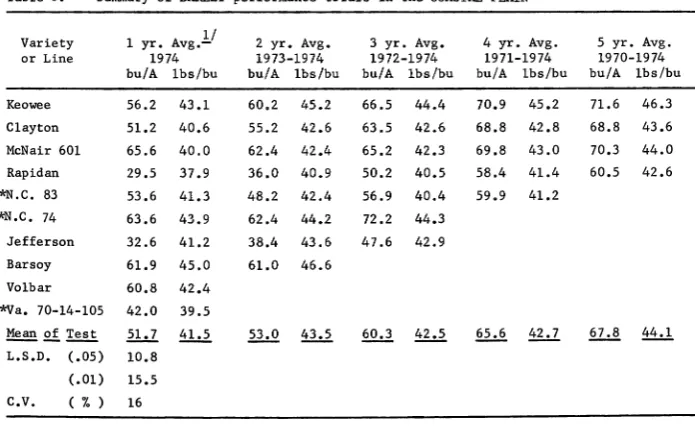
In the Coastal Plain Area, Table 6, shows the difference in yield
between varieties and breeding lines. The mean of the test in bushels per
acre was 51.7 for the average of two locations in the Coastal Plain. The
highest yield was from the variety, McNair 601, at 65.6 bushels per acre.
The test weight in pounds per bushel on the ten entries varied from 37.9
to 45.0 with a mean of 41.5. The mean test weight for 1973-74 season was
3.8 pounds less than last season's test weights. Barsoy showed the highest
test weight at 45.0 with Rapidan recording the lowest at 37.9.
Oats
The data from the oat trials in North Carolina are recorded in Tables
7 and 8.
The mean of the test in the Piedmont was 89.0 with one entry averaging
over 100 bushels per acre. The average test weight was 34.2 for the Piedmont.
The highest yield was 10809 for the experimental, NC 43. The best test
weight was 36.7 for Roanoke and the lowest test weight of 30.2 for
Cumberland.
In the Coastal Plain the mean of the test was 92.7 for two locations.
The mean test weight was 32.8 pounds per bushel. NC 43 was highest in yield
at 114.5 bushels per acre with Coker 227 next at 108.1. Test weight on these
entries was 34.4 and 34.1 pounds per bushel respectively. The mean of the
test in yield increased 13.3 over the 1973 season.
Wheat
Table 9 shows the data on wheat trials in the Piedmont. The mean of the
test for the 1974 season was 51.5 compared to 44.3 bushels per acre for 1973.
The mean test weight in pounds per bushel for 1974 was 58.6 compared with
16
acre followed closely by Arthur 71 at 58.1 bushels per acre. The highest
test weight was on Coker 68-15 at 62.3 pounds per bushel. In the three
year average McNair 4823 was high with 53.5 bushels per acre.
The wheat yields in the Coastal Plain Area were an improvement over
last year. the mean of the test increased from 38.1 bushels per acre as
the mean for 1973 compared to 43.4 bushels per acre for 1974 mean. This
was a 5.3 bushel per acre increase.
For the three-year average, the experimental N.C. 9 and McNair 701
were the highest yielding entries at 39.0.
Lodging
Lodging data are given in Table 11. A one-year, two-year, three-year
and four-year comparison is shown. In 1974 a total of five locations was
used for lodging data on barley, oats and wheat. If no lodging was recorded
at a specific location, data on this location was used for the average along
with percent lodging from other locations. When a test was discarded no
Mildew rust Scald Lodging Winter Test Length
Variety resist- resist- resist- resist- hardi- Matur-ity Weight of
ance ance ance ance ness lb/bu awns
Barsoy Good Poor Fair Fair Good Very Early High Long
Clayton Good Excellent Fair Poor Good Early Med. Short
Jefferson Good Fair Good Good Excellent Earl y Med. Short
Keowee Good Poor Fair Poor Good Early High Long
McNair 601 Good Fair Fair Good Good Earl y Med. Short
Rapidan Good Good Fair Fair Good Early Med. Short
Volbar Fair Fair Good Good Good Medium High Long
Table 3. Characteristics of oat varieties* ...
'-J
Crown
rust Smut Blight Mosaic Winter Lodging Height Test
Variety resist- resist- resist- resist- Maturity Hardi- resist- of Weight
ance ance ance ance ness ance Straw lb/bu
Caro lee;'n'<, Fair Good Good Fair Med. Good Good Med. Med.
Coker 66-22 Fair Good Good Good Med. Good Fair Med. Med. -High
Coker 227 Excellent Good Good Good Hed ,-Early Good Good Med. Med.
Cumberland Fair Good Good Good Med. Good Good Med. Low
Roanoke Fair Poor Good Good Late Good Fair Tall High
Windsor Fair Good Excellent Good Med. Good Good Med. Med. -High
Yancey Fair Good Good Fair Med. Good Good Short Med.
~~hese characteristics based upon all available observations.
Table 4. Characteristics of wheat varieties*
Leaf Soft
rust Mildew Mosaic Winter Lodging Height Test Wheat
Variety resist- resist- resist- Maturity Hardi- resist- of Weight Milling
ance ance ance ness ance Straw Ib/bu Quality
Abe Good Good Good Med. Excellent Good Med. High Good
Arthur 71 Good Good Good Med. Excellent Good Semi-dwarf High Good
Blueboy I I Good Poor Good Med. Excellent Excellent Semi-dwarf Low Good
McNair l8l3~'(~\- Good Good Good Med. Good Good Semi-dwarf High Good
Coker 68-15 Good Poor Good Med. Good Excellent Semi-dwarf High Good
Holley Good Good Good Early Poor Good Med. High Fair
t--'
00
McNair 4823 Good Good Good Late Excellent Excellent Semi-dwarf High Good
McNair 1587 Good Good Fair Med. Good Excellent Med. High Good
McNair 70l~h'( Good Good Good Hed , Early Good Good Semi-dwarf Med. Good
Oasis Good Good Good Med. Excellent Excellent Med. High Good
~~hese characteristics based upon all available observations.
Table 5. Summary of BARLEY performance trials in the PIEDMONT
Variety 1 yr. Avg.!1 2 yr. Avg. 3 yr. Avg. 4 yr. Avg. 5 yr. Avg. or Line 1974 1973-1974 1972-1974 1971-1974 1970-1974
bu/A 1bs/bu bu/A 1bs/bu bu/A 1bs/bu bu/A 1bs/bu bu/A 1bs /bu Clayton 74.2 45.1 71.2 43.4 66.4 42.5 68.6 42.8 72.0 43.3 McNair 601 51.4 43.6 45.1 430 0 45.5 42.1 52.4 42.4 59.2 42.9
Keowee 88.6 47.8 80.8 46.3 78.6 44.9 80.2 45.7 83.7 46.2 Rapidan 46.1 42.6 49.5 42.0 54.2 41.2 62.8 41.6 70.5 420 4
*'N.C. 83 61.7 44.6 65.2 42.4 64.2 40.6 70.4 41.4 *N.C. 74 78.0 46.8 60.6 45.0 73.6 44.6
Jefferson 69.5 45.3 64.8 43.8 62.7 42.3 Barsoy 77.8 48.6 71.5 47.2
Vo1bar 75.7 46.1 *Va. °70-14-105 74.5 43.8
Mean of Test 69.8 45.4 63.6 44.1 63.6 42.6 66.9 42.8 71.4 43.7 L.S.D. (.05) 16.8
(.01) 23.1 C.V. ( % ) 13
!.!Average of Rowan, Stanly and Alamance County Locations.
Table 6. Summary of BARLEY performance trials in the COASTAL PLAIN
Variety 1 yr. AVg.!1 2 yr. Avg. 3 yr. Avg. 4 yr. Avg. 5 yr. Avg. or Line 1974 1973-1974 1972-1974 1971-1974 1970-1974
bu/A 1bs/bu bu/A 1bs/bu bu/A 1bs/bu bu/A 1bs/bu bu/A 1bs/bu Keowee 56.2 43.1 600 2 45.2 66.5 44.4 70.9 45.2 71.6 46.3
Clayton 51.2 40.6 55.2 42.6 63.5 42.6 68.8 42.8 68.8 43.6 McNair 601 65.6 40.0 62.4 42.4 65.2 42.3 69.8 43.0 70.3 44.0 Rapidan 29.5 37.9 36.0 40.9 50.2 40.5 58.4 41.4 60.5 42.6 *N.C. 83 53.6 41.3 48.2 42.4 56.9 40.4 59.9 41.2
*N.C. 74 63.6 43.9 62.4 44.2 72.2 44.3 Jefferson 32.6 41.2 38.4 43.6 47.6 42.9 Barsoy 61.9 45.0 61.0 46.6
Vo1bar 60.8 42.4 *Va. 70-14-105 42.0 39.5
~2i~ 51.7
ll.:2.
53.0 43.5 60.3 42.5 65.6 42.7 67.8 44.1L.S.D. (.05) 10.8 (.01) 15.5 C.V. ( % ) 16
Table 7.
20
Summary of OAT performance trials in the PIEDMONT
Variety 1 yr. AVg.
1/
2 yr. Avg. 3 yr. Avg. 4 yr. Avg. 5 yr. Avg. or Line 1974 1973-1974 1972-1974 1971-1974 1970-1974bu/A 1bs/bu bu/A 1bs/bu bu/A 1bs/bu bu/A 1bs/bu bu/A 1bs/bu Caro1ee 92.6 32.4 88.6 31.9 92.0 32.5 96.9 33.2 94.8 33.1 Roanoke 64.8 36.7 59.7 35.2 66.8 34.7 73.7 35.8 73.0 35.4 Yancey 83.2 34.1 87.8 33.2 94.2 33.6 100.7 34.4 98.3 34.2 Windsor 94.0 35.0 88.8 33.9 101.2 34.3 110.7 35.5 109.0 35.1 Coker 66-22 89.1 34.3 84.5 33.8 84.4 34.0 93.6 35.0 94.9 34.8 *N.C. 43 108.9 35.4 110.6 34.2
Cumberland 80.4 30.2 Coker 227 98.7 35.2
Mean~Test 89.0 34.2 86.7 33.6 87.7 33.8 95.1 34.8 94.0 34.5 L.S.D. (.05) 17.6
(.01) 24.4
C.V. ( % ) 12
l/Average of Rowan, Stanly and Alamance County Locations.
Table 8. Summary of OAT performance trials in the COASTAL PLAIN
Variety 1 yr. Avg.
11
2 yr. Avg. 3 yr. Avg. 4 yr. Avg. 5 yr. Avg. or Line 1974 1973-1974 1972-1974 1971-1974 1970-1974bu/A 1bs/bu bu/A 1bs/bu bu/A 1bs/bu bu/A 1bs/bu bu/A 1bs/bu Caro1ee 100.8 31.1 96.7 32.6 90.7 32.0 96.2 32.0 95.6 33.2 Roanoke 68.2 33.6 64.0 34.1 69.9 32.9 73.0 32.9 73.4 34.2 Yancey 79.3 33.4 69.1 33.8 65.9 32.1 68.2 32.4 71.2 33.6 Windsor 102.8 34.0 92.0 34.4 85.4 32.9 92.7 33.0 93.7 34.2 *N.C. 43 114.5 34.4 97.6 35.4
Coker 66-22 89.5 33.0 Cumberland 83.5 28.8 Coker 227 108.1 3401 *NoC o 1373-1 104.1 33.6 *N.C. 1373-2 76.6 3107
Mean of ~ 92.7 32.8 83.9 34.1 78.0 32.5 82.5 32.6 83.5 33..8 L.SoD. (.05) 17.9
(.01) 25.7
C.V. ( % ) 12
Table 9. Sununary 0f WHEAT performance trials in the PIEDMONT
Variety 1 yr. AVg.!/ 2 yr. Avg. 3 yr. Avg. 4 yr. Avg. 5 yr. Avg.
or Line 1974 1973-1974 1972-1974 1971-1974 1970-1974
bu/A 1bs/bu bu/A 1bs/bu bu/A 1bs/bu bu/A 1bs/bu bu/A 1bs/bu
McNair 1587 55.3 59.1 52.0 56.0 51.3 55.9 54.2 55.5 60.0 55.7
Coker 68-15 52.7 62.3 45.4 58.8 45.2 58.6 48.3 5805 54.4 58.7
McNair 4823 51.2 5704 54.2 55.5 53.5 56.2 55.1 56.6 60.7 57.1
B1ueboy II 49.0 56.7 40.9 53.4 37.0 53.0 42.4 53.4
*N.C. 9 44.9 55.8 41.8 53.4 40.7 53.3
Arthur 71 58.1 60.9 55.5 58.0
Abe 61.8 60.5 59.4 57.8
Oasis 57.9 61.0
Holley 43.7 60.2
*Va. 68-24-42 46.2 55.9
*Va. 70-52-22 56.7 56.4
McNair 701 40.1 57.6
~of Test 51.5 58.6 49.9 56.1 45.5 55.4 50.0 56.0 58.4 57.2
L.S.D. ( .05) 13.0
(.01) 17.7
C.V. ( % ) 12
l/Average of Stanly, Rowan and Alamance County Locations.
Table 10. Sununary of WHEAT performance trials in the COASTAL PLAIN
Variety 1 yr. Avg.1.l 2 yr. Avg. 3 yr. Avg. 4 yr. Avg. 5 yr. Avg.
or Line 1974 1973-1974 1972-1974 1971-1974 1970-1974
bu/A 1bs/bu bu/A 1bs/bu bu/A 1bs/bu bu/A 1bs/bu bu/A 1bs/bu
Coker 68-15 41.5 59.8 38.9 61.0 33.8 58.0 38.6 57.1 39.9 58.4
McNair 701 43.5 55.8 43.2 56.1 39.0 53.6 44.1 54.1
McNair 1813 37.7 57.1 39.0 57.6 36.3 55.0 41.7 54.9
B1ueboy II 28.4 53.5 28.0 54.6 24.5 52.6
*N.C. 9 44.3 56.4 46.2 57.0 39.0 53.2
Arthur 71 43.0 59.2 40.8 60.0
Abe 49.4 58.5 47.2 59.6
McNair 1587 45.3 57.0
Oasis 48.1 59.5
Holley 42.7 57.6
*Va. 68-24-42 55.0 55.1
*Va. 70-52-22 41.8 55.2
~2i~ 43.4 57.1 40.5 58.0 34.5 54.5 41.5 55.4
L.S.D. (.05) 9.0
(.01) 12.6
C.V. ( % ) 13 1/
22
Table 11.
Lodging Data
Variety
or Line
1 yr. Avg.
2 yr. Avg.
3 yr. Avg.
4 yr. Avg.
BARLEY
1974
1973-1974
1972-1974
1971-1974
McNair 601
27
22
30
28
Clayton
24
30
44
38
Keowee
23
29
44
37
Rapidan
40
31
44
37
i"'N.C. 83
13
24
35
28
Jefferson
3
10
17
Barsoy
11
18
Vo1bar
32
-kVa. 70-14-105
6
OATS
1974
1973-1974
1972-1974
1971-1974
Caro1ee
60
42
55
41
Roanoke
51
52
50
38
Yancey
43
32
42
31
Windsor
30
24
41
31
Coker 66-22
71
48
Cumberland
46
Coker 227
40
;'i"N.C. 1373-1
25
i'~'N.C
• 1373-2
14
~