INVESTIGATION
Estimating the Strength of Selective Sweeps
from Deep Population Diversity Data
Philipp W. Messer* and Richard A. Neher†,1 *Department of Biology, Stanford University, Stanford, California 94305 and†Max-Planck-Institute for Developmental Biology, 72076 Tübingen, Germany
ABSTRACTSelective sweeps are typically associated with a local reduction of genetic diversity around the adaptive site. However, selective sweeps can also quickly carry neutral mutations to observable population frequencies if they arise early in a sweep and hitchhike with the adaptive allele. We show that the interplay between mutation and exponential amplification through hitchhiking results in a characteristic frequency spectrum of the resulting novel haplotype variation that depends only on the ratio of the mutation rate and the selection coefficient of the sweep. On the basis of this result, we develop an estimator for the selection coefficient driving a sweep. Since this estimator utilizes the novel variation arising from mutations during a sweep, it does not rely on preexisting variation and can also be applied to loci that lack recombination. Compared with standard approaches that infer selection coefficients from the size of dips in genetic diversity around the adaptive site, our estimator requires much shorter sequences but sampled at high population depth to capture low-frequency variants; given such data, it consistently outperforms standard approaches. We investigate analytically and numerically how the accuracy of our estimator is affected by the decay of the sweep pattern over time as a consequence of random genetic drift and discuss potential effects of recombination, soft sweeps, and demography. As an example for its use, we apply our estimator to deep sequencing data from human immunodeficiency virus populations.
T
HE frequency and strength of positive selection are key parameters of the evolutionary process, yet reliable esti-mates are often very difficult to obtain (Nielsenet al.2005; Eyre-Walker 2006). As it becomes increasingly practicable to analyze the genetic diversity of natural and experimental populations at high depth, we can hope to obtain better estimates from a detailed analysis of the signatures positive selection is expected to leave in such data.The standard model describing the population genetic signatures of positive selection is the so-called selective sweep (Maynard Smith and Haigh 1974). Selective sweeps produce distinct effects on the patterns of genetic diversity in the vicinity of the adaptive site: (i) Hitchhiking of linked neutral polymorphism with the adaptive allele generates dips in diversity that level off with increasing genetic dis-tance from the selected site (Maynard Smith and Haigh 1974); (ii) because different lineages from a population
sample taken after the sweep can coalesce almost instanta-neously during the early phase of the sweep, there should be an excess of singletons in the neutral diversity around the selected site (Slatkin and Hudson 1991; Barton 1998; Durrett and Schweinsberg 2004); (iii) derived alleles can be brought to high frequencies (Fay and Wu 2000), which is unlikely under random genetic drift alone; and (iv) the adaptive haplotype should be longer than expected under neutrality since recombination has had only a short time to degrade it (Hudsonet al.1994). These hallmark signatures underlie the majority of approaches to scan for recent adaptation in pop-ulation genetic data (Hudsonet al.1987; Tajima 1989; Wiehe and Stephan 1993; Fay and Wu 2000; Kim and Stephan 2002; Sabeti et al. 2002, 2007; Przeworski 2003; Nielsen
et al.2005; Voightet al.2006; Andolfatto 2007).
In addition to detecting selective sweeps, one often wants to know the strength of selection that drove the sweep (Macpherson et al. 2007; Hernandez et al. 2011; Sattath
et al. 2011). One common approach is to infer selection coefficientssof the adaptive allele from the size of the dip of approximate lengths/raround the adaptive site, wherer
is the rate of recombination per length in the corresponding region (Maynard Smith and Haigh 1974; Kaplanet al.1989; Kim and Stephan 2002). Approaches based on this signature Copyright © 2012 by the Genetics Society of America
doi: 10.1534/genetics.112.138461
Manuscript received January 7, 2012; accepted for publication March 25, 2012 Available freely online through the author-supported open access option. Supporting information is available online at http://www.genetics.org/content/ suppl/2012/04/04/genetics.112.138461.DC1
rely on the interplay between recombination and ancestral variation and are thus not applicable for scenarios where recombination or ancestral variation is poorly characterized. Furthermore, certain scenarios of adaptation do not always generate clear dips in diversity. Examples are incomplete sweeps, where the adaptive mutation is not fixed in the population, and soft sweeps, where more than one haplotype has swept through the population (Pritchardet al.2010).
Here, we develop an estimator for selection coefficients at candidate loci where a selective sweep has occurred re-cently. Our estimator is based on the analysis of the novel haplotype variation that arises from neutral mutations on the sweeping adaptive haplotype. These early variants are very different in kind from the variation due to neutral mutations occurring after a sweep, since they have experi-enced an initial phase of exponential amplification. Muta-tions after the sweep will quickly outnumber the few that happened early during the sweep, but they will drift to higher population frequencies comparatively slowly.
The frequency spectrum of the early haplotype variants is determined by the distribution of their seeding times during the sweep, as illustrated in Figure 1. We show analytically that their rank-frequency spectrum (the frequencies ordered by decreasing abundance) decays according to a simple power law, which differs markedly from the approximately exponential decay expected under neutral evolution. This power law is characterized by only a single parameter: the ratio of the rate at which new haplotypes arise and the selection coefficientsof the sweep.
We use this result to develop an estimator ofsthat com-pares the strength of selection to the rate at which novel haplotypes are produced. Novel haplotypes can be produced by mutation or recombination. In many organisms, recom-bination is rare and the mutation rate is larger than or sim-ilar to the recombination rate (Haag-Liautard et al.2007; Ossowskiet al.2010; Roachet al.2010). Hence our estimate is much less sensitive to poorly characterized recombination rates, thereby overcoming several problems of estimators based on dips in diversity. In particular, our estimator should also be applicable to organisms that exchange genomic seg-ments via horizontal transfer (many bacteria) and popula-tions where levels of ancestral variation are very low, for instance in experimental evolution with clonal populations. Our estimator relies on deep diversity data for accurate measurements of the population frequencies of rare haplo-types. With large-scale sequencing projects such as the 1000 genomes project in humans (1000 Genomes Project Consor-tium 2010) and similar projects inflies (Drosophila Popula-tion Genomics Project 2011) and plants (Cao et al. 2011) currently under way, such data will become available soon.
Materials and Methods
Forward simulations of selective sweeps
Simulations were performed with custom-written C++ programs that represent each haplotype in the population
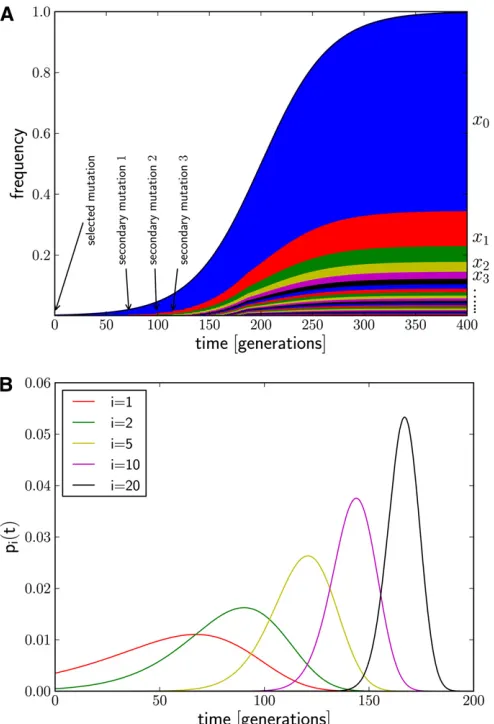
by a bit string of fixed lengthL= 1024 orL= 4096. Pop-ulations are initialized with a sample of size 104individuals obtained from the neutral coalescent, using the program ms (Hudson 2002). Note that this initial variation is needed only to allow diversification by recombination. We con-strained ms to return a sample with 1023 (or 4095, respec-tively) segregating sites, leaving the site in the center of the locus for the beneficial mutation. Each genotype sampled from the coalescent is copied N0/104times into the initial population. The beneficial mutation is introduced into one randomly chosen individual in generation 0. If the beneficial mutation is lost due to random drift, the population is reset to the neutral sample and the beneficial mutation is intro-duced again until a successful sweep is observed. Note that our initial condition with each site polymorphic is not Figure 1 (A) Generation of novel haplotype diversity from secondary mutations during a selective sweep. Att= 0 a beneficial mutation estab-lishes and the frequency,x0, of its underlying haplotype (blue) rises. After
some time, a neutral mutation occurs in an individual carrying the ben-eficial mutation, creating a new adaptive haplotype variant (red) that itself increases in frequency,x1. This happens repeatedly, giving rise to a range
supposed to imply that the product of the population size and the per site mutation rate is much larger than one. In-stead, those loci correspond to the subset of polymorphic loci scattered along a genomic region. The results do not depend on the number of segregating sites in the initial sample, as long as the pairwise difference between two ran-domly chosen genomes is almost always much larger than one. We repeated the simulations using only 1/10th of the segregating sites and obtained similar results (see support-ing information,File S1).
The Malthusianfitness of a haplotype is given byF=sor 0, depending on whether the haplotype carries the benefi-cial allele at position L/2. In each generation, a pool of gametes is produced to which each individual contributes a Poisson-distributed number of copies with mean exp(F2 hFi+C), whereC= (12N/N0) serves as a carrying capac-ity to keep the population size approximately constant atN0 andhFiis the meanfitness in the population. A fractionrof the newly produced gametes are paired at random and crossed over at a randomly chosen position (since r 1, there is no crossover in most gametes). At theL21 neutral loci, mutations are introduced at random positions into the gametes with the specified mutation rateu. When simulat-ing the sweeps of different strength, the mutation rate is changed accordingly to keep the ratio of the strength of selection and the total mutation rate in the range specified in Figures 2–4. This is akin to changing the size of the locus simulated and allows more efficient simulations. The code is available on request.
To compare our method to previously developed meth-ods to estimate selection coefficients (Nielsenet al.2005), we generated data using the program msms by Ewing and Hermisson (2010); seeFile S1.
Analysis of HIV data
Sequences from the relevant samples were read by a python script and translated. Sequences corresponding to identical amino acid sequences were grouped together. Within each of these groups, the numbers of transitions and trans-versions that do not change the amino acid sequence were determined. In the case that the sequence overlapped with the end of the gene and extended into the long terminal repeat (LTR), only the amino acid sequence up to the stop codon was used to group sequences and mutations in the LTR were treated as neutral mutations. Sequences from the study on early immune system escape mutations by Fischer
et al.(2010) are available from the NCBI short read archive under accession no. SRA020793. Sequences from the study on drug resistance evolution by Hedskoget al.(2010) were obtained from the authors.
Results
Haplotype frequency spectrum of a selective sweep
Consider a new adaptive mutation with selection coefficient
s.0 in a panmictic haploid population of constant sizeN.
We assume that selection is strong (Ns1). Once an adap-tive mutation becomes established in the population by reaching a population frequency x (2Ns)21 that ensures its escape from future stochastic loss (Maynard Smith 1971), its frequency trajectory can be modeled by logistic growth
xðtÞ ¼ est
estþ2Ns: (1)
Let us first assume that recombination is infrequent compared to mutation (we discuss recombination below). If neutral mutations occur during the early phase of the sweep on the adaptive haplotype, they can generate new variants of the adaptive haplotype that can also rise in frequency (Figure 1A). We adopt an infinite haplotypes model where every such mutation creates a distinct haplotype. When the fre-quencyx(t) of the beneficial allele is still small, novel
adap-tive haplotypes become established in the population at an approximate rate a(t) = 2s·uNx(t), whereuis the rate at which neutral mutations occur on the sweeping haplotype per generation. The factor 2saccounts for the establishment probability of those new haplotypes. After the sweep is com-pleted, a novel haplotype variant will be the more frequent the earlier it arose in the sweep. Thus, to understand the spectrum of haplotype frequencies, we have to study the distribution of times at which these haplotypes are seeded.
Since novel haplotypes are seeded in independent events, the total number of established new haplotypes up to timet
is Poisson distributed with parameter
lðtÞ ¼
Z t
0 aðt9Þ
dt9 u s e
st: (2)
The approximation assumes that the relevant haplotypes are seeded while the sweeping allele is still rare and increases exponentially, which is appropriate as long astlog(Ns)/s, and thatsu, which can be ensured by reducing the size of the locus under investigation.
The probability density that haplotypeiis seeded at timet
is given by the ratea(t) of establishing new haplotypes mul-tiplied by the probability of havingi21 haplotypes at timet,
piðtÞ ¼aðtÞ
e2lðtÞlðtÞi21
ði21Þ! }e
2ðu=sÞestþist
; (3)
where we have used the same approximations as in Equation 2 and dropped factors independent oftthat ensure normalization. This distribution pi(t) is shown in Figure 1B
for different i. The intervals between the peaks ofpi(t) and
pi+1(t) become smaller with increasingi, while the width of each peak decreases. More precisely, we derive from Equa-tion 3 that the most likely seeding time of theith haplotype is given by
t*i ¼ 1
slog
is u
and that the peak ofpi(t) has a width ofsi ðs
ffiffi
i p
Þ21 (ifi
1). The joint distribution of seeding times and the unordered frequency spectrum are derived inFile S1, section 2.
Assuming that theith haplotype establishes att*
i and has
same fitness as the founding haplotype, it will also rise in frequency, albeit with a time lagt*
i. Together with Equation
(4) we obtain an approximation for the expected frequency of theith haplotype:
xiðtÞ ¼
eðs2uÞ ðt2t*iÞ
estþ2Ns /e2 utu
is
12u=s
: (5)
The limit corresponds to the asymptotic behavior as the beneficial allele approachesfixation. Note that this expres-sion holds for haplotypesi$1. The zeroth haplotype,i.e., the haplotype the mutation inititally arose on, grows asx0(t) = (e(s2u)t)/(est+ 2Ns) and asymptotes toe2ut. Each of the
haplotype variants carrying the adaptive allele thus grows at a slightly smaller rate,s2u, than the overall ratesat which the adaptive allele arises, accounting for the founding of new haplotype variants by mutation.
The interplay between the exponential amplification of the adaptive allele and the generation of new adaptive haplotype variants thus gives rise to a simple power-law decay of the rank-frequency spectrum {x0,x1,. . .} of adap-tive haplotypes: The most abundant adapadap-tive haplotype, on average, is typically s/utimes more frequent than the sec-ond most abundant adaptive haplotype, 2s/u times more frequent than the third most abundant adaptive haplotype, and so forth. This power-law spectrum with exponent b = 12u/sdiffers markedly from that of neutral evolu-tion, where haplotype frequencies are expected to decay as
xi/x0}exp[2i/(2Nu)] with haplotype ranki(seeFile S1, section 1).
The distribution of haplotype frequencies after a sweep is related to the distribution of“family sizes”studied by Barton (1998). Barton presented numeric results for the distribu-tion of the size of groups of individuals that share a common ancestor at the beginning of the sweep. Haplotype frequen-cies, however, refer to the size of groups identical by state, rather than by descent, and characterize diversification that happened after the sweep, rather than the ancestral varia-tion that survived the sweep.
To compare the haplotype counts n0 . n1 . n2 . . . in a sample of size nto Equation 5, we need an estimate of
e2ut. The simplest estimate ofe2utis the sample frequency
of the most abundant haplotype,n0/n, whose deterministic value would be precisely e2ut. However, n
0 can be quite variable because the variances of thefirst few seeding times are still large. To circumvent this problem, one can con-struct a more stable estimate of e2ut on the basis of the
firstk haplotypes and compare the sum of the sample fre-quencies to the sum of the deterministic expectation of the frequencies,
^
n0¼ Pk
i¼0ni
1þPk i¼1ðu= siÞ
b; (6)
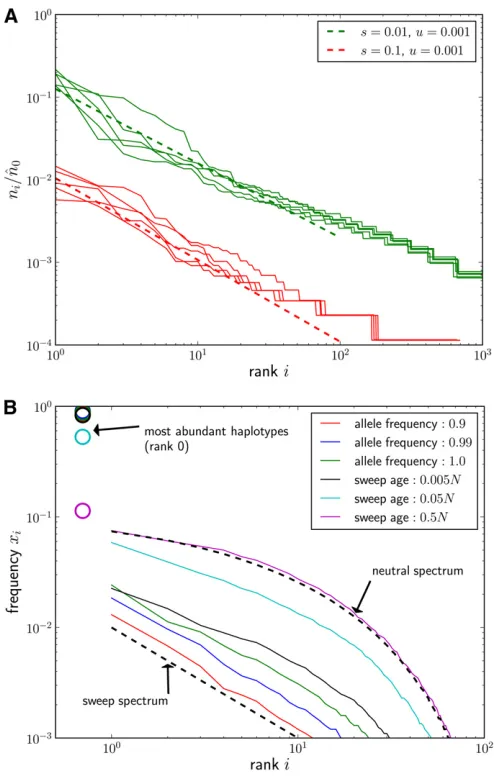
where b= 12u/s. This effective^n0 is insensitive tokas long as the first few haplotypes are included. Figure 2A shows a comparison of the simulated haplotype spectra with
ni ^ n0 u is b : (7)
The logarithmic axes of the plot are chosen such that the algebraic decay shows up as a slope2b. The observed slope is correct initially, but the curves become slightlyflatter after haplotype rank 50. This is due to degradation of the sweep pattern by random genetic drift, which we discuss next.
In deriving Equation 7, we have neglectedfluctuations in the seeding and establishment times of novel haplotype variants as well as genetic drift after the sweep is complete. Relaxing these assumptions requires a stochastic calculation, which is given inFile S1, sections 3A and 3B. Specifically, we
calculate the probability offindingichaplotypes to be pres-ent in more than nccopies in the population, assuming the logistic trajectory of the beneficial allele given in Equation 1. These calculations are lengthy, but the resulting effects can be understood by the simple arguments given below.
Variations in the establishment times will cause the haplotype spectra to fluctuate and result in spectra below or above Equation 7 if new haplotypes were seeded fortuitously early or late. As expected from the distribution of seeding times in Figure 1, the frequencies of thefirst few haplotypes fluctuate substantially, while the later ones do not. Since the number of haplotypes seeded by time t is Poisson distributed, so is the number of haplotypes above a certain frequency after the sweep is complete (neglecting genetic drift, there is a one-to-one mapping between estab-lishment time and eventual frequency). Hence, the fluctua-tions due to random seeding times are small if the expected number of haplotypes above the chosen frequency is large. In accordance with these arguments, variation of haplotype spectra in Figure 2A decreases with increasingi.
Once the beneficial allele approachesfixation, the strength of selection goes to zero, and exponential amplification ceases. The frequencies of the rare haplotypes thereafter change primarily due to random drift, while the frequencies of the common haplotypes decrease due to additional mutations that produce new rare haplotypes. Both of these processes lead to a homogenization of haplotype frequencies,i.e., common hap-lotypes becoming rarer and rare haphap-lotypes becoming more common, which ultimately wipes out the sweep signature. This relaxation to the neutral haplotype spectrum is shown in Figure 2B.
hici u
s
e2ut ðxc2Dt=NÞ
1þu=s
; (8)
where Dtis the age of haplotype ic, which is of the same order as the age t of the sweep. Note that Equation 8 is essentially Equation 5 solved for iwith the“drift
contribu-tion”Dt/Nsubtracted from the frequencyxc. Since the age
Dtof the haplotype is similar to that of the beneficial allele, t, we conclude that for frequencies less thant/N, the sweep spectrum is eroded, while for frequencies much larger than
t/N, it prevails. After a time of orderN, the entire spectrum has relaxed to the neutral haplotype frequency spectrum as shown in Figure 2B. Note that the time it takes for the beneficial allele to go from frequency 0.9 to complete fixa-tion can be long, and substantial erosion of the sweep spec-trum can happen during this time interval.
In general, the time that has elapsed since the beginning of the sweep is unknown. To obtain an estimate of the age of the sweep, it is useful to reconsider Equation 5, which states that the frequency of the founding haplotype is expected to asymptote toe2ut. This behavior, and in particular the more
accurate estimate ofe2utgiven in Equation 6, allows one to
obtain a rough estimate of the sweep’s age.
In addition to genetic drift, limited sampling of the pop-ulation results in a deviation of the observed from the expected sweep spectra. The detected haplotype counts are a convolu-tion of their true frequencies with the distribuconvolu-tion expected from sampling the population. After ranking of haplotype counts, a large number of rare variants leads to aflattening of the spectrum and in particular an excess of singletons.
Estimating selection strength
According to Equation 7, the expected rank-frequency spec-trum of haplotypes in a selective sweep is determined by the single parameteru/s—the ratio of the mutation rate over the
locus and the strength of selection. Given an independent estimate ofu, one can therefore use the haplotype frequency spectrum to estimate the selection coefficient of a sweep, for example by simply counting the number of different haplo-types present above a specified frequency cutoff in the sam-ple. Leticbe the overall number of different haplotypes that are present in at least nccopies each. The estimator for the strength of selection is then
^
s¼u ic
^
n0
nc
1þncic=^n0
; (9)
wheren^0 is either set to the observedn0or determined via Equation 6.
The estimator^s allows us to either fix ncand then de-termine the counticfrom the data orfixicand then measure nc. In either case, the cutoff should be chosen to achieve maximum accuracy. Since the numbericof haplotypes above a frequency threshold is Poisson distributed,fluctuations of^s
decrease with smaller ncand largeric. Too lowic, however, will include parts of the frequency spectrum that have already been degraded by drift, which predominantly affects the rare haplotypes. In addition, limited sampling depth limits ic. Henceicshould be chosen as large as possible, but such that nc1 and that the frequency spectrum is still of power-law form down to haplotypeic. In this case, the relative error of^s is of order 1= ffiffiffiffiic
p
(assuming the model assumptions are met). Figure 2 (A) Ensembles offive haplotype rank-frequency spectra foru=
0.001 and two selection coefficientss= 0.1 ands= 0.01. Spectra were estimated from samples of sizen= 104taken when the allele frequency
of the beneficial mutation reached 0.99. The deterministic expectations given in Equation 7 are shown as dashed lines. The normalizer^n0was
calculated according to Equation 6 withk= 4. (B) Relaxation of haplotype spectra to the neutral spectrum. Rank-frequency spectra were estimated from samples of sizen= 104when the beneficial allele reached
popula-tion frequencies 0.9, 0.99, and 1.0 and for several time points after completion of the sweep (time in generations) (s= 0.001,u= 1025,L
= 1024, N = 106, Q = 2Nu= 20). Each curve is the median of 50
simulated sweeps. The most common haplotypes (rank 0, not repre-sented on log scale) are indicated by circles. Right after the sweep, the population consists of one very common haplotype,x00.98, and a large
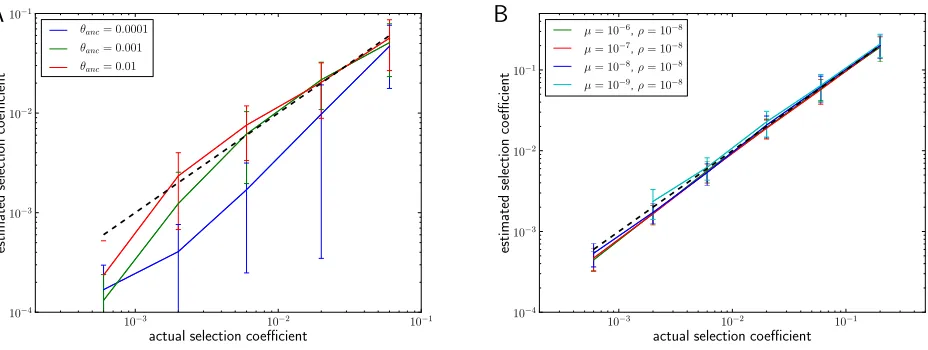
It is generally advisable to fix icand determine nc¼nic because spectra comeflatter thani21due to the confounding effect of genetic drift and limited sampling of the population. Figure 3 shows the performance of our estimator when ap-plied to simulated sweeps (see Materials and Methods) for different selection coefficients and mutation rates as well as its dependence on the choice ofic. The simulations confirm that our estimator performs accurately over the range of mod-erate selection (s1023) to strong selection (s0.2) given the parameters used. However, there is a systematic down-ward bias for small s. This bias is due to genetic drift and limited sampling depth.
InFile S1, section 3, we derive an estimator that accounts for genetic drift perturbatively; see Equation 24 ofFile S1. In essence, this estimator contains the same correction present in Equation 8;i.e., it subtracts the drift contributiont/Nfrom
the frequency of the rare haplotypes. Importantly, this drift correction sets the limits of applicability of^s:
i. After the completion of the sweep, we can estimatesonly for a limited time. Specifically, for a given sample fre-quencync/n, we require thatt,Nnc/n.
ii. The range of s that can be reliably estimated by the method is limited: Even if we catch the sweep right at the time offixation of the adaptive allele, it still needs to have occurred faster than the timescale of its own degra-dation by drift. Given that the time it takes to complete a sweep is(2/s)logNsand thatnc/nu/(sic), we re-quire N.(2ic/u)logNs. Together withs u, we find that the range ofsthat can be estimated is bounded from below byNsiclogNs. This estimate is consistent with the deviations in Figure 3 fors,1023.
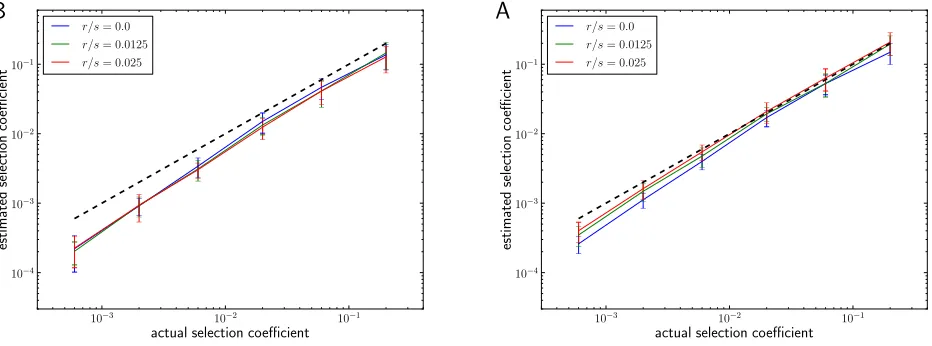
Figure 3 (A) Mean^sover 50 simulation runs for a wide range of selection strengths and three different ratios ofu/s, using Equation 9 withic= 5. Error
bars are61 standard deviation. The dashed black line indicates the corrects. Population samples of sizen= 103were taken when the beneficial allele
reachedfixation. For smalls, there is a slight downward bias due to genetic drift.L= 4096 andN= 106. (B) Distribution of^sat different selection
strengths forfixedu/s= 0.05. (C) Performance of^sas a function ofic. There is a tendency to underestimate the strength of the sweep ificis large, which
Recombination
Up to now, we have neglected any potential effects of recombination on the frequency distribution of the new adaptive haplotype variants arising in a selective sweep. In fact, one of the advantages of our estimator is that it does not exclusively rely on recombination for its inference of selection coefficients and can thus also be applied to systems that lack recombination or where recombination rates are not well known. However, if recombination occurs on the sweeping haplotype, this can generate new variants of the adaptive haplotype in a manner similar to mutation. This becomes important whenever the recombination raterover the locus is comparable to its mutation rateu. In this case, the rate at which new haplotype variants are generated dur-ing the sweep will actually be higher than assumed on the basis of the mutation rate u, and we thus expect^sto un-derestimate the strength of the sweep.
We propose two ways to incorporate recombination: First, one can treat recombination analogously to mutation and assume that every recombination event generates a new variant of the adaptive haplotype that will be different from all other existing variants. Under this assumption, the mutation rateusimply needs to be replaced by the sumu+r. Figure 4A shows how our estimator performs for different ratios of mu-tation to recombination rate under this approach. The infinite haplotypes assumption is appropriate if ancestral diversity is high and independent recombination events are thus un-likely to yield equal outcomes. If, however, ancestral diver-sity is low, the infinite haplotypes model will overestimate the rate at which new haplotypes arise.
Alternatively, we can try to effectively exclude most recombined adaptive haplotype variants. Recombined var-iants are likely to differ from the founding haplotype at more than one site, whereas variants originating from mutation should differ at only one site. Byfiltering out the former, we can treat the remainder as originating primarily from mutation events. As shown inFile S1, section 4, such a set of pruned “mutation-only”haplotypes has a slightly differ-ent rank-frequency spectrum: The expondiffer-entbis exactly 1, rather than 12u/s. Besides that, Equation 9 can be applied withubeing the mutation rate andncbeing the abundance of the ic haplotype in the pruned set of haplotypes. The estimates obtained by this procedure are shown in Figure 4B. While this modified estimator still seems to underesti-mate selection coefficients slightly, it performs consistently across different recombination rates.
The difference in the exponent of the rank-frequency spectrum arises from slightly different rates of seeding and amplification of new haplotypes. Without pruning, the rate of establishment of novel haplotypes is proportional to the frequency of the beneficial allele, which follows a logistic growth with rates. Haplotype frequencies, how-ever, grow only with rate~s¼s2u2r. This slight difference in rates is responsible for the deviation of the exponentb from 1 byu/sor (u+r)/s, where the latter also accounts for
recombination. When restricting the analysis to haplotypes that descend directly from the founding haplotype, the rate of establishment of novel haplotypes is proportional to the frequency of the founding haplotype. Hence, establishment and amplification happen with the same rate~s¼s2u2rand the exponent is exactly 1.
recombination, which has the effect of slowly decreasing their frequency and producing novel low-frequency haplo-types. This slow decrease opposes the effects of genetic drift, which has the tendency to increase the frequency of minor alleles. In simulations, estimates of s often become more accurate due to this effect.
Application of^s to deep sequencing data from human immunodeficiency virus
Deep population diversity data of the kind required for the application of our estimator have recently been obtained for human immunodeficiency virus (HIV) populations by se-quencing viral RNA from plasma samples (Tsibris et al.
2009; Fischeret al.2010; Hedskoget al.2010). We present three examples from such studies to validate our method and discuss its applicability.
As afirst example, we investigated a sample taken shortly after infection when HIV evolution is primarily driven by mutations that allow the virus to escape the immune system. For each of the patients studied in Fischer et al. (2010), samples from several time points were investigated and amplicons sequenced using 454 technology. In one of the epitopes studied (gene nef in patient CH40), a mutation spread sufficiently slowly such that it was possible to ob-serve the mutation rise from low frequency at day 16 to high frequency at day 45 (Figure 5A). From this time series Fischer et al.(2010) estimate a selection coefficient of 0.3,
assuming a generation time of HIV between 1.5 and 2 days (Perelsonet al.1996).
To validate our estimator, we can compare this direct estimate of the selection coefficient obtained from time-course data with that obtained from the frequency spectrum of haplotype diversity at the locus, which is shown in Figure 5B. Figure 5B contains the frequency of haplotypes with the dominant amino acid sequence that differ only by putatively neutral synonymous mutations. The haplotype rank-fre-quency spectrum according to Equation 9 suggests a ratio of u/s 0.014. There is considerable uncertainty in the mutation rate estimates for HIV, ranging from 3.4 · 1025 (Mansky and Temin 1995) to 9·1025per site and gener-ation (O’Neil et al. 2002 for mutations in the LTR). The majority of these mutations are transitions. In our example the sequenced locus tolerates a total of 93 transitions that do not change the amino acid sequence ofNefor fall into the LTR that overlaps the sequenced region. Using 4·1025per generation as an averaged estimate for the transition rate, we arrive at
^s93·4·10 25
0:014
gen-1¼0:27 gen-16 0:12: (10)
The uncertainty stemming from the random times at which the haplotypes are seeded is expected to result in relative errors1= ffiffiffiffiic
p
, which foric= 5 used here amounts to60.12. Additional uncertainty (probably larger) in the mutation rate needs to be added to these error bars. Given these
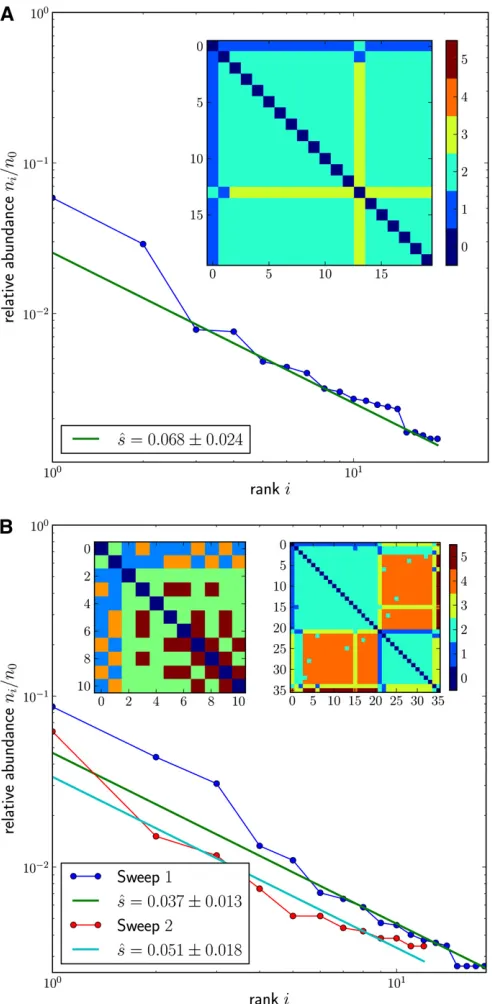
uncertain-ties we consider our estimate to be in excellent agreement with the independent estimate from time-course data. Note that recombination is not expected to make a large contri-bution to haplotype diversification since the effective HIV Figure 5 The rise of a mutation selected by the immune system in the geneNefof patient CH40 from Fischeret al.(2010). (A) Frequency tra-jectory of the adaptive allele with afitted curve fors0.3. (B) Observed haplotype spectrum of variation due to synonymous transitions from all sequences containing the selected allele at day 45. The straight line indi-cates the 1/ibehavior. The pairwise nucleotide distance between all hap-lotypes ordered by abundance is shown in the inset. The error of the estimate is obtained assuming Poisson statistics withic= 5. Note,
recombination rate is less than half the mutation rate (Neher and Leitner 2010; Batorsky et al. 2011). Furthermore, the HIV population has undergone several sweeps prior to the date this sample was taken such that the ancestral diversity was very low.
We also checked whether the haplotype variation in our sample is consistent with the characteristic star phylogeny expected for mutations that arose on the background of the sweeping founder haplotype. In particular, under the as-sumption of an infinite sites model where each such mutation gives rise to a new haplotype, we would expect that descendants should always be one mutation away from the founding haplotype, while any two descendants should be two mutations away from each other. Our example shows precisely this pattern, as can be seen in the inset in Figure 5A. This is further evidence that recombination did not con-tribute substantially to haplotype diversification.
As a second example, we consider deep sequencing data of the reverse transcriptase (RT) locus of HIV (120 bp, amino acids 180–220) (Hedskog et al.2010). The patients analyzed in this study were under antiretroviral treatment, which implies strong selection pressure for resistance muta-tions at the RT locus. During the course of treatment resis-tance has evolved repeatedly in several patients. We therefore expect to see signatures of strong selective sweeps in these viral populations.
As before, we restricted our analysis to synonymous differences because our model assumes selectively neutral mutations. The 120-bp analysis windows typically contained enough variation such that in most samples more than eight different haplotypes were sampled. Hence we choseic= 8 for estimating^sand then measured the cutoff frequency nc of the least abundant haplotype to evaluate Equation 9.
Figure 6A shows the measured haplotype rank-frequency spectrum for one of the patient samples (time point 4, pa-tient 4). The spectrum decays with the characteristic power law of a selective sweep. As discussed above, we determined the number of synonymous transitions in the founding se-quence and used 4·1025as the rate of individual transi-tions. With this mutation rate estimate, we arrive at^s0:07 per generation. Note that the causative mutation, or the combination of mutations, that drove this sweep does not necessarily have to lie inside the analyzed window but could also be located elsewhere in the genome.
Figure 6B shows haplotype data from another population sample (time point 4, patient 5). In this third example, the pairwise mutational distances between different haplotypes reveal a more complex pattern (left inset) that does not seem to be compatible with the simple star phylogeny ob-served in the example from Figure 6A. However, when we focus on the two most abundant haplotypes 0 and 1, we see Figure 6 (A) Exemplary sweep in HIV evolution. The rank-frequency
spec-trum and pairwise distance matrix are shown for the different haplotypes coding for the same amino acid sequence, amino acids 180–220 of the RT (Hedskoget al.2010); compare Figure 5. All but haplotype 13 differ from the most abundant haplotype (0) by one mutation. Haplotype 13 is most likely a descendant of haplotype 1. (B) Example of a soft sweep in HIV evolution. In this sample, the two most abundant haplotypes 0 and 1 differ by more than one mutation (top left corner of left inset, showing the distance matrix of the 10 most abundant haplotypes), suggesting that the selected mutation arose independently on different backgrounds. By inspecting thefirst two columns of the left distance matrix, onefinds that most of the other haplotypes differ by one mutation from either haplo-type 0 or haplohaplo-type 1, consistent with the beneficial mutation having arisen independently on haplotypes 0 and 1. Assigning the rare haplo-types to either of the two abundant“founding”haplotypes and reorder-ing yield the distance matrix shown as the right inset, this time includreorder-ing
all 36 haplotypes. The reordered matrix displays two characteristic sweep patterns as blocks on the diagonal. Indeed, the haplotypes of each of these two blocks display the characteristic power-law rank-frequency spectrum. In both panels,ic= 8 and relative errors are 1=
ffiffiffi ic
that these two haplotypes differ at more than one site from each other. The majority of the remaining haplotypes differ by only one mutation from either haplotype 0 or haplotype 1. This pattern can be interpreted as the result of two in-dependent partial sweeps where the two founding haplo-types (0 and 1) differ at two sites.
We can disentangle these two hard sweeps by assigning the rare haplotypes to either of the two founding haplotypes if they differ from the latter by only one mutation. When reordering the distance matrix according to this assignment, we recover the two individual sweep patterns as blocks on the diagonal. This is shown in the right inset of Figure 6B. Both reordered components now exhibit the characteristic power-law decay in their individual rank-frequency spectra with similar selection coefficients, again in the range of a few percent.
A scenario like the one shown in Figure 6B, with several haplotypes carrying the same adaptive mutation rising in frequency simultaneously, is commonly referred to as a“soft sweep”(Hermisson and Pennings 2005). Soft sweeps can occur, for example, if an adaptive mutation arises repeatedly on different haplotypes, which is expected to be common in viruses with large population sizes and high mutation rates such as HIV, where every single point mutation can arise many times each generation. Alternatively, soft sweeps can result when a sudden change in environment renders a pre-viously neutral or deleterious allele selectively beneficial and adaptation involves several different adaptive haplo-types from the standing genetic variation.
An unambiguous decomposition of the haplotype dis-tance matrix into individual sweep components of a soft sweep requires that the founding haplotypes differ by several mutations. This is likely to be the case for a diverse ancestral population. Note that the above approach also suggests how ^s can be applied to incomplete sweeps or sweeps restricted to a subpopulation. In those cases, the reordered distance matrix should display the characteristic sweep pattern only for a subblock on the diagonal that is embedded into the diverse remainder of the population.
Intriguingly, we see very little evidence of degradation of the haplotype spectrum by genetic drift. This might have several causes: (i) a very large population size, (ii) a very recent sweep, or (iii) a scenario where sweeps are so frequent that they start overlapping such that exponential amplification of the mostfit variants never ceases. The latter is expected in large continuously adapting populations (Neher and Shraiman 2011). To investigate this matter fur-ther, one would need denser time-course data and informa-tion on genetic diversity across the genome.
Discussion
We have investigated the pattern of haplotype variation that arises from mutations occurring during the early phase of a selective sweep on the sweeping haplotype. We found that a selective sweep leaves a characteristic signature in the
frequency spectrum of such novel haplotypes: When order-ing all adaptive haplotype variants by their abundance, the frequency of the ith haplotype variant isu/(is) times the frequency of the first, where u is the mutation rate of the locus andsis the selection coefficient of the sweep.
The power-law decay of the rank-frequency spectrum is a consequence of exponential amplification (via selection) competing with diversification (through mutation and re-combination), similar to the mechanism of preferential at-tachment originally proposed by Yule (1925). We applied this finding to construct an estimator for the selection co-efficient at a candidate locus where a selective sweep is suspected to have occurred recently. Either such loci could be identified by standard approaches to localize sweeps (Fay and Wu 2000; Kim and Stephan 2002; Sabeti et al.2002; Nielsenet al.2005; Voightet al.2006; Sabetiet al.2007) or
a priori information could suggest that a sweep has oc-curred, such as in our HIV examples, where the failure of antiretroviral therapy implied an adaptive change at the RT locus.
The classic signature used to infer the strength of a recent sweep has been the size of the dip in diversity around the adaptive site (Maynard Smith and Haigh 1974). Underlying this approach is the rationale that recombination breaks up linkage with increasing genetic distance from the adaptive site: The farther away it is from the sweeping locus, the higher the probability that presweep variation has become unlinked from the adaptive allele and thus remains poly-morphic after the sweep. Hence, the width of the dip in genetic diversity scales with the ratio of the selection coef-ficient and the recombination rate.
While successfully applied in many studies (Kim and Stephan 2002; Sabeti et al.2002, 2007; Andolfatto 2007; Macphersonet al.2007; Sattathet al.2011), this approach suffers from a number of shortcomings that can limit its applicability. First, it relies on recombination and thus can-not be applied to organisms that frequently self, such as many plants or yeast, as well as to organisms that recombine via horizontal gene transfer, such as bacteria. Recombination rates can also fluctuate strongly along the genome and in time (Winckler et al. 2005; Coop and Przeworski 2007), rendering their precise estimation difficult, especially in the regions of reduced genetic diversity around a selective sweep. Furthermore, the approach relies on the presence of preexisting variation at the sweep locus and assumes that we know how much variation was present originally. Ances-tral diversity is literally absent in evolution experiments where populations start from a single clone or in popula-tions where adaptation occurs so frequently that genetic di-versity is not fully restored between recurrent selective sweeps (Gillespie 1994). Finally, for strong sweeps, the dips in diversity can potentially span very large regions extend-ing up to entire chromosomes (Andersen et al. 2012). In such cases, dip sizes can no longer be assessed accurately.
the new variation that emerges during the sweep and compare selection strength to the rate of haplotype di-versification (mutation and recombination) rather than to the recombination rate alone. It is essential for our estimator that one can accurately determine haplotype population frequencies on the order ofu/(sic), requiring deep popula-tion samples. For example, if we assume a sweep locus with
u/s = 0.1 and base our analysis on thefive most frequent adaptive haplotype variants (ic= 5), it would be necessary to measure haplotype frequencies of 2% accurately. This calls for a sample size of103. Population genetic data of such depth is already available for HIV, where a large num-ber of sequences can be obtained from plasma samples of infected patients (Tsibris et al. 2009; Fischer et al. 2010; Hedskog et al. 2010). Several efforts are currently being made to achieve a comparable in-depth characterization of the population diversity in several eukaryotes, including humans (1000 Genomes Project Consortium 2010), flies (Drosophila Population Genomics Project 2011), and plants (Caoet al.2011).
In practice, one typically has a data set (as in the HIV example a sample of size104sequences of length 120–200 bp) and wants to estimate s. The size of the locus corre-sponds to a certain mutation rate, which will limit the range of selection coefficients that give rise to an observable sweep spectrum: If u/s is too small (say ,10 times the inverse sample size), very little variation will be observed. On the other hand, if u/s is close to one, the founding haplotype diversifies as rapidly as it is amplified and will no longer be the dominant haplotype in the sample. Without a dominant haplotype, the method cannot be applied. Furthermore, our calculations always assume thatus.
Too large values ofu/scan be circumvented by restricting the analysis to only a fraction of the locus, which effectively reduces u. Hence, if a sample contains a large number of rare alleles and haplotypes but no dominant haplotype, one can reduce the window size to see whether a dominant hap-lotype with a trailing sweep spectrum emerges. Similarly, if one analyzes long genomes using a windowing approach and observes a region almost devoid of diversity (corre-sponding to u/s 1), one can increase u by increasing the window size until several low-frequency haplotypes are observed. One can thus tune the sensitivity of the esti-mator to different ranges of s by adjusting u through the length of the locus. A selection coefficient ofs= 1023and a mutation rate of 1028per site, for example, would require a locus of length 10 kb to achieveu/s= 0.1.
We used the popular program sweepfinder (Nielsenet al.
2005) to compare the performance of our estimator to a tra-ditional approach where the selection coefficient of a sweep is inferred from its signature in the surrounding ancestral diversity. As expected, our estimator consistently outper-forms the traditional approach if ancestral diversity is low (Figure 2 inFile S1). Interestingly, even when ancestral di-versity is rather high (e.g.,Q= 0.01, comparable to the level of neutral diversity observed in Drosophila melanogaster),
the estimates from our method still have substantially lower variance than those obtained from sweepfinder. Note, how-ever, that the comparison between the two methods is based on rather different data. While the sweepfinder requires long sequences (r/s 1) at moderate coverage, our meth-ods works with much shorter regions [(u+r)/s ,0.1] at very deep coverage.
For our estimator to be applicable, haplotype variants that were produced after a sweep and rose in frequency by random genetic drift need to be still at low enough frequency such that they have not yet degraded the sweep signature. The extent of this degradation can be estimated from a simple argument: The lowest population frequency entering our estimator is of the order u/(sic), while drift-dominated haplotypes will typically be at frequencies t/N, where t is the time that has elapsed since the sweep. We thus requireu/(sic)t/N, which translates into the condi-tion that populacondi-tion sizes have to be sufficiently large and that sweeps are not too old. As shown in Figure 2, drift results in a growing bulge at low frequencies where the rank spectrum is exponential rather than a power law. Since the strength of genetic drift is very poorly known, we propose to inspect the ranked haplotype spectrum for deviations from the power law and choose icsmall enough such that drift-dominated haplotypes are excluded from the analysis. In addition, one should check whether the sample is compati-ble with a near star phylogeny. Failure to exhibit these fea-tures should indicate either the absence of a selective sweep or a sweep that has already been degraded.
While we have focused on mutation as a source of novel haplotypes, recombination can produce new haplotypes as well. Provided each recombination event results in a unique haplotype, all of the above formulae hold withu+rinstead ofualone. If, however, recombination rates are not known, recombinant haplotypes can befiltered out by restricting the analysis to only those haplotypes that differ by a single mu-tation from the founding haplotype. This removes the ma-jority of recombinant haplotypes since recombination with the diverse ancestral population typically incorporates sev-eral polymorphisms at once.
Recent studies suggest that in many selective sweeps the adaptive allele has not actually becomefixed in the popula-tion (incomplete sweep) or that several different haplotypes, all carrying the adaptive allele, have swept simultaneously through the population (soft sweep) (Hermisson and Pennings 2005; Burkeet al.2010; Karasovet al.2010; Pritchardet al.
2010). We have demonstrated how incomplete sweeps and soft sweeps can be analyzed by our method (Figure 6B), mak-ing use of the fact that the novel haplotype variants our esti-mator is based on are related to the founding haplotype by a simple star phylogeny, which allows us to easily differentiate them from other haplotypes that are not descendants of the founding haplotype.
be affected by past demographic events such as population expansions or bottlenecks. Most current approaches to in-vestigate selective sweeps rely on the specific patterns a sweep leaves in ancestral neutral diversity. These approaches can thus be very sensitive to past demographic events that shape the patterns of ancestral diversity over a timescale of neutral coalescence, which can include quite ancient demographic events. The approach presented here, however, is funda-mentally different. In contrast to ancestral neutral varia-tion, which is typically old, we focus on the very recent variation that arises during the early phase of a selective sweep. Demographic events that occurred prior to the onset of the sweep are thus irrelevant. Only very rapid changes in population size that happen while the adaptive allele is sweeping can cause significant deviations in the haplotype frequency spectra.
The key scenario to be discussed in this context is that of a recent population expansion, since our estimator measures specifically the rate at which new haplotype variants were amplified. Indeed, the haplotype frequency spectrum in an expanding population will resemble that of a selective sweep if the expansion lasted long enough for all coales-cence to happen during the expansion and if the expansion rate e is large enough such that the spectrum has not yet been eroded by drift;i.e.,Ne1. In this case, our estimator turns into an estimator of the expansion rate that might be applicable to scenarios such as the expansion of an HIV population in a newly infected individual or the spread of novel strains of influenza. If, on top of an expansion, a ben-eficial mutation is spreading through the population, the haplotype carrying the beneficial mutation (and its descend-ants) is expanding faster than the ancestral haplotypes. The estimate of the selection coefficient will then in fact be an estimate of s+e.
The spread of a beneficial mutation in the population generally reduces genetic diversity in the vicinity of the adaptive site. That a selective sweep can also amplify new diversity at very low population frequencies is thereby often overlooked. We have shown that the spectrum of this new variation records the exponential amplification of the novel beneficial allele in a clock-like fashion and can thus be used to estimate its selection coefficient. With the recent advan-ces in sequencing technologies, the required information about low-frequency genetic variation is no longer elusive, making our estimator applicable for a wide range of analyses.
Acknowledgments
We thank Dmitri Petrov, Nick Barton, Boris Shraiman, Ben Callahan, Taylor Kessinger, and members of the Petrov laboratory for helpful feedback. This research was supported by the European Research Council under grant no. 260686 (to R.A.N.). P.W.M. was an Human Frontier Science Program postdoctoral fellow in the Petrov laboratory at Stanford University. Part of this work was conducted during the
program “Microbial and Viral Evolution”at Kavli Institute for Theoretical Physics, supported by the National Science Foundation under grant no. PHY05-51164.
Literature Cited
1000 Genomes Project Consortium, 2010 A map of human ge-nome variation from population-scale sequencing. Nature 467: 1061–1073.
Andersen, E. C., J. P. Gerke, J. A. Shapiro, J. R. Crissman, R. Ghosh
et al., 2012 Chromosome-scale selective sweeps shape
Caeno-rhabditis elegans genomic diversity. Nat. Genet. 44: 285. Andolfatto, P., 2007 Hitchhiking effects of recurrent beneficial
amino acid substitutions in the Drosophila melanogaster ge-nome. Genome Res. 17: 1755–1762.
Barton, N., 1998 The effect of hitch-hiking on neutral genealo-gies. Genet. Res. 72: 123–133.
Batorsky, R., M. F. Kearney, S. E. Palmer, F. Maldarelli, I. M. Rouzine
et al., 2011 Estimate of effective recombination rate and aver-age selection coefficient for HIV in chronic infection. Proc. Natl. Acad. Sci. USA 108: 5661–5666.
Burke, M. K., J. P. Dunham, P. Shahrestani, K. R. Thornton, M. R.
Roseet al., 2010 Genome-wide analysis of a long-term
evolu-tion experiment with Drosophila. Nature 467: 587–590. Cao, J., K. Schneeberger, S. Ossowski, T. Günther, S. Benderet al.,
2011 Whole-genome sequencing of multiple Arabidopsis thali-ana populations. Nat. Genet. 43:956–963.
Coop, G., and M. Przeworski, 2007 An evolutionary view of hu-man recombination. Nat. Rev. Genet. 8: 23–34.
Drosophila Population Genomics Project, 2011 Drosophila Popu-lation Genomics Project. Available at www.dpgp.org. Accessed April 2012.
Durrett, R., and J. Schweinsberg, 2004 Approximating selective sweeps. Theor. Popul. Biol. 66: 129–138.
Ewing, G., and J. Hermisson, 2010 Msms: a coalescent simulation program including recombination, demographic structure and selection at a single locus. Bioinformatics 26: 2064–2065. Eyre-Walker, A., 2006 The genomic rate of adaptive evolution.
Trends Ecol. Evol. (Amst) 21: 569–575.
Fay, J. C., and C. I. Wu, 2000 Hitchhiking under positive Darwinian selection. Genetics 155: 1405–1413.
Fischer, W., V. V. Ganusov, E. E. Giorgi, P. T. Hraber, B. F. Keele
et al., 2010 Transmission of single HIV-1 genomes and
dynam-ics of early immune escape revealed by ultra-deep sequencing. PLoS ONE 5: e12303.
Gillespie, J. H., 1994 The Causes of Molecular Evolution. Oxford University Press, Oxford.
Haag-Liautard, C., M. Dorris, X. Maside, S. Macaskill, D. L. Halligan
et al., 2007 Direct estimation of per nucleotide and genomic
deleterious mutation rates in Drosophila. Nature 445: 82–85. Hedskog, C., M. Mild, J. Jernberg, and E. Sherwood, G. Brattet al.,
2010 Dynamics of HIV-1 quasispecies during antiviral treat-ment dissected using ultra-deep pyrosequencing. PLoS ONE 5: e11345.
Hermisson, J., and P. Pennings, 2005 Soft sweeps: molecular pop-ulation genetics of adaptation from standing genetic variation. Genetics 169: 2335–2352.
Hernandez, R. D., J. L. Kelley, E. Elyashiv, S. C. Melton, A. Auton
et al., 2011 Classic selective sweeps were rare in recent human evolution. Science 331: 920–924.
Hudson, R. R., K. Bailey, D. Skarecky, J. Kwiatowski, and F. J. Ayala, 1994 Evidence for positive selection in the superoxide dismu-tase (sod) region of Drosophila melanogaster. Genetics 136: 1329–1340.
Kaplan, N. L., R. R. Hudson, and C. H. Langley, 1989 The“ hitch-hiking effect”revisited. Genetics 123: 887–899.
Karasov, T., P. W. Messer, and D. A. Petrov, 2010 Evidence that adaptation in Drosophila is not limited by mutation at single sites. PLoS Genet. 6: 1000924.
Kim, Y., and W. Stephan, 2002 Detecting a local signature of genetic hitchhiking along a recombining chromosome. Genetics 160: 765–777.
Macpherson, J. M., G. Sella, J. C. Davis, and D. A. Petrov, 2007 Genomewide spatial correspondence between nonsy-nonymous divergence and neutral polymorphism reveals exten-sive adaptation in Drosophila. Genetics 177: 2083–2099. Mansky, L. M., and H. M. Temin, 1995 Lower in vivo mutation
rate of human immunodeficiency virus type 1 than that pre-dicted from thefidelity of purified reverse transcriptase. J. Virol. 69: 5087–5094.
Maynard Smith, J., 1971 What use is sex? J. Theor. Biol. 30: 319– 335.
Maynard Smith, J., and J. Haigh, 1974 The hitch-hiking effect of a favourable gene. Genet. Res. 23: 23–35.
Neher, R. A., and T. Leitner, 2010 Recombination rate and selec-tion strength in HIV intra-patient evoluselec-tion. PLoS Comput. Biol. 6: e1000660.
Neher, R. A., and B. I. Shraiman, 2011 Genetic draft and quasi-neutrality in large facultatively sexual populations. Genetics 188: 975–996.
Nielsen, R., S. Williamson, Y. Kim, M. J. Hubisz, A. G. Clarket al., 2005 Genomic scans for selective sweeps using SNP data. Ge-nome Res. 15: 1566–1575.
O’Neil, P. K., G. Sun, H. Yu, Y. Ron, J. P. Dougherty et al., 2002 Mutational analysis of HIV-1 long terminal repeats to explore the relative contribution of reverse transcriptase and RNA polymerase II to viral mutagenesis. J. Biol. Chem. 277: 38053–38061.
Ossowski, S., K. Schneeberger, J. I. Lucas-Lledó, N. Warthmann, R. M. Clarket al., 2010 The rate and molecular spectrum of spon-taneous mutations in Arabidopsis thaliana. Science 327: 92–94. Perelson, A. S., A. U. Neumann, M. Markowitz, J. M. Leonard, and D. D. Ho, 1996 HIV-1 dynamics in vivo: virion clearance rate,
infected cell life-span, and viral generation time. Science 271: 1582–1586.
Pritchard, J. K., J. K. Pickrell, and G. Coop, 2010 The genetics of human adaptation: hard sweeps, soft sweeps, and polygenic adaptation. Curr. Biol. 20: R208–R215.
Przeworski, M., 2003 Estimating the time since the fixation of a beneficial allele. Genetics 164: 1667–1676.
Roach, J., G. Glusman, A. Smit, C. Huff, R. Hubley et al., 2010 Analysis of genetic inheritance in a family quartet by whole-genome sequencing. Science 328: 636.
Sabeti, P. C., D. E. Reich, J. M. Higgins, H. Z. P. Levine, D. J. Richter
et al., 2002 Detecting recent positive selection in the human
genome from haplotype structure. Nature 419: 832–837. Sabeti, P. C., B. Fry, J. Lohmueller, E. Hostetter, C. Cotsapaset al.,
2007 Genome-wide detection and characterization of positive selection in human populations. Nature 449: 913–918. Sattath, S., E. Elyashiv, O. Kolodny, Y. Rinott, and G. Sella,
2011 Pervasive adaptive protein evolution apparent in diver-sity patterns around amino acid substitutions in Drosophila sim-ulans. PLoS Genet. 7: e1001302.
Slatkin, M., and R. R. Hudson, 1991 Pairwise comparisons of mitochondrial DNA sequences in stable and exponentially grow-ing populations. Genetics 129: 555–562.
Tajima, F., 1989 Statistical method for testing the neutral muta-tion hypothesis by DNA polymorphism. Genetics 123: 585–595. Tsibris, A. M. N., B. Korber, R. Arnaout, C. Russ, C.-C. Lo et al., 2009 Quantitative deep sequencing reveals dynamic HIV-1 es-cape and large population shifts during ccr5 antagonist therapy in vivo. PLoS ONE 4: e5683.
Voight, B. F., S. Kudaravalli, X. Wen, and J. K. Pritchard, 2006 A map of recent positive selection in the human genome. PLoS Biol. 4: e72.
Wiehe, T. H., and W. Stephan, 1993 Analysis of a genetic hitch-hiking model, and its application to DNA polymorphism data from Drosophila melanogaster. Mol. Biol. Evol. 10: 842–854. Winckler, W., S. R. Myers, D. J. Richter, R. C. Onofrio, G. J.
McDonaldet al., 2005 Comparison offine-scale recombination rates in humans and chimpanzees. Science 308: 107–111. Yule, G. U., 1925 A mathematical theory of evolution, based on
the conclusions of Dr. J. C. Willis, F.R.S. Philos. Trans. R. Soc. Lond. B Biol. Sci. 213: 21–87.
GENETICS
Supporting Information http://www.genetics.org/content/suppl/2012/04/04/genetics.112.138461.DC1
Estimating the Strength of Selective Sweeps
from Deep Population Diversity Data
Philipp W. Messer and Richard A. Neher
File S1: Supporting Information
I. NEUTRAL HAPLOTYPE SPECTRUM
The haplotype spectrum expected in a haploid neutral Fisher-Wright model without recombination can be calculated from the Ewens sampling formula (Ewens, 1972). Ewens showed that the probability of a sample of sizenis
Pn(a1, a2, . . . , an) =
n! Θ(n)
n Y
m=1
Θ
m
am 1
am!
, (1)
whereaj is the number of allele classes that are sampledjtimes and Θ(k)= Θ(Θ + 1)· · ·(Θ +k−1) with Θ = 2N u.
The expectation ofak is therefore given by
haki= X
a
Θ
k
Θ
k
ak−1 1
(ak−1)!
n! Θ(n)
Y
m6=k
Θ
m
am 1
am!
=X
a
ΘΘ(n−k)n! kΘ(n)(n−k)!
Pn−k(a1, a2, . . . , an) =
ΘΘ(n−k)n! kΘ(n)(n−k)!
= Θ
k
n Y
m=n−k+1
m
Θ +m−1 = Θ
k
n Y
m=n−k+1
1 + Θ−1
m
−1 ≈Θ
ke
−(Θ−1)k/n≈ Θ
k
(2)
where the last two approximate inequalities are accurate if k n and kΘ n, respectively. Hence the expected number ic of allele classes with more thannc members is roughly Θ
PnΘ−1
k=nc k
−1≈Θ(logn−log Θn
c), where cutting
off the sum atk =nΘ−1 approximately accounts for the exponential. With this approximation, the i
cth abundant
allele class is expected to contain
nc ≈
n
Θexp(−ic/Θ) (3)
copies of the allele. A more accurate expression of the spectrum is obtained by determining the nc such that ic = P
k>nchaki, using the exact expression given above. This numerical solution for the haplotype spectrum is plotted in
Figure 2B of the main text.
II. THE DISTRIBUTION OF HAPLOTYPE FREQUENCIES
In the main text, we calculated the distribution of the establishment time of theith haplotype and the frequency of the corresponding haplotype. Here, we show how the joint distribution of all seeding times and the resulting frequency spectrum can be calculated assuming that the novel haplotypes are rare and evolve independently, which is justified if they constitute a small share of the total population, i.e., ifu/s1. In this case, the probability thatkhaplotypes
i= 1, . . . , kare present in frequenciesxi is given by
P(x1, . . . , xk|t) = Z t
0 Y
i
dti Y
i
P(xi|ti, t)P(t1. . . , tk|t), (4)
whereP(xi|ti, t) is the probability that a haplotype has frequencyxi at timetgiven it became established at timeti.
The distribution of establishment timesP(t1. . . , tk|t) is given by
P(t1. . . , tk|t) =
1
k!e
−Rt
0dt
0α(t0)Y
i
α(ti), (5)
where α(t0) = 2suN x(t0) is the rate of establishing novel adaptive haplotypes (main text Equation (1) and below).
Note that theti defined in Equation (5) are not ordered. They are distributed according to a Poisson point process
with densityα(t0). Assuming that established novel haplotypes increase in frequency logistically according to Equation (5) of the main text, we have
P(xi|ti, t) =δ
xi−
e(s−u)(t−ti)
2N s+est
where δ(x) is the Diracδ-function (the stochastic analog is calculated below, see also (Desai and Fisher, 2007)). SubstitutingP(xi|ti, t) into Equation (4) and integrating overti, we obtain
P(x1, . . . , xk|t) =
1
k!e
−Rt
0dt
0α(t0)Y
i
1 (s−u)xi
α(ti) (7)
with ti = t−(s−u)−1log(xi(2N s−est)). Haplotypes that are common after the sweep are most likely seeded
early during the sweep. Furthermore, we showed in Equation (5) of the main text that their relative frequencies stay approximately constant during the amplification phase. Hence we can determine the joint distribution of frequencies at early timests−1log 2N swhileα(t)≈2usest is still exponential. After substituting thet
i and simplifying, we
find
P(x1, . . . , xk|t)≈
e−use st
k!
Y
i
2usesti
(s−u)xi
∼Y
i
x−2−
u s
i , (8)
where we dropped factors independent of xi which ensure normalization. A very similar result was found in (Desai
andFisher, 2007). At larget, the form of the prefactor e−use st
changes due to the saturation of the allele frequency at 1, but the distribution of the frequencies of the haplotypes that were seeded early during the sweep remains of this form until the spectrum is eroded by genetic drift.
The haplotype spectrum therefore decays with a power 2 +u/s, which is consistent with the power 1−u/sobtained for the cumulative or rank spectrum (integrating x−i 2−u/s yields x−i 1−u/s). More importantly, this result tells us that the distribution of haplotype frequencies conditional on the number of haplotypes observed is approximately independent ofu/s if us. Hence, given that a sweep occurred, all information about the strength of the sweep is contained in the number of haplotypes and the precise values of their frequencies do not contain any additional information if u s. However, whenever there are deviations from the assumptions made here, the haplotype frequencies will contain additional information.
III. STOCHASTIC DERIVATION OF THE HAPLOTYPE SPECTRUM
The dynamics of rare haplotypes are strongly influenced by random genetic drift and we have to ascertain the deterministic arguments made in the main text by a more careful stochastic calculation. While hard in general, an approximate analytic calculation of the frequency spectrum of rare haplotypes is feasible in our case for the following reasons: (i) The dynamics of a beneficial allele are essentially deterministic since it is much more frequent than haplotypes that arise through secondary mutations. (ii) The dynamics of rare haplotypes can be described by a linear branching process since they are always a small fraction of the total population.
As already done in Equation (4), we decompose the distribution of haplotype frequencies into the distribution
P(t1, . . . , tk|t) of times when the novel haplotypes arise and probability P(n, t|t0) that a haplotype is present in n
copies at time t, given it arose at time t0. We will derive P(n, t|t0) first and consider the spectrum due to the
superposition of several independent seeding events below.
A. Distribution of rare variants arising in a logistic sweep
To model the stochastic dynamics of rare haplotypes, we use a continuous time branching process in which indi-viduals produce identical copies of themselves with rate 1 +g(t) and die with rate 1, i.e., the unit of time is chosen to be the generation time. The average number of offspring of a given individual in this model is 1 +g(t). Hence,g(t) is the growth rate of the haplotype carrying the beneficial allele. In the case of a sweep, we have
g(t) =s(1−x(t))−u , (9)
where the first term accounts for selection (x(t) is the frequency of the beneficial allele) and the second term accounts for mutations that change the state of the haplotype. The dynamics ofP(n, t|t0) are described by the forward Master
equation
∂tP(n, t|t0) = (1 +g(t))(n−1)P(n−1, t|t0) + (n+ 1)P(n+ 1, t|t0)−(2 +g(t))nP(n, t|t0), (10)
which accounts for replication (first term) and death (second term). To solve for P(n, t|t0), it is useful to consider
the generating functionG(λ, t|t0) =PλnP(n, t|t0), which obeys the equation
with initial conditionG(λ, t0|t0) =λ. This equation can be solved via the method of characteristics, with the result
G(λ, t|t0)≈1−
1−λ
e−
Rt t0dt
0g(t0)
+ (1−λ)Rt
t0dt
0e−Rt
0 t0dt
00g(t00) , (12)
where we have used 1+g(t)≈1 along the way. The latter is a good approximation if selection is weak in one generation and amounts to neglecting terms of orders2. We will now substitute the explicit expression forg(t), where it will be convenient to parametrize the frequency of the beneficial allele asx(t) = (1 +es(τ−t))−1withτ=s−1log 2N s. Using
this form ofg(t), we find for the generating function
G(λ, t|t0) = 1−
˜
s(1−λ)(1 +e−s(t0−τ))e−u(t−t0)
˜
s+ ˜se−s(t−τ)+ (1−λ)
e−s(t0−τ)−u(t−t0)−e−s(t−τ)+ ˜su−1(1−e−u(t−t0)) (13)
where ˜s=s−u. Any haplotype that is abundant enough to be sampled with high probability most likely originated in the early phase of the sweep (t0τ), which allows for the approximation 1 +e−s(t0−τ)≈e−s(t0−τ)(1 +O(n/(sN)))
where nis the sample size. Furthermore, we will typically observe the spectrum at times t τ when the sweep is almost complete. Hence we can approximate 1+e−s(t−τ)≈1+x
W T ≈1 wherexW T is the frequency of the deleterious
wild type allele at the time of sampling. Using these simplifications, we obtain
G(λ, t|t0)≈1−
(1−λ)e−s(t0−τ)−u(t−t0)
1 + (1−λ)(˜s−1e−s(t0−τ)−u(t−t0)+u−1(1−e−u(t−t0))) (14)
This expression is straightforwardly expanded into a geometric series inλwhose coefficients areP(n, t|t0). For large n, one finds
P(n, t|t0)≈
e−s(t0−τ)−u(t−t0)
ˆ
n2 e
−n/nˆ where ˆn=e−s(t0−τ)−u(t−t0) s−u +
1−e−u(t−t0)
u , (15)
with relative corrections being on the order of ˆn−1. The quantity ˆn is the mean copy number of the haplotype conditional on non-extinction, and the two terms contributing to ˆnhave a straightforward interpretation: The first term is the contribution of selection, which amplifies the haplotype before the fixation of the beneficial allele. The second term is the contribution of random genetic drift, which evaluates simply tot−t0in the limit ofu(t−t0)1.
The latter is the analog of the well known fact that a non-extinct neutral allele in a neutral Moran process is on average present inncopies afterngenerations. The expression for ˆnexhibits a crossover from an early regime where selection dominates ˆnto a random drift dominated regime at larget. In the limitu(t−t0)1, we have
ˆ
n(t)≈ (
(s−u)−1es(τ−t0) s(t−t
0)es(τ−t0)
(t−t0) s(t−t0)es(τ−t0)
(16)
This crossover will inform us below about how long the contribution of random drift can be neglected when applying our estimator of the strength of the selective sweep.
B. The haplotype frequency spectrum
Having calculated the copy number distribution of a haplotype that originated at timet0, we now have to determine
the distribution of seeding times and calculate the resulting spectrum of haplotype frequencies. New haplotypes that contain the beneficial allele are produced at rate
γ(t) =N ux(t) = N u
1 +e−s(t−τ) , (17)
where, as before,x(t) is the frequency of the sweeping allele. Note that this differs from the rate of establishment of novel variants by a factor s, which will reemerge from the stochastic calculation. The deterministic approximation for γ(t) is valid if it is unlikely that new variants are seeded before establishment of the founding variant, which requires s u (see Desai and Fisher(2007)). Since novel haplotypes are seeded and evolve independently to a good approximation, the number of haplotypes present inncopies at time tis Poisson distributed with mean
Q(n, t) =
Z t
0