Exploiting Large-Scale Check-In Data to Recommend
Time-Sensitive Routes
#
B.SRINIVASA RAO,
Asst. Professor,
Department of CSE,
MOTHER THERESSA COLLEGE OF ENGINEERING & TECHNOLOGY, PEDDAPALLI,TS,INDIA.
ABSTRACT: Location-based services allow users to perform geo-spatial check in actions, which facilitates the mining of the moving activities of human beings. This paper proposes to recommend time-sensitive trip routes, consisting of a sequence of locations with associated time stamps, based on knowledge extracted from large-scale check-in data. Given a query location with the starting time, our goal is to recommend a time-sensitive route. We argue a good route should consider (a) the popularity of places, (b) the visiting order of places, (c) the proper visiting time of each place, and (d) the proper transit time from one place to another. By devising a statistical model, we integrate these four factors into a goodness function which aims to measure the quality of a route. Equipped with the goodness measure, we propose a greedy method to construct the time-sensitive route for the query. Experiments on Gowalla datasets demonstrate the effectiveness of our model on detecting real routes and cloze test of routes, comparing with other baseline methods. We also develop a system Trip Router as a real-time demo platform.
Keywords: Time-sensitive query, trip recommendation, check-in data.
________________________________________________________________________________________________________
I. INTRODUCTION
Location-based Services (LBS), such as Foursquare 1 and Gowalla2 , allow users to perform check-in actions that pin the geographical information of current location and time stamp onto their personal pages. The rapid accumulation of user check-in records can not only collectively represent the real-world human activities, but also serve as a great resource for location-based recommendation systems. Since the user-moving records implicitly reveal how people travel around an area with rich 1 Foure square: https://foursquare.com/ 2 Gowalla: http://gowalla.com/ spatial and temporal information, including longitude, latitude, and check-in timestamp, one reasonable application leveraging such user-generated check-in data is to recommend the travel routes. Indeed, much existing work recommends routes using GPS trajectories or geo-tagged photos.
In this paper, instead of purely relying on past moving trajectories to recommend traveling paths, we propose a novel time-sensitive trip route recommendation framework that takes advantage of the user-check-in data. We argue that a proper route recommendation system should consider the following factors when designing a route:
The popularity of a place: Popular landmarks by definition should attract more visitors.
The proper time to visit a place: In general, the pleasure of visiting a place can be significantly diminished if arriving at the wrong time. Some places have a wider range of visiting time while others are constrained to certain particular time slots. For example, most people do not want to visit a beach during boiling hot noon, but rather arrive in the late afternoon to enjoy the sunset scene. Or certain ball game
events usually take place at particular time period (e.g. in the evening). As shown in Figure 1, as derived from the Gowalla check-in data described in Section 5, visitors visit some places with higher probability during certain time slots. For example, people usually visit the Empire State Building from about 12:00 to the mid night (note that this place is famous for its excellent night view), (b) people tend to visit the Madison Square Garden in the early evening for a basketball game, (c) the proper time to visit the Central Park is during daytime, and (d) Time Square is preferred from afternoon to midnight.
The amount of time required to transit from one place to
another: The transit time between places is highly
correlated to visiting the next places at proper time. To find the next place with the proper visiting time, we should consider the amount of time spent on traveling from the current location to the next. For example, one has bought tickets to a football game at a stadium 2 hours away. He will logically choose to start traveling toward the stadium 2 hours ahead of the official kick off time instead of going to a nearby museum 30 minutes away.
The visiting order of places: The visiting order of places is important as it depends on the nature of places and human preference. For example, going to the gym first then going to nearby restaurant for dinner is a better plan than the other way around since it is unhealthy to exercise right after a meal.
paper argues that by exploring the check-in data, it is possible to design a statistical model to achieve such goal.
Figure 1: The distribution of the visiting probability at each time unit (hour) for (a) Empire State Building, (b) Madison
Square Garden, (c) Central Park, and (d) Time Square. These distributions are derived from the Gowalla check-in
data.
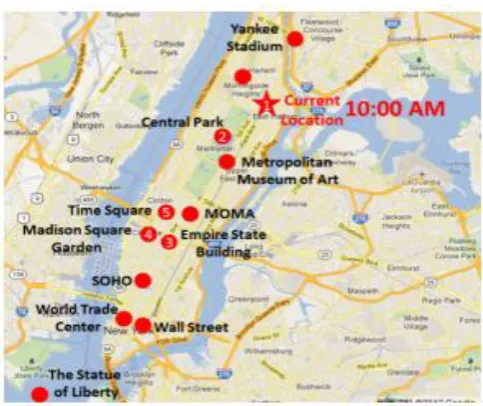
Figure 2: An illustration of recommending a trip route for a query located at the star position with the time stamp 10:00 AM, in Manhattan area, New York City. The goal is to find a trip route connecting some check-in locations with the
consideration of the mentioned four requirements. The online check-in data provide plenty of explicit or implicit information that allows us to fulfill the abovementioned requirements for the sake of planning a proper trip route. First, we can derive from the check-in data the number of people who have visited a certain place, and thus derive the popularity of places. Second, users in LBS tend to perform check-in actions to keep track of their trips in traveling days. As a result, we can obtain and consider the visiting order of places. Third, the check-in records contain the visiting time stamps of locations. Users in LBS are able to collectively reveal the proper visiting time of places. Fourth, followed by the check-in time stamps from existing
routes, we are able to have the transit time between places. Equipped with such elements, we utilize the check-in data to recommend the trip routes. Let us use Figure 2 as an example to elaborate the major idea of our time-sensitive trip route recommendation. Assuming a certain user starts to travel from his New York City hotel, marked with a star in Figure 2, at 10:00 AM. There are several popular attractions he/she can visit in a day, including the four famous places mentioned in Figure 1. If the user wants to visit all four places, a possible trip route consists of going to Central Park first, followed by Empire State Building, Madison Square Garden, and finally Time Square.
Formally, the goal of this paper is to construct a time-sensitive route from the check-in data. Given a starting location with a time stamp as the time-sensitive location query, we propose to find a sequence of check-in locations as the trip route, in which each location can be visited at the proper time with the proper transit time from one place to another in the route. The benefit of such time-sensitive trip route is three-fold. First, the user can maximize the capability/price value on visiting each place. Second, with the suggested transit time, users are able to control their schedule more accurately and manage their time effectively. Third, the trip planner can recommend users one or more attractions along the way.
We propose a statistical approach with a greedy search algorithm to construct the time-sensitive routes with respect to the query. The method consists of two phases. In phase one, we measure the quality of a route by devising a goodness function, which integrates the abovementioned four requirements. In phase two, with the query location and time, we greedily find next visiting places by optimizing the goodness function.
We summarize the contributions of this paper in the following.
We propose a novel time-sensitive trip route recommendation problem using the check-in data in location-based services. We fulfill the idea by developing a TripRouter system based on the real-world Gowalla check-in data.
Conceptually, we argue that a good route should consider four elements: (a) the popularity of a place, (b) the visiting order of places, (c) the proper visiting time of a place, and (d) the proper transit time between places.
This paper is organized as follows. We describe the related work in Section 2. Section 3 devises the goodness of a route and elaborates the greedy route search algorithm.
II. METHODOLOGY
2.1 Basic DefinitionsDefinition 1: Location. A location li is a tuple, li = (xi, yi), where xi is the longitude, yi is the latitude.
Definition 2: Route of Check-in Locations. A route is a sequence of locations with the corresponding time stamps, denoted by s, s=, where n is the number of locations. Throughout this paper, we focus on recommending single-day route, which implies tn-t1 is no more than 24 hours. Definition 3: Time-sensitive Query. We define the Time sensitive Query as Q = (lq, tq), where lq is the initial location of a user, and tq is the starting time for this trip.
Definition 4: Time-sensitive Route. Given a time-sensitive query, we define the output Time-sensitive Route as a sequence of check in locations sr = , where l1 = lq, t1 = tq, and k is the number of locations in the route, which can be either specified by users or determined using existing time constraint of the trip.
In the following we will describe how to measure the quality of a time-sensitive trip route. Based on the proposed goodness definition, we are able to search and recommend better time sensitive routes given an initial time-sensitive query.
2.2 Measuring the Quality of a Trip Route I
n order to construct a high-quality route for recommendation, we need to first design a proper metric to measure the quality of any given route. We propose that a good trip route should consider the following four factors: (a) the popularity of a place, (b) the proper visiting time of a location, (c) the proper transit time traveling from one location to another, and (d) the visiting order of places in the route. We attempt to model these factors into the goodness function, and utilize such function to greedily selecting locations for the construction of the final trip route.
2.2.1 Route Popularity
A popular place, by definition, should be somewhere that attracts more visitors in general. If a route contains more popular places, it has higher potential to satisfy a user. The popularity of a place can be represented by the number of check-in actions performed at that place. In our goodness measure of a route, we first consider the popularity of places in the route. We define the relative popularity of a location li as:
where N(li) is the number of check-in of the location li, and Nmax is the maximum number of check-in among all the locations in the check-in data. Given a route s=, we define the popularity-based goodness function fpop(s) as:
2.2.2 Proper Visiting Time
The check-in data reveals that while some locations (e.g. park and movie theater) are popular regardless of the visiting time in a given day, other locations (e.g. stadium and beach) are more attractive during certain time period of the day. We propose to learn such time-dependent popularity of each location from the check-in data. We begin from defining the Temporal Visiting Distribution as the following.
Definition 5: Temporal Visiting Distribution (TVD) of a Location. We define a Temporal Visiting Distribution for a location l, TVDl (ti), as the probability distribution of a randomly picked check-in record of l occurs at time ti. For example, in a 24- hour span, TVD can be a legal probability distribution shown in Figure 3. TVD can easily be learned from check-in data, representing how popular a place is at a given time.
Using TVD, we can determine whether it is proper to visit a place at a given time. For example, assuming we want to know how well a decision is to visit a place at 8:00AM, given the location‟s TVD is represented as the green dotted line in Figure 3. To do that, we propose to first generate a
thin Gaussian distribution ܩ)ݐ ; ߤ ,ߤଶ) whose mean value is 8 with a very small variance ߤଶ (e.g. standard deviation is
1). And then we can transform the original task into measuring the difference between the Gaussian distribution with the learnt TVD of such location. Here we use the symmetric Kullback-Leibler (KL) Divergence between ܩ)ݐ ; ߤ,ߤଶ) and ܦ ܶ ܶ)ݐ (to represent the fitness of the assignment.
Figure 3: Examples of the temporal visiting distribution (TVD) (the green dotted curve) for a certain location li, and
the duration distribution (DD) (the blue dashed curve) between location li and lj. The black solid curve represents a
normal distribution of a particular time assignment to measure the fitness values.
To schedule a good trip route, another key element to be considered is the visiting time of each place as well as the transit time from one place to another. Although the check-in data cannot explicitly tell us the above two kcheck-inds of information, we can simply treat the duration between two checked-in places as the summation of the visiting time of the first place plus the transportation time from the first to the second place. Such duration can further be utilized to evaluate the quality of a trip. Here we propose the Duration Distribution, as defined in the following, to model such „visiting plus transit time‟ between places.
Definition 6: Duration Distribution (DD) between Two Locations. We define the Duration Distribution (DD) between locations li and lj as the probability distribution over time duration (which can be obtained from the following random experiment: randomly pick two consecutive check-in records (li, ti), (lj,tj) of a person, and calculate the probability that tj-ti=t.
Again, we consider only one-day trip, and therefore treat the outcome space of DD between hours 0 through 24. For example, any legal probability distribution between hours 0 through 24 can be a DD (e.g. the blue dashed line in Figure 3).
Similar to what we do to TVD, given a pair of locations li and lj together with an assignment of a given duration ∆ among them, we can model ∆ as a thin Gaussian distribution
and compare using symmetric KL divergence.
Consequently, for a route s=, it is possible to know how good the route is based on the durations between places by defining a goodness function of duration:
A route s with higher value of fduration(s) indicates such route can be visited with proper “transit+staying” time between places.
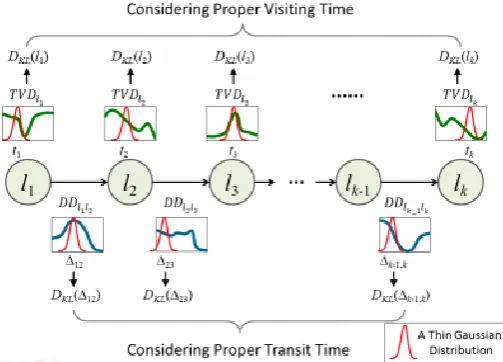
Here we use Figure 4 as an illustration to summarize our idea of utilizing TVD and DD to measure the goodness of a trip route. Given a route s=. We use symmetric KL divergence to measure the visiting fitness of each location li by calculating a DKL(li) value between TVDli and a narrow Gaussian distribution. We also use KL divergence to measure the fitness of each transition li→lj and derive a DKL(Δij) between DDljli and a thin Gaussian distribution. Eventually we compute the geometric mean of such DKL values to be the time-related route goodness.
Figure 4: For a route s=, we compute 2k-1 values of KL-divergence and then take the geometric mean of such values
as the time-dependent goodness of a route.
2.2.4 Proper Visiting Order
Due to the characteristic of each place, there might be certain latent patterns about the order of the places to be visited. With the check-in data, we are able to learn such orders and exploit them to evaluate the quality of a route. For example, going to restaurant for dinner and then going back to hotel is better than the other way around. In this section, we propose to exploit the idea of the n-gram language model to measure the quality of the order of visits in a trip route. Using the check-in corpus, we can first generate the n-gram probabilities of locations. Then, given a route s=, we can compute its n-gram probability. We consider such n-gram probability as the goodness of visiting order. Technically, we use the average value of the probabilities of uni-gram, bi-gram, and tri-gram to estimate the goodness of orders.
2.2.5 Final Goodness Function
Here we integrate the goodness measures of the proper visiting time, the proper transit time duration, and the proper visiting order into the final goodness function f(s). The final goodness function contains two parts. The first part is the average value of the temporal visiting goodness fvisit(s) and the location transition goodness fduration(s). The second part is the visiting order goodness forder(s). We use a parameter α ∈ [0,1] to devise a linear combination of such two parts. The final goodness function f(s) is defined in the following.
2.3 Greedy Algorithm Time Route
In this section, we formally describe the problem of time-sensitive trip route recommendation based on the proposed goodness measure. And then we propose a greedy algorithm, Time Route, to construct the time-sensitive routes for a given query.
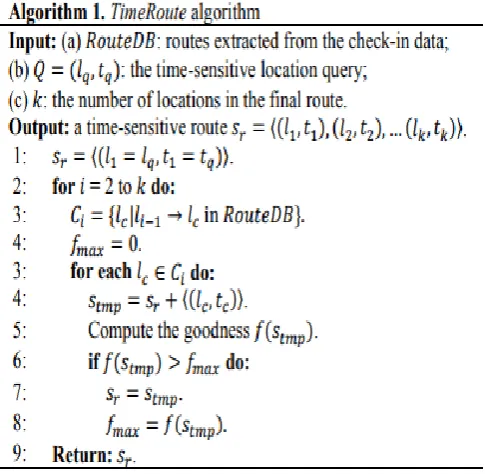
Problem Definition. Given (a) the routes extracted in the check in data, (b) the time-sensitive location query Q = (lq, tq), and (c) the number k of locations in the final route, the goal is to construct a route sr= to optimize f(sr).
To solve this problem, we devise a greedy algorithm, Time Route, to achieve the local-optimal solution. The basic idea is to select next place based on the goodness function f(s). Starting from the query location (line 1 in Algorithm 1), when selecting next location li (i >2), we first identify a set of candidate locations Ci by collecting locations which have been ever followed by li (line 3). Then for each location in the candidate set we select the candidate lc with the maximum goodness value given the existing route, and append it to the final route sr. (line 4-8). Such procedure will terminate when k spots are identified in the route.
III. EXPERIMENTS
3.1 Dataset and Data AnalysisWe utilize the Gowalla dataset [5] which has been exploited for location-based analysis in several places, such as [8] and [9]. The Gowalla dataset contains 6,442,890 check-in records from Feb. 2009 to Oct. 2010. The total number of check-in locations is 1,280,969. Considering a route as a sequence of check-in locations of a user within a day, we construct the route database RouteDB containing 2,605,867 routes, among them 1,469,130 has only length one and are not used. The average route length is 4.09, without considering length-1 routes. Figure 5 shows the distribution of the route length, which is highly-skew and heavily tailed. Figure 5 also shows that people usually do not prefer
visiting too many locations in a day, but with some exceptions. Figure 6 shows the distribution of the time duration between two places. It indicates that people consider places closer to where they are when they are planning the next destination.
Figure 5: Distribution of route length in RouteDB.
Figure 6: Distributions of time duration in RouteDB.
Figure 8: Distribution of time duration for three cities (hour).
IV. SYSTEM DEMONSTRATION
Using our model, we develop an online time-sensitive trip route recommendation system, called TripRouter. The system snapshot is shown in Figure 17. Users first determine the city they want to travel, and then select one location as their starting location, together with the starting time. TripRouter also allows users to specify their estimated travel time duration and the desired number of locations of such trip. We list the three major functions of TripRouter as below: (a) time-sensitive route recommendation, (b) displaying diverse information of locations and routes such as location attributes, route statistics, and some geo-tagged photos obtained from Flickr, and (c) recommending the transportation mode by querying Google Map API according to mined transit time duration.V. CONCLUSION
This paper tries to address an important research question: how much the check-in data can provide in terms of designing a suitable trip route. The solution provided by us seems to be very encouraging as it shows that one can indeed squeeze a lot of knowledge from check-in data to design a time-sensitive trip route that has higher potential of satisfying the users. Note that our approach is mostly data-driven, which assures diverse results can be learned from different cities in which visiting patterns may vary with different culture and characteristics of the city. Ongoing work focuses on two directions: using maximum likelihood estimator to accurately model the visiting time duration of a place and transportation time between places, and further exploit the collaborative filtering approaches to take advantage of the user and location similarities.
REFERENCES
[1] Y. Arase, X, Xie, T. Hara, and S. Nishio. Mining People‟s Trips from Large Scale Geo-tagged Photos. In ACM MM 2010.
[2] Z. Chen, H. T. Shen, and X. Zhou. Discovering Popular Routes from Trajectories. In IEEE ICDE 2011.
[3] Z. Chen, H. T. Shen, X. Zhou, Y. Zheng, and X. Xie. Searching Trajectories by Locations: An Efficiency Study. In ACM SIGMOD 2010.
[4] A.-J. Cheng, Y.-Y. Chen, Y.-T. Huang, W. H. Hsu, and H.-Y. M. Liao. Personalized Travel Recommendation by Mining People Attributes from Community-Contributed Photos. In ACM MM 2011.
[5] E. Cho, S. A. Myers, and J. Leskovec. Friendship and Mobility: User Movement in Location-based Social Networks. In ACM KDD 2011.
[6] T. Kurashima, T. Iwata, G. Irie, and K. Fujimura. Travel Route Recommendation Using Geotags in Photo Sharing Sites. In ACM CIKM 2010.
[7] X. Lu, C. Wang, J.-M. Yang, Y. Pang, and L. Zang. Photo2trip: Generating Travel Routes from Geo-tagged Photos for Trip Planning. In ACM MM 2010.
[8] S. Scellato, A. Noulas, R. Lambiotte, and C. Mascolo. Sociospatial Properties of Online Location-based Social Networks. In ICWSM 2010. [9] S. Scellato, A. Noulas, C. Mascolo. Exploiting Place Features in Link Prediction on Location-based Social Networks. In ACM KDD 2011. [10] L.-A. Tang, Y. Zheng, X. Xie, J. Yuan, X. Yu, and Jiawei Han. Retrieving k-Nearest Neighboring Trajectories by a Set of Point Locations. In SSTD 2011.
[11] L.-Y. Wei, W.-C. Peng, B.-C. Chen, and W.-C. Peng. PATS: A Framework of Pattern-Aware Trajectory Search. In MDM 2010.
[12] L.-Y. Wei, Y. Zheng, and W.-C. Peng, Constructing Popular Routes from Uncertain Trajectories. In ACM KDD 2012.
[13] H. Yoon, Y. Zheng, X. Xie., and W. Woo. Social Itinerary Recommendation from User-generated Digital Trails, In Personal and Ubiquitous Computing, 2011 [14] J. Yuan, Y. Zheng, X. Xie, and G. Sun. Driving with Knowledge from the Physical World. In ACM KDD 2011. [15] J. Yuan, Y. Zheng, C. Zhang, W. Xie, X. Xie, G. Sun, and Y. Huang. T-Drive: Driving Directions Based on Taxi Trajectories. In ACM SIGSPATIAL GIS 2010.
[16] Y. Zheng., L. Zhang, X. Xie, and W.-Y. Ma. Mining Interesting Locations and Travel Sequences from GPS Trajectories. In WWW 2009.
[17] Y. Zheng and X. Xie. Learning Travel
Recommendations from User-generated GPS Traces. In ACM TIST 2011.