Scholarship@Western
Scholarship@Western
Electronic Thesis and Dissertation Repository
7-11-2016 12:00 AM
The Functional Movement Screen Is Not A Valid Measure of
The Functional Movement Screen Is Not A Valid Measure of
Movement Competency
Movement Competency
Leila K. KelleherThe University of Western Ontario
Supervisor James Dickey
The University of Western Ontario Graduate Program in Kinesiology
A thesis submitted in partial fulfillment of the requirements for the degree in Doctor of Philosophy
© Leila K. Kelleher 2016
Follow this and additional works at: https://ir.lib.uwo.ca/etd
Part of the Sports Sciences Commons
Recommended Citation Recommended Citation
Kelleher, Leila K., "The Functional Movement Screen Is Not A Valid Measure of Movement Competency" (2016). Electronic Thesis and Dissertation Repository. 3842.
https://ir.lib.uwo.ca/etd/3842
This Dissertation/Thesis is brought to you for free and open access by Scholarship@Western. It has been accepted for inclusion in Electronic Thesis and Dissertation Repository by an authorized administrator of
Movement assessments are used to determine injury risk, physical competency, and return-to-activity. The Functional Movement Screen (FMS) was developed to identify movement competency and susceptibility to injury. Although this tool is frequently used, its efficacy and validity have not been conclusively determined. The three studies presented in this thesis explored the validity of the FMS through comparison to existing validated tests and statistical measures of internal validity.
The purpose of Study 1 was to determine if performance in the FMS and the Y-Balance Test (YBT) were related. The YBT is a measure of dynamic postural control, a component of functional movement. This study showed partial correspondence between the tests, though the correlation was not strong enough to consider them interchangeable nor that dynamic postural control was a large component of the FMS score
The purpose of Study 2 was to investigate the factorial validity of the FMS. This is
particularly important as the aggregate score of the FMS test is used to determine injury risk. Exploratory factor analysis of a sample of healthy adults revealed that the FMS has a
multidimensional factor structure, and therefore using the aggregate score of the FMS is not appropriate.
The purpose of Study 3 was to assess whether the factor structure of the FMS is consistent across different populations. We compared exploratory factor analyses and factor congruence of the FMS in a general population sample, varsity athletes, and firefighters. We observed a two-factor structure that varied in composition between groups, suggesting that the factor structure of the FMS may differ, according to population.
Overall, this thesis determined that the aggregate score of the FMS is not a valid tool for evaluating functional movement. Although the FMS does appear to partially quantify dynamic postural control, it is also characterized by a lack of consistency between
ii
Keywords
iii
Co-Authorship Statement
Chapters 2-4 are manuscripts that will be submitted for publication. The individual contributions of my collaborators are listed below.
Chapter 2: Title: The Functional Movement Screen Does Not Accurately Quantify Dynamic Postural Control
Author List: Leila Kelleher, Tyson Beach, Shaylyn Kowalchuck, Jordin Higgs, Andrew Johnson, James Dickey
Leila Kelleher – wrote manuscript, study design, data collection and analysis; Tyson Beach – study design, edited manuscript; Shaylyn Kowalchuck – data collection; Jordin Higgs – data collection; Andrew Johnson – data analysis, edited manuscript; James Dickey – study design, edited manuscript
Chapter 3: Title: Exploratory Factor Analysis of Conventional and Alternate Scoring Schemes for the Functional Movement Screen
Author List: Leila Kelleher, Paula van Wyk, Tyson Beach, Andrew Johnson, James Dickey
Leila Kelleher – wrote manuscript, study design, data collection and analysis; Paula van Wyk – data collection; Tyson Beach – edited manuscript; Andrew Johnson – study design, data analysis, edited manuscript; James Dickey – study design, edited manuscript
Chapter 4: Title: Functional Movement Screen Factorial Validity and Congruence is Low in Three Populations
iv
v
Acknowledgments
I cannot thank Jim Dickey, my PhD supervisor, enough for his support, encouragement, mentorship, and dedication through this degree. Without him, I would have never made the switch to biomechanics. His experience and belief in my ability to learn an entirely new field has been instrumental in guiding me through this challenging process. Despite his busy schedule and numerous commitments, he is always able to make time for his graduate students, often going above and beyond by turning around revisions rapidly and assisting with professional connections. Thank you, Jim.
Andrew Johnson, my stats guru, has been incredibly patient and insightful during our data analysis sessions. With him, I was always able to speak candidly about the analysis and where we were headed. He is also a great bike riding teammate and puts up with my commentary and (lack of) speed.
Tyson Beach has been a great source of knowledge about the FMS, strength and
conditioning, and scientific method. I always enjoyed our meetings immensely, and they lasted for hours as we debated and brainstormed. His revisions and suggestions were always thoughtful and in sound judgment.
I would also like to thank my lab mates, past and present, for their support and depth of knowledge. I would especially like to acknowledge Ryan Frayne’s contribution to this thesis. His enthusiasm, sense of humour, and incredible depth of knowledge are only a small part of the way he has supported me during this degree. He has been an amazing sounding board for developing and designing these projects from the very beginning. I wish him all the very best for his very bright future – he deserves it more than anyone I know.
I would not have been able to complete this work without the support of my husband, Peter and my kids, Eleanor and Emmett. Peter has been an incredibly supportive partner through this new phase of my life. He is the most amazing partner, father, and best friend I could imagine.
vi
vii
Table of Contents
Abstract ... i
Co-Authorship Statement... iii
Acknowledgments... v
Table of Contents ... vii
List of Tables ... x
List of Figures ... xi
List of Plates ... xiii
List of Appendices ... xiv
List of Abbreviations ... xv
List of Definitions ... xvi
Chapter 1 ... 1
1 General Introduction ... 1
1.1 The Functional Movement Screen ... 1
1.1.1 Functional Movement Screen Tasks ... 2
1.1.2 Intra- and Inter-rater Reliability ... 5
1.1.3 Injury Risk and the FMS ... 6
1.1.4 Validity of the FMS ... 8
1.2 Thesis Rationale ... 11
1.3 Thesis Organisation ... 11
1.5 References ... 13
Chapter 2 ... 17
2 The Functional Movement Screen Does Not Accurately Quantify Dynamic Postural Control ... 17
viii
2.3 Methods... 21
2.3.1 Subjects ... 21
2.3.2 Procedures ... 21
2.3.3 Statistical Analyses ... 22
2.4 Results ... 22
2.5 Discussion ... 26
2.6 Limitations ... 28
2.7 Conclusions ... 29
2.9 References ... 30
Chapter 3 ... 33
3 Exploratory Factor Analysis of Conventional and Alternate Scoring Schemes for the Functional Movement Screen ... 33
3.1 Abstract ... 33
3.2 Introduction ... 34
3.3 Methods... 37
3.4 Results ... 39
3.5 Discussion ... 42
3.6 Limitations ... 43
3.7 Conclusion ... 44
3.9 References ... 45
Chapter 4 ... 47
4 Functional Movement Screen Factorial Validity and Congruence are Low in Three Populations ... 47
4.1 Abstract ... 47
4.2 Introduction ... 47
ix
4.5 Discussion ... 57
4.6 Limitations ... 60
4.7 Conclusion ... 61
4.9 References ... 62
5 General Discussion and Summary ... 64
5.1 General Discussion ... 64
5.2 Limitations ... 67
5.3 Future Directions ... 68
5.4 Summary ... 69
5.6 References ... 70
Appendix 1 ... 72
Demonstration of Functional Movement Screen tasks ... 72
Demonstration of the Y-balance Test Reach Directions ... 76
Appendix 2 ... 78
x
List of Tables
Table 1: Normalized reach distances (n=78) of the Y-balance test. The distances were
normalized using the participants’ leg length ... 23
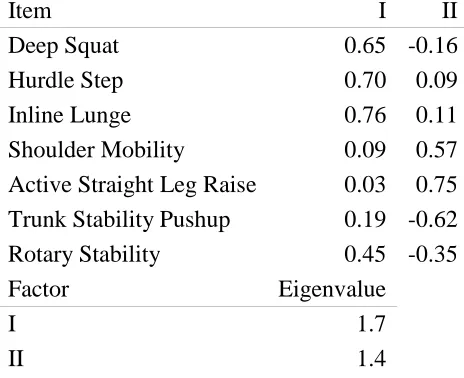
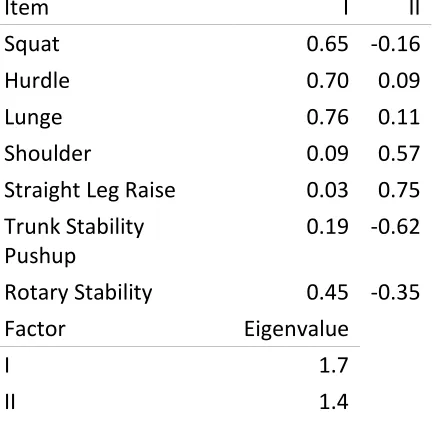
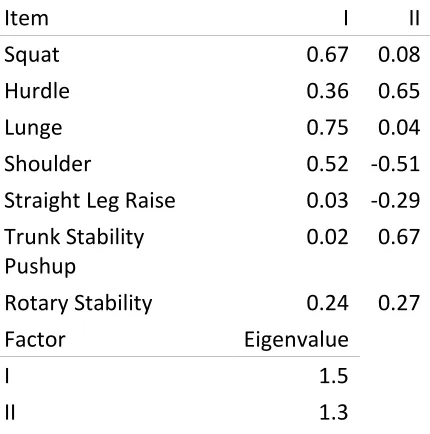
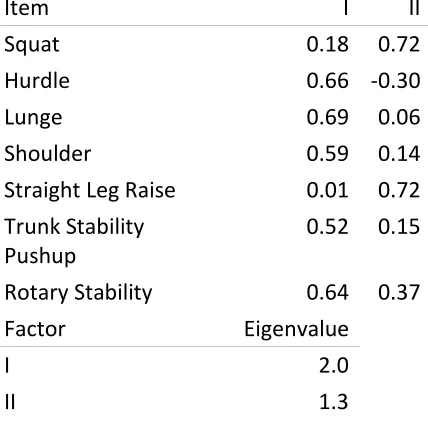
Table 2: Factor loadings for the factor analysis of the FMS using the published scoring criteria ... 41
Table 3: Factor loadings for the factor analysis of the FMS using the alternate scoring criteria ... 41
Table 4: FMS factor loadings in a healthy, general population ... 53
Table 5: FMS factor loadings in varsity athletes ... 55
xi
List of Figures
Figure 1: Relationship between the FMS score and the Y-balance test Anterior reach direction. All reach distances are normalized to the participants’ leg length. The x scale in this graph is set to encompass the values observed in this study. ... 24
Figure 2: Relationship between the FMS score and the Y-balance test Posterolateral reach direction. All reach distances are normalized to the participants’ leg length. The x scale in this graph is set to encompass the values observed in this study. ... 24
Figure 3: Relationship between the FMS score and the Y-balance test Posteromedial reach direction. All reach distances are normalized to the participants’ leg length. The x scale in this graph is set to encompass the values observed in this study. ... 25
Figure 4: ... 26
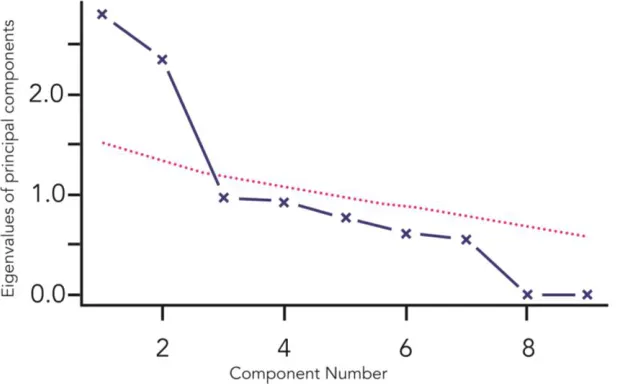
Figure 5: Parallel analysis of the FMS using the published scoring criteria. The dotted line represents the simulated data. The number of factors (indicated with crosses) above this line were extracted in our analysis. ... 39
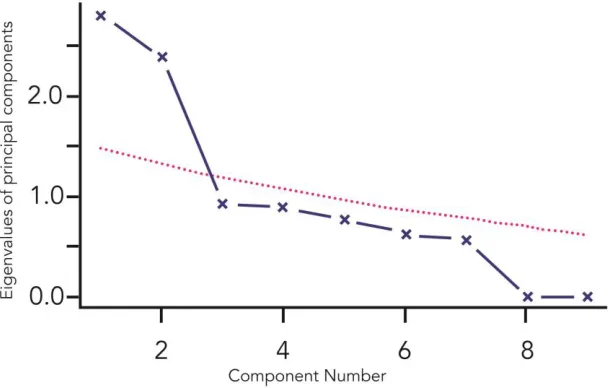
Figure 6: Parallel analysis of the FMS using the alternate scoring criteria (without pain affecting the score). The dotted line represents the simulated data. The number of factors (indicated with crosses) above this line were extracted. ... 40
Figure 7: Parallel analysis of the FMS in a healthy, general population. The dotted line represents the simulated data. The two factors (indicated with crosses) above this line were extracted in our analysis... 53
Figure 8: Parallel analysis of the FMS in varsity athletes. The dotted line represents the simulated data. Two factors were extracted in our analysis. ... 54
xii
xiii
List of Plates
Plate 1: Deep Squat (DS) 72
Plate 2: Hurdle Step (HS) 72
Plate 3: Inline Lunge (ILL) 73
Plate 4: Shoulder Mobility (SM) 73
Plate 5: Shoulder Impingement Clearing Test 73
Plate 6: Active Straight Leg Raise (ASLR) 74
Plate 7: Trunk Stability Pushup (TSPU) 74
Plate 8: Spinal Extension Clearing Test 75
Plate 9: Rotary Stability (RS) 75
Plate 10: Spine Flexion Clearing Test 75
Plate 11: Anterior reach direction 76
Plate 12: Posterolateral reach direction 76
xiv
List of Appendices
Appendix 1 ... 71
xv
List of Abbreviations
FMS Functional Movement Screen
YBT Y-Balance Test
SEBT Star Excursion Balance Test
NHL National Hockey League
NFL National Football League
DS Deep Squat
HS Hurdle Step
ILL Inline Lunge
SM Shoulder Mobility
ASLR Active Straight Leg Raise
TSPU Trunk Stability Pushup
RS Rotary Stability
xvi
List of Definitions
Functional Movement
Typical biomechanical movement within the realm of normal human activity
Functional Movement Screen
A battery of tasks designed by Gray Cook to assess Functional Movement
Global Movement Competency
“Fundamental movement patterns of an individual” (Cook et al., 2014)
Chapter 1
1
General Introduction
Movement assessment tools are used to evaluate recreational, amateur, and professional athletes’ movement competency and susceptibility to injury. Professional sports
organizations have a financial interest in recruiting players who are the least likely to become injured during their careers. Traditionally, performance tests for professional athletes have been based upon sport-specific movements and skills as is seen in the National Football League (NFL) and National Hockey League (NHL) scouting combines. This testing battery also includes quantitative physiological measures of human
performance such as Wingate and VO2 max testing (Rowan et al., 2015). The Functional
Movement Screen (FMS) was designed to assess movement quality (‘functional movement’), and to identify susceptibility to injury, by assigning a score to describe global movement competency (Cook et al., 2006a; 2006b). It is widely used in the fitness industry to assess amateur and recreational athletes’ risk of injury (Beckham and Harper, 2010). The FMS was integrated into the NFL combine in 2011 and into the NHL
combine in 2013 (Rowan et al., 2015). This means that the results of the FMS could affect the career trajectory of a professional athlete. The validity of the FMS as an instrument for quantifying movement competency has not yet been conclusively determined. The global objective of this thesis was, therefore, to further investigate the validity of the FMS as a tool for evaluating human movement through comparison to existing tests of functional movement and statistical evaluation of test construction.
1.1
The Functional Movement Screen
Step (HS), Inline Lunge (ILL), Shoulder Mobility (SM), Active Straight Leg Raise (ASLR), Trunk Stability Pushup (TSPU), and Rotary Stability (RS)) and three associated clearing tests (Cook et al., 2006a; 2006b). The clearing tests are designed to detect pain in specific ranges of motion that are related to the associated movement task (Cook et al., 2006a; 2006b). All movement tasks, apart from the DS and TSPU, are performed
bilaterally. The tasks are scored from zero to three. The FMS is performed using a testing kit, which may be purchased (Functional Movement Systems, Lynchburg, VA, USA) or manufactured. It is administered and graded using published, standardized verbal commands and procedures (Cook et al., 2006a; 2006b). Certification for administering and grading the FMS is attained by attending workshops or online study and by passing an exam. This certification is available at two levels. The first level is considered to be adequate for administering and grading the FMS; the higher level is focused on corrective exercise prescription informed by the FMS score (“FMS Get Certified,” n.d.).
1.1.1 Functional Movement Screen Tasks
The tasks described below are consistent with published FMS guidelines (Cook et al., 2006a; 2006b). The standardized verbal commands which should be used for testing are published elsewhere (Cook et al., 2010). Each of the tasks may be attempted three times during which coaching and/or corrections are not provided. Images of the FMS tasks and clearing tests described below are presented in Appendix 1.
The HS is set up with an elastic hurdle string placed at the height of the subject’s tibial tuberosity. The subject stands upright with their feet together and toes touching the FMS board. The dowel is held horizontally, resting behind their neck on the superior aspect of the trapezius muscles. The subject flexes their hip and knee to raise one leg over the hurdle, touches their heel down on the far side of the board, and then returns to the starting position.
The ILL is set up standing with a staggered stance along the FMS board. The distance between the toe of the back foot and the heel of the front foot is equal to the height of the subject’s tibial tuberosity. The hand contralateral to the front foot holds the dowel behind the neck in line with the spine, and their other hand holds the dowel in the lumbar region of the spinous process. The dowel touches the back of the head, thoracic spine, and sacrum. While maintaining this upright posture, the subject flexes their knees and hips and lunges down, touching the back knee on the board behind the front heel. The subject then returns to the starting position.
SM is assessed by reaching behind their back with hands clasped in fists (thumbs inside the fists), their upper arm flexed at the elbow and reaching down, and their lower arm flexed at the elbow and reaching upwards such that their fists move towards each other. The subject is not permitted to move the fists once they make contact with the back. This task is assessed using the length of the hand (distal wrist crease to middle fingertip) for normalization.
The ASLR is performed with the subject lying supine with the FMS board under their knees. The assessor holds the FMS dowel vertically, halfway between the centre of the patella and the anterior superior iliac spine. The subject begins with feet together and ankles dorsiflexed. The subject then flexes at the hip, raising one leg as high as possible, without flexing their knee or rotating their supporting leg. The position of the medial malleolus of the moving leg with respect to the dowel is used for scoring this task.
line with the top of the forehead (for men) or with the chin (for women). The subject extends their elbows to perform a pushup, without allowing the trunk to deviate from its original alignment. If the subject is not able to perform a correct repetition of this
movement within three trials, the task is repeated with the thumbs level with the chin (for men) or the clavicles (for women).
The RS task is performed with the subject in a quadruped position with the FMS board at the midline of the body (lengthwise between the hands and feet), ankles dorsiflexed and the thumbs and great toes touching the sides of the board. The subject is asked to extend an arm and leg unilaterally, raising the hand, knee, and foot simultaneously. They then flex their knee and elbow, to touch the elbow to the knee, re-extend the arm and leg, and then return to the start position. If the subject is not able to perform a correct repetition of this after three attempts, they perform a similar movement, but move contralateral limbs.
The scoring criteria for each movement task are specified individually, however the general scheme is: zero denotes pain during the movement; severe compensation or an inability to perform the movement is given a score of one; a score of two indicates some deviation from model form; and a score of three is awarded for perfect execution of the movement (Cook et al., 2006a; 2006b).
There are three clearing tests, each associated with a movement task: Shoulder
task becomes zero. For bilateral tasks, such as the ILL, the lower score of the right and left performances is recorded. The calculated scores on the seven tasks are then summed to create an aggregate score out of 21 (Cook et al., 2006a; 2006b).
1.1.2 Intra- and Inter-rater Reliability
A number of studies, with a variety of trained and untrained raters, have shown that the FMS has adequate intra-rater reliability (Gribble et al., 2013; Onate et al., 2012;
1.1.3 Injury Risk and the FMS
An early study examining the ability of the FMS to predict injury in professional football players (n=46) identified increased injury risk during a season if a player scored less than or equal to an FMS score of 14 (Kiesel et al., 2007). That study defined injury as a player being placed on the ‘injured reserve’ list for at least three weeks; however, it did not discriminate between the causes of injury. It is therefore not clear whether the injuries stemmed from “compensatory movement patterns” as suggested by the author of the test (Cook et al., 2006a), or whether the cause was likely unrelated to movement patterns, for example from traumatic, accidental injury such as concussion or shoulder dislocation. That kind of player-to-player contact injury accounted for 64% of injuries in a large sample of high school athletes (Badgeley et al., 2013). The professional players’ field positions were also not examined, which may have influenced their cause of injury. For example, offensive linemen are the most likely to become injured in football, especially from contact injuries (Badgeley et al., 2013). Another early study evaluating the
association between FMS scores and injury was performed with a small (n=38) group of female NCAA division II athletes (Chorba et al., 2010). It dichotomized the players into a high-risk and low-risk group, using the FMS cut-off score of ≤14 as proposed above. They reported a correlation between sustaining a lower body injury during the season and an FMS score of ≤14 (r=0.761; Chorba et al., 2010). Based on these early studies, the ≤14 cutoff was supported as a potential threshold to predict elevated risk for injury. The authors of the original professional football study subsequently published a larger scale study of professional footballers (n=238) which further supported their assertion of the ≤14 threshold; asymmetry was also identified as a significant predictor of injury in this study; Kiesel et al., 2014). Confirmation of the ≤14 threshold was also found in a group of 160 collegiate athletes (Garrison et al., 2015) and in a meta-analysis (Bonazza et al., 2016).
and ASLR were more accurate predictors of running injuries in a group of 193 college track and field athletes than the total FMS score (Hotta et al., 2014). A study of older soccer players reported increased rates of injury with FMS scores <10, but no significant increase in risk using the ≤14 threshold (Hammes et al., 2016). Therefore some studies support the ≤14 threshold while others do not, and some studies have identified different thresholds.
The predictive value of the FMS has also been examined in active military and service personnel. An FMS score of ≤14 predicted injury in firefighters (Butler et al., 2013) and active military servicemen (Bushman et al., 2015). Alternate schemes for identifying individuals at risk of injury have also been proposed. For example, a combination of the FMS and a complementary battery of exercises (three-mile run time, pull-ups, and
1.1.4 Validity of the FMS
1.1.4.1
Factor Analysis
Factor analysis is a classic test construction evaluation technique used to validate tests by analyzing observed variables to reveal underlying latent factors (Tabachnick and Fidell, 2001). It evaluates the correlations between variables to observe the underlying structure of a test. This approach can be used to determine whether the test is measuring the factors that it purports to quantify (its factorial validity).
The factorial validity of the FMS has been investigated using factor analysis in four studies (Gnacinski et al., 2016; Kazman et al., 2014; Koehle et al., 2016; Li et al., 2015). Because the aggregate (total) score of the FMS has been suggested as a tool for
determining susceptibility to injury, it is imperative that the FMS has a single underlying factor. If the FMS has a single factor construction, then it can be considered a valid measure of one overall variable, presumably ‘functional movement’, which would validate the use of the aggregate score.
Exploratory factor analysis was first performed on a large group of U.S. Marine officer candidates (n=934; Kazman et al., 2014). That study investigated the validity of the FMS using two scoring systems – the published scoring criteria (Cook et al., 2006a; 2006b), and an alternate scoring criteria that did not take pain into account. Both analyses
revealed two underlying factors in the FMS – factor one comprising the DS and ILL, with the second factor comprising the HS, SM, ASLR, and TSPU. RS was loaded onto both factors. That study used a population of marine officer candidates, which explains the mainly male (94%) and young (22.4 ±2.7) cohort. This may have affected the results as age-grouped adults perform more poorly on the FMS as age increases (Mitchell et al., 2015).
ILL loaded onto the other factor. SM, ASLR, and the TSPU did not strongly load onto either factor. The main inclusion criterion in that study was having competed at an international level in the Chinese national team. The participants were from a variety of sporting disciplines including team, individual, and target sports, however, this mixed sample should not have affected the outcome as the FMS is designed for use on people with all athletic backgrounds (Cook et al., 2006a; 2006b).
A retrospective chart analysis was performed on a normal, albeit older (age=53.4 ±11.1), population in Canada (n=1113; Koehle et al., 2016). As with the previous two studies, that study showed that the FMS describes two underlying factors. The first factor comprised the DS, HS, and TSPU; SM and ASLR loaded onto the other. RS was split between the two factors. While the TSPU loaded more strongly toward the first factor, the relationship to this factor was not strong (Koehle et al., 2016). Unlike the previous exploratory factor analyses of the FMS, the authors of that paper performed a
confirmatory factor analysis on their data, testing the fit of the extracted factor structure. They found that the two factor model had the best fit when the RS test was removed from the overall model, likely because it was split between both factors (Koehle et al., 2016).
In a paper that clarifies the use of the FMS with respect to recent research, Cook et al. emphasized the use of the FMS as a screening tool, rather than a test, in part due to its apparent multidimensionality (Cook et al., 2014).
1.1.4.2
Other validity studies
Participants’ knowledge of the scoring criteria affects their FMS score (Frost et al., 2015). In that study, subjects were told the grading criteria, but were not verbally coached to perform the movements. The participants’ scores on the DS, HS, ILL, and SM tasks showed statistically significant improvements with this knowledge, which increased mean FMS scores from 14.1(1.8) without knowledge of the criteria, to 16.7(1.9) when the subjects were advised of the grading scheme. This casts doubt on the legitimacy of the use of FMS to measure movement competency since individuals appear to be capable of scoring better on the FMS test simply by being aware of the scoring criteria. In terms of the association between FMS scores and back loads, the peak low-back compression and anterior-posterior and medial-lateral reaction shear forces are not related to scoring above or below an FMS score of 14; this suggests that a low FMS score is not an accurate predictor of low-back injury or pain (Beach et al., 2014a).
The difference between real-time and objective rating methods has also been investigated (Whiteside et al., 2014). That study compared visually-based real-time assessment of the FMS, as proposed by the authors of the FMS (Cook et al., 2006a; 2006b), and an
objective method using an inertial-based motion capture system. Overall, they found poor correspondence between the two methods, suggesting that inaccuracies due to manual grading may affect FMS scores (Whiteside et al., 2014).
Methodological item analysis is a statistical method used to compare the relative
difficulty of different tasks (Lienert and Raatz, 1998). A recent study using this technique
variation suggests that the aggregate FMS score may not be an accurate measure of movement competency as similar FMS scores may not be comparable in difficulty.
1.2
Thesis Rationale
Thus far, evidence supporting the use of the FMS score as a measure of movement competency and injury risk is limited. Three of the four factor analysis studies identify that the FMS has a two-factor structure (Kazman et al., 2014; Koehle et al., 2016; Li et al., 2015), and the fourth presents equivocal single- and two-factor solutions (Gnacinski et al., 2016). The factor loadings in those studies also differ between populations, indicating instability in the structure of the test. A recent review indicated that studies that have evaluated the ≤14 threshold also had inconsistent findings (McCunn et al., 2016). The varied relationship between aggregate FMS scores and injury in these
different groups does not support the accuracy or reliability of the FMS as a predictor of injury. This draws into question whether the aggregate FMS score is a valid measure of a single overall concept (‘functional movement’). Further study of the validity of the FMS is therefore required in order to investigate the validity of FMS test and use of the aggregate score, especially for the purpose of predicting elevated risk of injury in athletes.
1.3
Thesis Organisation
1.5
References
Badgeley, M.A., McIlvain, N.M., Yard, E.E., Fields, S.K., Comstock, R.D., 2013.
Epidemiology of 10,000 High School Football Injuries: Patterns of Injury by Position Played. J Phys Act Health 10, 160–169.
Bardenett, S.M., Micca, J.J., DeNoyelles, J.T., Miller, S.D., Jenk, D.T., Brooks, G.S., 2015. Functional Movement Screen Normative Values and Validity in High School Athletes: Can the FMS Be Used as a Predictor of Injury? Int J Sports Phys Ther 10, 303–308.
Beach, T.A.C., Frost, D.M., Callaghan, J.P., 2014. FMS™ Scores and Low-back Loading During Lifting - Whole-body Movement Screening as an Ergonomic Tool? Applied Ergonomics 45, 482–489.
Beckham, S.G., Harper, M., 2010. FUNCTIONAL TRAINING: Fad or Here to Stay? ACSM's Health & Fitness Journal 14, 24–30.
Bonazza, N.A., Smuin, D., Onks, C.A., Silvis, M.L., Dhawan, A., 2016. Reliability, Validity, and Injury Predictive Value of the Functional Movement Screen: A Systematic Review and Meta-analysis. Am J Sports Med (in press).
Bushman, T.T., Grier, T.L., Canham-Chervak, M., Anderson, M.K., North, W.J., Jones, B.H., 2015. The Functional Movement Screen and Injury Risk: Association and Predictive Value in Active Men. Am J Sports Med 1–9.
Butler, R.J., Contreras, M., Burton, L.C., Plisky, P.J., Goode, A., Kiesel, K., 2013. Modifiable Risk Factors Predict Injuries in Firefighters During Training Academies. Work 46, 11–17.
Butler, R.J., Plisky, P.J., Kiesel, K.B., 2011. Interrater Reliability of Videotaped
Performance on the Functional Movement Screen Using the 100-Point Scoring Scale. Athletic Training & Sports Health Care 4, 103–109.
Chorba, R.S., Chorba, D.J., Bouillon, L.E., Overmyer, C.A., Landis, J.A., 2010. Use of a Functional Movement Screening Tool to Determine Injury Risk in Female Collegiate Athletes. N Am J Sports Phys Ther 5, 47–54.
Cook, G., Burton, L., Hoogenboom, B., 2006a. Pre-Participation Screening: the Use of Fundamental Movements as an Assessment of Function - Part 1. N Am J Sports Phys Ther 1, 62–72.
Cook, G., Burton, L., Hoogenboom, B., 2006b. Pre-Participation Screening: the Use of Fundamental Movements as an Assessment of Function - Part 2. N Am J Sports Phys Ther 1, 132–139.
Cook, G., Burton, L., Kiesel, K., Rose, G., Bryant, M., 2010. Movement: Functional Movement Systems: Screening, Assessment, Corrective Strategies. On Target Publications, Santa Cruz, CA.
Cook, G., Burton, L., Hoogenboom, B.J., Voight, M., 2014. Functional movement
screening: the use of fundamental movements as an assessment of function-part 2. Int J Sports Phys Ther 9, 549–563.
Dossa, K., Cashman, G., Howitt, S., West, B., Murray, N., 2014. Can Injury in Major Junior Hockey Players Be Predicted by a Pre-Season Functional Movement Screen - a Prospective Cohort Study. J Can Chiropr Assoc 58, 421–427.
Elias, J.E., 2013. The Inter-rater Reliability of the Functional Movement Screen within an athletic population using Untrained Raters. J Strength Cond Res 1.
www.functionalmovement.com/certification/fms. URL
http://www.functionalmovement.com/certification/fms (accessed 2.24.16).
Frost, D.M., Beach, T.A., Callaghan, J.P., McGill, S.M., 2015. FMS Scores Change with Performers' Knowledge of the Grading Criteria - Are General Whole-Body
Movement Screens Capturing "Dysfunction"? J Strength Cond Res 29, 3037–3044. Garrison, M., Westrick, R., Johnson, M.R., Benenson, J., 2015. Association Between the
Functional Movement Screen and Injury Development in College Athletes. Int J Sports Phys Ther 10, 21–28.
Gnacinski, S.L., Cornell, D.J., Meyer, B.B., 2016. Functional Movement Screen Factorial Validity and Measurement Invariance Across Sex Among Collegiate
Student-Athletes. J Strength Cond Res (in press).
Gribble, P.A., Brigle, J., Pietrosimone, B.G., Pfile, K.R., Webster, K.A., 2013. Intrarater Reliability of the Functional Movement Screen. Journal of Strength and Conditioning Research 27, 978–981.
Gulgin, H., Hoogenboom, B., 2014. The Functional Movement Screening (FMS): an Inter-Rater Reliability Study Between Raters of Varied Experience 9, 14–20. Hammes, D., aus der Fünten, K., Bizzini, M., Meyer, T., 2016. Injury Prediction in
Veteran Football Players Using the Functional Movement Screen™. J Sports Sci (in press).
Hotta, T., Aoyama, T., Yamada, M., Nishiguchi, S., Fukutani, N., Adachi, D., Tashiro, Y., Morino, S., 2014. Functional movement screen and previous injuries in track and field athletes. Journal of Science and Medicine in Sport 18, e105.
Hotta, T., Nishiguchi, S., Fukutani, N., Tashiro, Y., Adachi, D., Morino, S., Shirooka, H., Nozaki, Y., Hirata, H., Yamaguchi, M., Aoyama, T., 2015. Functional Movement Screen for Predicting Running Injuries in 18- to 24-Year-Old Competitive Male Runners. J Strength Cond Res 29, 2808–2815.
Kazman, J.B., Galecki, J.M., Lisman, P., Deuster, P.A., OʼConnor, F.G., 2014. Factor Structure of the Functional Movement Screen in Marine Officer Candidates. J Strength Cond Res 28, 672–678.
Kiesel, K., Kiesel, K., Plisky, P.J., Plisky, P.J., Voight, M.L., Voight, M.L., 2007. Can Serious Injury in Professional Football be Predicted by a Preseason Functional Movement Screen? N Am J Sports Phys Ther 2, 147–158.
Kiesel, K.B., Butler, R.J., Plisky, P.J., 2014. Prediction of Injury by Limited and Asymmetrical Fundamental Movement Patterns in American Football Players. J Sport Rehabil 23, 88–94.
Knapik, J.J., Cosio-Lima, L.M., Reynolds, K.L., Shumway, R.S., 2015. Efficacy of functional movement screening for predicting injuries in coast guard cadets. J Strength Cond Res 29, 1157–1162.
Koehle, M.S., Saffer, B.Y., Sinnen, N.M., MacInnis, M.J., 2016. Factor Structure and Internal Validity of the Functional Movement Screen in Adults. J Strength Cond Res 30, 540–546.
Kraus, K., Doyscher, R., Schütz, E., 2015. Methodological Item Analysis of the Functional Movement Screen. Dtsch Z Sportmed 2015, 263–268.
Li, Y., Wang, X., Chen, X., Dai, B., 2015. Exploratory Factor Analysis of the Functional Movement Screen in Elite Athletes. J Sports Sci 33, 1166–1172.
Lienert, G.A., Raatz, U., 1998. Testaufbau und Testanalyse. 6 edn, Psychologische Verlagsunion.
Lisman, P., O'Connor, F.G., Deuster, P.A., Knapik, J.J., 2013. Functional Movement Screen and Aerobic Fitness Predict Injuries in Military Training. Medicine & Science in Sports & Exercise 45, 636–643.
McCunn, R., aus der Fünten, K., Fullagar, H.H.K., McKeown, I., Meyer, T., 2016. Reliability and Association with Injury of Movement Screens: A Critical Review. Sports Medicine (in press).
McGill, S., Frost, D., Lam, T., Finlay, T., Darby, K., Cannon, J., 2015. Can Fitness and Movement Quality Prevent Back Injury in Elite Task Force Police Officers? a 5-Year Longitudinal Study. Ergonomics 58, 1682–1689.
Minick, K.I., Kiesel, K.B., Burton, L., Taylor, A., Plisky, P., Butler, R.J., 2010. Interrater reliability of the functional movement screen. J Strength Cond Res 24, 479–486. Mitchell, U.H., Johnson, A.W., Vehrs, P.R., Feland, J.B., Hilton, S.C., 2015.
Performance on the Functional Movement Screen in Older Active Adults. Journal of Sport and Health Science 5, 119–125.
Mostafavifar, M., Wertz, J., Borchers, J., 2015. A Systematic Review of the Effectiveness of Kinesio Taping for Musculoskeletal Injury. The Physician and Sportsmedicine 40, 33–40.
O'Connor, F.G., Deuster, P.A., Davis, J., Pappas, C.G., Knapik, J.J., 2011. Functional Movement Screening: Predicting Injuries in Officer Candidates. Medicine & Science in Sports & Exercise 43, 2224–2230.
Onate, J.A., Dewey, T., Kollock, R.O., Thomas, K.S., Van Lunen, B.L., DeMaio, M., Ringleb, S.I., 2012. Real-Time Intersession and Interrater Reliability of the Functional Movement Screen. Journal of Strength and Conditioning Research 26, 408–415.
Parenteau-G, E., Gaudreault, N., Chambers, S., Boisvert, C., Grenier, A., Gagné, G., Balg, F., 2014. Functional Movement Screen Test: a Reliable Screening Test for Young Elite Ice Hockey Players. Phys Ther Sport 15, 169–175.
Portney, L., Watkins, M., 2000. Foundations of Clinical Research: Applications to Practice. Prentice Hall, Upper Saddle River, NJ.
Rowan, C.P., Kuropkat, C., Gumieniak, R.J., Gledhill, N., Jamnik, V.K., 2015. Integration of the Functional Movement Screen Into the National Hockey League Combine. J Strength Cond Res 29, 1163–1171.
Shultz, R., Anderson, S.C., Matheson, G.O., Marcello, B., Besier, T., 2013. Test-Retest and Interrater Reliability of the Functional Movement Screen. Journal of Athletic Training 48, 331–336.
Smith, C.A., Chimera, N.J., Wright, N.J., Warren, M., 2013. Interrater and Intrarater Reliability of the Functional Movement Screen. J Strength Cond Res 27, 982–987. Tabachnick, B.G., Fidell, L.S., 2001. Using Multivariate Statistics, 5 ed. Pearson, Boston. Terwee, C.B., Mokkink, L.B., Knol, D.L., Ostelo, R.W.J.G., Bouter, L.M., de Vet,
Teyhen, D.S., Shaffer, S.W., Butler, R.J., Goffar, S.L., Kiesel, K.B., Rhon, D.I., Williamson, J.N., Plisky, P.J., 2015. What Risk Factors Are Associated With Musculoskeletal Injury in US Army Rangers? A Prospective Prognostic Study. Clinical Orthopaedics and Related Research® 1–11.
Teyhen, D.S., Shaffer, S.W., Lorenson, C.L., Halfpap, J.P., Donofry, D.F., Walker, M.J., Dugan, J.L., Childs, J.D., 2012. The Functional Movement Screen: a Reliability Study. J Orthop Sports Phys Ther 42, 530–540.
Warren, M., Smith, C.A., Chimera, N.J., 2015. Association of the Functional Movement Screen with Injuries in Division I Athletes. J Sport Rehabil 24, 163–170.
Whiteside, D., Deneweth, J.M., Pohorence, M.A., 2014. Grading the Functional
Movement Screen™: A Comparison of Manual (Real-Time) and Objective Methods. J Strength Cond Res 30, 924–933.
Chapter 2
2
The Functional Movement Screen Does Not Accurately
Quantify Dynamic Postural Control
2.1
Abstract
The Functional Movement Screen (FMS) is used to evaluate key movement patterns, functional symmetry, and identify individuals that are at elevated risk of injury. The purpose of this study was to assess whether dynamic postural control is a significant component of the FMS score by comparing it with Y-Balance Test (YBT) reach
distances. Seventy-eight subjects (including 40 males) performed the standardized FMS protocol followed by the YBT. The YBT reach distances were normalized to leg length and averaged between sides and trials. The individual reach directions were evaluated, and were also summed to form an aggregate YBT score (TotalY). We observed weak correlations between FMS and normalized posterolateral reach, normalized
posteromedial reach, and the TotalY (r=0.36, 0.37, and 0.36, respectively; all p< 0.05). The correlation between FMS and normalized anterior reach was not statistically
significant (r=0.22). Together these findings demonstrate partial correspondence between the two tests. However, the relationship is not strong enough to consider them
interchangeable. This indicates that dynamic postural control is not a large component of the aggregate FMS score.
2.2
Introduction
“movement competency” and “faulty functional movement patterns” (inappropriate stability, mobility, compensatory movements, or proprioceptive/kinesthetic awareness; Cook et al., 2006a). Similarly, the Y-Balance Test (YBT), a modified version of the Star Excursion Balance Test (SEBT), is also used as a pre-participation screening tool and is designed to assess dynamic postural control and injury risk due to poor movement patterns (Plisky et al., 2009). Both the FMS and YBT are commonly used in the strength and conditioning industry (Beckham and Harper, 2010).
The FMS comprises seven functional movement tasks (Deep Squat (DS), Hurdle Step (HS), Inline Lunge (ILL), Shoulder Mobility (SM), Active Straight Leg Raise (ASLR), Trunk Stability Pushup (TSPU), and Rotary Stability (RS)) and three associated clearing tests (Cook et al., 2006a; 2006b). The clearing tests are designed to detect pain in specific ranges of motion that are related to the associated movement task (Cook et al., 2006a; 2006b). All movement tasks, apart from the DS and TSPU, are performed bilaterally. The seven movement tasks are scored from zero to three. The FMS is performed using a testing kit, which may be purchased (Functional Movement Systems, Lynchburg, VA, USA) or manufactured. The FMS is administered and graded using published,
standardized verbal commands and procedures (Cook et al., 2006a; 2006b). Each of the tasks may be attempted three times. Coaching and/or corrections are not provided as knowledge of the grading criteria affects FMS results (Frost et al., 2015). The clearing tests are each associated with a functional test; Shoulder Impingement with SM, Spinal Extension with TSPU, and Spinal Flexion with RS. If the participant reports pain on a clearing test, then the score for the related functional task is changed to zero. For bilateral tasks, such as the ILL, the lower score from the right and left task performances is
recorded. The scores on the seven tasks are summed to create an aggregate score out of 21 (Cook et al., 2006b; 2006a). Images of the FMS tasks are in Appendix 1.
Several studies have investigated the validity of the aggregate FMS score using factor analysis (Gnacinski et al., 2016; Kazman et al., 2014; Koehle et al., 2016; Li et al., 2015). Three of these studies (Kazman et al., 2014; Koehle et al., 2016; Li et al., 2015)
underlying concept, such as ‘functional movement’. In contrast, one study has reported that it was comprised of one factor, supporting the use of the aggregate score (Gnacinski et al., 2016).
The aggregate score of the FMS has been used to screen specific populations for individuals that may be at elevated risk of injury. Three review articles have provided commentary on the varied results of studies investigating the FMS’ accuracy in
identifying individuals with an elevated risk of injury (Bonazza et al., 2016; Krumrei et al., 2014; McCunn et al., 2016). One review concluded that the FMS aggregate score could be used to predict injuries in specific populations (Krumrei et al., 2014); another concluded that injury risk increases with FMS scores ≤14 (Bonazza et al., 2016). The third reported that there is not enough research to support the FMS’ use as an injury prediction tool (McCunn et al., 2016). Clearly there is conflicting evidence about the relationship between FMS score and injuries, however its use as a screening tool may be more appropriate (Cook et al., 2014).
The SEBT is a clinical and research tool which assesses dynamic postural control (Gribble et al., 2012). In this test, subjects stand on a single leg and reach to eight directions with the other leg. The YBT is a reliable, instrumented variation of the SEBT (Plisky et al., 2009). It evaluates dynamic stability, coordination, and strength (Kang et al., 2015; Lee et al., 2014; Overmoyer and Reiser, 2015). In the YBT, the number of reach directions is reduced to anterior, posterolateral, and posteromedial, and the instrumented apparatus increases repeatability (Plisky et al., 2009). In order to account for different anthropometry, reach direction measurements can be normalized to leg length; this was the approach that was used for validation (Plisky et al., 2009). Images of the YBT reach directions are in Appendix 1.
scores have been compared between student-athletes and general college students (Engquist et al., 2015). There was no significant difference between these groups in the aggregate FMS score, however female athletes scored higher than general college students in all directions in the YBT (Engquist et al., 2015). Another study studied the FMS and the YBT in 200 NCAA Division I athletes and found that individuals with a self-reported history of injury or surgery had significantly lower aggregate FMS scores (Chimera et al., 2015). They also reported that female athletes had lower scores on some of the individual tests within the FMS (TSPU and RS) and higher scores on other tests (ILL, SM, and ASLR; (Chimera et al., 2015). However, they did not observe statistically significant differences in the YBT between individuals with and without a self-reported history of injury or surgery, nor between male and female participants (Chimera et al., 2015). The YBT and FMS scores have also been combined in the Move2Perform algorithm (Lehr et al., 2013). This proprietary algorithm uses demographic information, injury history, and the FMS and YBT scores to assess injury risk by placing subjects into four risk categories (normal, slight, moderate, and substantial). The efficacy of this tool was investigated in a group of NCAA athletes during one competitive season; they found a significant difference in lower extremity injury risk when the ‘moderate’ and
2.3
Methods
2.3.1 Subjects
Seventy-eight subjects (40 males and 38 females; age= 28.1 ±9.1, age range 18-55, height 172.1 cm ±11.4, and body mass 71.0 kg ±13.7, BMI =23.9 ±3.1) gave written, informed consent to participate in the protocol approved by the Western University Research Ethics Board. None of the subjects had previously performed or administered the FMS and were therefore unaware of the scoring criteria. Subjects were eligible for inclusion if they were 18-69 years of age and did not have any current health and/or joint problems (they answered “no” to all of the questions in the Physical Activity Readiness
Questionnaire; (Health Canada, 1992).
2.3.2 Procedures
The FMS was administered by a single certified FMS practitioner according to
standardized procedures, equipment (Functional Movement Systems, Lynchburg, VA, USA) and verbal commands (Cook et al., 2006a; 2006b). The participants were video-recorded from the frontal and sagittal planes and the trials were graded at a later time. This is a commonly used (Beach et al., 2014b; Fox et al., 2014; Frost et al., 2015; 2011; 2012; Minick et al., 2010; Mitchell and Johnson, 2015), reliable (Shultz et al., 2013) method for scoring the FMS.
was given, during which the length of their right leg was measured for normalization (right anterior superior illiac spine to medial malleolus; Plisky et al., 2009). The
participants performed three test trials on each leg and in each reach direction. A trial was repeated if it was voided as described above.
2.3.3 Statistical Analyses
The mean of the six test trials in each reach direction of the YBT was calculated for each participant (i.e. three left and three right anterior reach distances were averaged). These mean reach distances were expressed as a proportion of leg length (Plisky et al., 2009). The individual directions were evaluated, and were also summed to form an aggregate YBT score (TotalY). This is similar to the approach used in previous research (Engquist et al., 2015). In this study, we chose to use the aggregate score of the FMS to ensure that we administered and graded the screen according to the intent of its developers (Cook et al., 2006a; 2006b). To determine the extent that the FMS aggregate score is related to the YBT, Pearson product-moment correlation coefficients were calculated between the FMS and YBT for each reach direction, and for the TotalY. These results are presented in the context of the power of the analysis, given the size of the sample. All statistical analyses were conducted in R (Champely, 2015).
2.4
Results
The mean ±standard deviation aggregate FMS score for our participants was 16.3 ±1.9 (range=11-20). Table 1 shows the mean normalized YBT reach distances for all directions. Anterior reach distance was frequently less than the leg length of the
posteromedial reach distances, and the TotalY (r=0.36, 0.37, and 0.36, respectively; p< 0.05), reflecting that between 5 and 14% of the variance is common between the reach distances and the FMS score. These correlations are considered “fair” (Chan, 2003). The correlation between FMS scores and normalized anterior reach distances was not
statistically significant (r=0.22). The relationships between these reach distances and FMS scores are presented in Error! Reference source not found.-3Error! Reference source not found.. The power for these calculations was high for the posterolateral, posteromedial, and TotalY variables (0.907, 0.923, and 0.907 respectively) but low for the anterior reach (0.495).
Table 1: Normalized reach distances (n=78) of the Y-balance test. The distances
were normalized using the participants’ leg length
Anterior Posterolateral Posteromedial Total Y-balance
Mean 0.7 1.1 1.1 3.0
S.D. 0.1 0.1 0.1 0.2
Min. 0.6 0.9 0.8 2.3
Figure 1: Relationship between the FMS score and the Y-balance test Anterior
reach direction. All reach distances are normalized to the participants’ leg length.
The x scale in this graph is set to encompass the values observed in this study.
Figure 2: Relationship between the FMS score and the Y-balance test Posterolateral
reach direction. All reach distances are normalized to the participants’ leg length.
The x scale in this graph is set to encompass the values observed in this study.
y = 5.0567x + 12.646 R = 0.22
0 3 6 9 12 15 18 21
0.55 0.65 0.75 0.85 0.95 1.05
FMS
Scor
e
Normalized Anterior Reach
y = 7.3505x + 7.948 R= 0.36* 0 3 6 9 12 15 18 21
0.85 0.95 1.05 1.15 1.25 1.35
FMS
Scor
e
Figure 3: Relationship between the FMS score and the Y-balance test Posteromedial
reach direction. All reach distances are normalized to the participants’ leg length.
The x scale in this graph is set to encompass the values observed in this study.
y = 7.4339x + 7.936 R = 0.37*
0 3 6 9 12 15 18 21
0.80 0.90 1.00 1.10 1.20 1.30
FMS
Scor
e
Figure 4:Relationship between the FMS score and the TotalY. All reach distances
are normalized to the participants’ leg length. The x scale in this graph is set to
encompass the values observed in this study.
2.5
Discussion
The purpose of this study was to examine the relationship between aggregate FMS scores and YBT reach distances to determine the extent to which the FMS quantifies dynamic postural control. We observed a fair relationship, demonstrating that there is some degree of overlap between the two tests. However, the low level of explained variance suggests that the FMS is not a significant measure of dynamic postural control; there is between 5 and 14% common variance. These results are consistent with earlier work comparing individual FMS task scores with the SEBT (Lockie et al., 2015a). They found a
statistically significant relationship between the TSPU and ILL with the posteromedial reach direction, and between the TSPU and the anteromedial reach direction (that reach direction is not tested in the YBT); however they did not compare the SEBT reach distances with the aggregate FMS score (Lockie et al., 2015b).
y = 2.8968x + 7.6716 R = 0.36*
0 3 6 9 12 15 18 21
2.3 2.5 2.7 2.9 3.1 3.3 3.5 3.7
FMS
Sco
re
To date, much of the FMS literature has studied specific athletic and occupational populations. This study included a range of healthy subjects sampled from a general population. An earlier study examined normative data in a general, healthy sample
(n=209) and reported similar mean FMS scores as our group (15.7 ±1.9; Schneiders et al., 2011). The participants in that study were also similar to our cohort (age=21.9 ±3.7, BMI=24.4 ±3.1), which indicates that our sample was representative of a larger, healthy population. A study examining normative data for middle aged adults (age 50.91 ±10.80, range 21-82; BMI=26.02 ±3.88) reported a mean aggregate FMS score of 14.14 ±2.85 (Perry et al., 2013), which is lower than the current study. That study reported a negative association between age groups and BMI groups, and aggregate FMS scores. That
negative association could explain the higher FMS scores in our study, as the mean age of our participants was lower and they had a lower BMI than the participants in the earlier work.
College-aged athletes and a general student population were compared previously using the FMS and YBT (Engquist et al., 2015). That study reported a mean FMS score of 14.2 ±0.2 for student-athletes and 14.1 ±0.2 for general college students. It is not clear why these FMS scores were so much lower than our sample, especially in the general college sample. Age does not seem to be responsible since the mean age was 20.3 ±1.5 and 21.3 ±1.6 for athletes and students respectively, which is younger than in our study, which suggests there should be higher FMS scores in that cohort than in our study. The YBT in that study was analysed using the best reach performance of the three attempts, compared to our approach averaging the YBT trials. We did not analyse our results using the best reach measure as the validation of the YBT was performed using a mean calculation across three trials (Plisky et al., 2009). Therefore, it is not possible to compare the YBT measurements in that study with our results.
analysis studies concluded that the FMS was comprised of two factors (Kazman et al., 2014; Koehle et al., 2016; Li et al., 2015). This may indicate that the FMS quantifies more than one factor, yet ‘functional movement’ was conceived as a single concept (Cook et al., 2006b; 2006a). If the FMS has a two-factor construction, then it is not appropriate to interpret the aggregate score as a metric of movement competency. In contrast, the standard FMS guidelines state that the FMS is a screening tool, that aggregate scores should be calculated, and that individual components of the FMS tests should not be interpreted (Cook et al., 2014; 2006b; 2006a). Alternative grading schemes have been evaluated (Butler et al., 2011; Frost et al., 2012), and some studies have evaluated specific task scores in isolation (Lockie at al., 2015). It may be that we have observed weak correlations between YBT and FMS scores because the FMS scores do not represent a single hypothetical construct. Since the correlation between FMS and YBT scores were low, we conclude that the FMS does not accurately quantify dynamic postural control.
2.6
Limitations
Correlations tend to be stronger if the ranges of variables are large (Bewick et al., 2003). Accordingly, the restricted range of FMS scores in our study may have attenuated our correlations, thereby limiting our ability to identify relationships that were statistically significant. For example, although we observed a mean FMS score similar to other studies (Betancourt et al., 2015; Frost et al., 2015), we did not have any scores lower than eleven or greater than 20. We found a similar range restriction problem within the TotalY reach distances, as none of our participants had a TotalY lower than 2.3.
2.7
Conclusions
2.9
References
Beach, T.A.C., Frost, D.M., McGill, S.M., Callaghan, J.P., 2014. Physical Fitness
Improvements and Occupational Low-Back Loading - an Exercise Intervention Study with Firefighters. Ergonomics 57, 37–41.
Beckham, S.G., Harper, M., 2010. FUNCTIONAL TRAINING: Fad or Here to Stay? ACSM's Health & Fitness Journal 14, 24–30.
Betancourt, J.E., Betancourt, J.P., Estrada, L., Ortiz, I., 2015. A Functional Movement Screening on 6th Grade Students of a Caribbean Elementary Laboratory School. International Journal of Physical Education, Fitness, and Sports 4, 1–16.
Bewick, V., Cheek, L., Ball, J., 2003. Statistics Review 7: Correlation and Regression. Crit Care 7, 451–459.
Bonazza, N.A., Smuin, D., Onks, C.A., Silvis, M.L., Dhawan, A., 2016. Reliability, Validity, and Injury Predictive Value of the Functional Movement Screen: A Systematic Review and Meta-analysis. Am J Sports Med (in press).
Butler, R.J., Plisky, P.J., Kiesel, K.B., 2011. Interrater Reliability of Videotaped
Performance on the Functional Movement Screen Using the 100-Point Scoring Scale. Athletic Training & Sports Health Care 4, 103–109.
Champely, S., 2015. pwr: Basic Functions for Power Analysis. R Package Version 1.1. Chan, Y.H., 2003. Biostatistics 104: Correlational Analysis. Singapore Medical Journal
44, 614–619.
Chimera, N.J., Smith, C.A., Warren, M., 2015. Injury History, Sex, and Performance on the Functional Movement Screen and Y Balance Test. Journal of Athletic Training 50, 475–485.
Cook, G., Burton, L., Hoogenboom, B., 2006a. Pre-Participation Screening: the Use of Fundamental Movements as an Assessment of Function - Part 1. N Am J Sports Phys Ther 1, 62–72.
Cook, G., Burton, L., Hoogenboom, B., 2006b. Pre-Participation Screening: the Use of Fundamental Movements as an Assessment of Function - Part 2. N Am J Sports Phys Ther 1, 132–139.
Cook, G., Burton, L., Hoogenboom, B.J., Voight, M., 2014. Functional movement
screening: the use of fundamental movements as an assessment of function-part 2. Int J Sports Phys Ther 9, 549–563.
Engquist, K.D., Smith, C.A., Chimera, N.J., Warren, M., 2015. Performance Comparison of Student-Athletes and General College Students on the Functional Movement Screen™ and the Y Balance Test. J Strength Cond Res 29, 2296–2303.
Fox, D., O’Malley, E., Blake, C., 2014. Normative Data for the Functional Movement Screen in Male Gaelic Field Sports. Phys Ther Sport 15, 194–199.
Frost, D.M., Beach, T.A., Callaghan, J.P., McGill, S.M., 2015. FMS Scores Change with Performers' Knowledge of the Grading Criteria - Are General Whole-Body
Movement Screens Capturing "Dysfunction"? J Strength Cond Res 29, 3037–3044. Frost, D.M., Beach, T.A., Callaghan, J.P., McGill, S.M., 2011. Movement Screening for
Performance: What Information Do We Need to Guide Exercise Progression? J Strength Cond Res 25, S2–S3.
1620–1630.
Gnacinski, S.L., Cornell, D.J., Meyer, B.B., 2016. Functional Movement Screen Factorial Validity and Measurement Invariance Across Sex Among Collegiate
Student-Athletes. J Strength Cond Res (in press).
Gribble, P.A., Hertel, J., Plisky, P., 2012. Using the Star Excursion Balance Test to Assess Dynamic Postural-Control Deficits and Outcomes in Lower Extremity Injury: a Literature and Systematic Review. Journal of Athletic Training 47, 339–357. Health Canada, B.C.M.O.H.D.O.N., 1992. Physical Activity Readiness Questionnaire. Kang, M.-H., Kim, G.-M., Kwon, O.-Y., Weon, J.-H., Oh, J.-S., An, D.-H., 2015.
Relationship Between the Kinematics of the Trunk and Lower Extremity and Performance on the Y-Balance Test. PM R 7, 1152–1158.
Kazman, J.B., Galecki, J.M., Lisman, P., Deuster, P.A., OʼConnor, F.G., 2014. Factor Structure of the Functional Movement Screen in Marine Officer Candidates. J Strength Cond Res 28, 672–678.
Koehle, M.S., Saffer, B.Y., Sinnen, N.M., MacInnis, M.J., 2016. Factor Structure and Internal Validity of the Functional Movement Screen in Adults. J Strength Cond Res 30, 540–546.
Krumrei, K., Flanagan, M., Bruner, J., Durall, C., 2014. The Accuracy of the Functional Movement Screen to Identify Individuals With an Elevated Risk of Musculoskeletal Injury. J Sport Rehabil 23, 360–364.
Lee, D.-K., Kim, G.-M., Ha, S.-M., Oh, J.-S., 2014. Correlation of the Y-Balance Test with Lower-limb Strength of Adult Women. Journal of Physical Therapy Science 26, 641–643.
Li, Y., Wang, X., Chen, X., Dai, B., 2015. Exploratory Factor Analysis of the Functional Movement Screen in Elite Athletes. J Sports Sci 33, 1166–1172.
Lockie, R., Callaghan, S., Jordan, C., Luczo, T., Jeffriess, M., Jalilvand, F., Schultz, A., 2015a. Certain Actions from the Functional Movement Screen Do Not Provide an Indication of Dynamic Stability. Journal of Human Kinetics 47, 19–29.
Lockie, R., Schultz, A., Callaghan, S., Corrin, C., Luczo, T., Jeffriess, M., 2015b. A Preliminary Investigation Into the Relationship Between Functional Movement Screen Scores and Athletic Physical Performance in Female Team Sport Athletes. Biol Sport 32, 41–51.
McCunn, R., aus der Fünten, K., Fullagar, H.H.K., McKeown, I., Meyer, T., 2016. Reliability and Association with Injury of Movement Screens: A Critical Review. Sports Medicine (in press).
Minick, K.I., Kiesel, K.B., Burton, L., Taylor, A., Plisky, P., Butler, R.J., 2010. Interrater reliability of the functional movement screen. J Strength Cond Res 24, 479–486. Mitchell, U.H., Johnson, A.W., 2015. Relationship between functional movement screen
scores, core strength, posture, and body mass index in school children in Moldova. The Journal of Strength & ….
Overmoyer, G.V., Reiser, R.F., 2015. Relationships Between Lower-Extremity Flexibility, Asymmetries, and the Y-Balance Test. J Strength Cond Res 1–24. Perry, F.T., Perry, F.T., Koehle, M.S., Koehle, M.S., 2013. Normative Data for the
Functional Movement Screen in Middle-Aged Adults. J Strength Cond Res 27, 458. Plisky, P.J., Gorman, P.P., Butler, R.J., Kiesel, K.B., Underwood, F.B., Elkins, B., 2009.
Excursion Balance Test. N Am J Sports Phys Ther 4, 92–99.
Plisky, P.J., Rauh, M.J., Kaminski, T.W., Underwood, F.B., 2006. Star Excursion Balance Test as a Predictor of Lower Extremity Injury in High School Basketball Players. Journal of Orthopaedic & Sports Physical Therapy 36, 911–919.
Robinson, R.H., Gribble, P.A., 2008. Support for a Reduction in the Number of Trials Needed for the Star Excursion Balance Test. Arch Phys Med Rehabil 89, 364–370. Schneiders, A.G., Davidsson, Å., Hörman, E., 2011. Functional movement screenTM
normative values in a young, active population. Int J Sports Phys Ther.
Shultz, R., Anderson, S.C., Matheson, G.O., Marcello, B., Besier, T., 2013. Test-Retest and Interrater Reliability of the Functional Movement Screen. Journal of Athletic Training 48, 331–336.
Teyhen, D.S., Riebel, M.A., McArthur, D.R., Savini, M., Jones, M.J., Goffar, S.L., Kiesel, K.B., Plisky, P.J., 2014. Normative Data and the Influence of Age and
Chapter 3
3
Exploratory Factor Analysis of Conventional and
Alternate Scoring Schemes for the Functional
Movement Screen
3.1
Abstract
The Functional Movement Screen (FMS) is a tool for evaluating injury risk based on
qualitative appraisal of whole-body movement patterns. Its conventional scoring scheme
assumes that the scores from the seven component tasks are independent, though testing
complementary elements of one underlying factor. Accordingly, it is important to
perform a factor analysis to determine the number of underlying factors in the test to
assess its validity as a unitary construct.The FMS was administered to 100 healthy
subjects from the general population. The FMS tasks were scored according to the
published criteria, and also with an alternate grading scheme that did not account for
pain. The factor structure was tested using a principal components analysis, and
interpretation was facilitated using a varimax rotation. Examination of the eigenvalues
suggested a two-factor solution that explained 45.2% of the variability in the FMS score
when graded using the published scheme and 46.2% using the alternate scoring system
without accounting for pain. In both analyses, three tasks (DS, HS, ILL) loaded on the
first factor, three tasks (SM, ASLR, TSPU) loaded on the second factor, and the seventh
task (RS) was split between the two factors. Our finding with a healthy, general
population is consistent with previous exploratory factor analyses. Since the FMS does
not test a single overall variable, the aggregate score of the FMS should not be considered
FMS tasks scores may be used for this purpose, and to identify pain-provoking movement
patterns.
3.2
Introduction
The Functional Movement Screen (FMS) was designed as a screening tool to evaluate
movement competency in professional and recreational athletes (Cook et al., 2006a;
2006b). It comprises seven functional movement tasks (Deep Squat (DS), Hurdle Step
(HS), Inline Lunge (ILL), Shoulder Mobility (SM), Active Straight-Leg Raise (ASLR),
Trunk Stability Pushup (TSPU), Rotary Stability (RS)), and three clearing tests to detect
whether pain is elicited during the movement tasks. Five of the functional movement
tasks are performed bilaterally (HS, ILL, SM, ASLR, and RS), as is one of the clearing
tests (Shoulder Impingement). The scoring of the FMS is standardized (Cook et al.,
2006a; 2006b), and is briefly described for completeness. Each of the functional
movement tasks is scored from zero to three. Zero denotes pain during the movement.
Severe compensation or an inability to perform the movement is given a score of one,
while a score of two indicates some compensation, and a score of three is awarded for
perfect execution of the movement. The three clearing tests are each associated with a
movement task; Shoulder Impingement with SM, Spinal Extension with TSPU, and
Spinal Flexion with RS. If pain is reported while performing a clearing test, then the
score for the related task is changed to zero. For bilateral tasks, the lower of the unilateral
scores is used for the final calculation. These scores are added together to create an
The aggregate FMS score is also used to identify those at elevated risk of injury. Varying
thresholds have been identified in different groups (Krumrei et al., 2014; McCunn et al.,
2016). For example, a score of ≤14 was determined as a threshold for injury risk by using
a cohort of professional American football players (Kiesel et al., 2007). This threshold is
supported by some research (Bonazza et al., 2016; Chorba et al., 2010; Kiesel et al.,
2014; O'Connor et al., 2011), but other studies have reported different scores that indicate
an elevated risk of injury (Bardenett et al., 2015; Hotta et al., 2015; Knapik et al., 2015).
The relationship between FMS and injury history has also been investigated. One study
reported a significant correlation between the FMS scores and injury history in track and
field athletes (Hotta et al., 2014). The aggregate FMS score has also predicted
performance in occupational tasks in Police officers (Bock et al., 2014) and physical
performance tests in basketball players (Klusemann et al., 2011). This use of the
aggregate score of the FMS necessitates its validation.
Exploratory factor analysis is a statistical data-reduction method used to determine the
number of underlying factors in a tool. The use of an aggregate (summed) score assumes
that the tool has unidimensional construction – that it is measuring a single factor
(Gorsuch, 1983). Unidimensionality in the FMS would indicate that it is appropriate to
calculate an overall score by straight addition (unweighted), and that degraded
performance on one task is equivalent to degraded performance on any other task.
Exploratory factor analysis has been performed on the FMS in several populations. One
large study of US Marines (Kazman et al., 2014) analysed the FMS using the traditional
scoring model (a score of zero for reporting of pain) and a ‘no pain’ model, where the
group reported that the FMS was composed of two factors – one factor was loaded with
the DS and ILL; the second factor with the HS, SM, ASLR, and TSPU tasks. The RS task
was loaded onto both factors. They also showed that the FMS had low internal
consistency (Cronbach’s alpha=0.39; Kazman et al., 2014). Another study used a cohort
of 290 Chinese elite-level athletes (Li et al., 2015). They determined that the FMS was
composed of two factors. One factor was heavily loaded with the RS task and the other
factor was strongly loaded with the DS, HS, and ILL tasks, with low loadings of the other
tasks. In contrast to the conventional approach for grading the FMS using the aggregate
score (Cook et al., 2006a; 2006b), they concluded that the individual tasks of the FMS
should be viewed independently.
A recent study used exploratory factor analysis to evaluate the FMS at a preventative
health care centre (Koehle et al., 2016). There were no specific inclusion criteria for that
study, so participants may have had physical injuries or health problems at the time the
test was conducted. That study found that the FMS was composed of two factors; one
factor comprising the DS, HS, ILL, and TSPU tasks, and the other describing the SM and
ASLR tasks, with the RS task split between the two factors. As with the two earlier
exploratory factor analyses, the results in that study do not support the use of the
aggregate score of the FMS, as they observed a multidimensional construction.
One study performed a confirmatory factor analysis on the FMS. That study tested the
fits of two- and single-factor models in a population of varsity athletes (Gnacinski et al.,
2016). They did not find a statistically significant difference between the model fits, but
there was a trend for the two-factor model to be superior (p=0.054). They concluded that