201 | P a g e
An Improved Sampling Algorithm for Imbalanced Data
Sets in the context of Ordinal Classification
D.Dhanalakshmi
1, Dr.Anna Saro Vijendran
21
Ph.D scholar, Graduate Student IEEE Member, Department of Computer Science, Sri Ramakrishna
College of Arts and Science, Coimbatore, (India)
2
Dean, School of Computing, Sri Ramakrishna College of
Arts and Science, Coimbatore, (India)
ABSTRACT
Classification of data becomes problematic due to class imbalance nature and classes having ordering
relationship. The main objective of this research is to improve the classification accuracy and maintain the
class order for nonlinear patterns in the context of ordinal classification. This work proposes a novel collinear
based modified sampling technique to strengthen the probable area of synthetic pattern. Experimental results
with data sets shows that, our proposed collinear based modified sampling yields better ordinal classification
performance in terms of accuracy and sensitivity compared with currently existing solutions. The performance
evaluation is conducted in terms of the parameters called Maximum Mean Absolute Error, Geometric Mean.
This technique provides an effective and efficient solution for imbalanced complex data sets.
Keywords—
Classification, , Collinear, Imbalance, Ordinal classification, Oversampling,
Maximum Mean Absolute Error, Geometric Mean
I. INTRODUCTION
202 | P a g e
II. RELATED WORK
Data samples are one of the most important sources to do research activity especially in data analysis. Samples are used to implement and test machine learning algorithms. The performance of the machine learning algorithms is directly related to data samples. Machine learning algorithms work well with balanced data sets. Many real world data samples are not balanced. Some of the examples are intrusion detection, natural disaster, least performance prediction in educational data mining etc. Class which contains very limited amount of samples is called as Rare events. But those rare events create very big impact. Predicting such rare events is crucial and challenging task. Insufficiency of data, noise and concept intricacy are more responsible for imbalance problem. The class imbalance problem arises from either between classes or within class [5]. [6] Author suggested focusing on the structure and distribution of minority class samples gives more classification accuracy. New solutions are required to tackle multiclass imbalanced and rare samples.[7] Authors concluded that pre-processing algorithms to solve imbalance problem is better than algorithmic level approaches. Jaime S. Cardoso, Joaquim F. Pinto da Costa [8] explained Eibe Frank and Mark Hall’s method of converting the original K-class ordinal problem into sequence of k-1 problem lead to intersecting boundaries. To avoid the above mentioned issue, this work make use of data replication method and converts the original ordinal problem into two class problem and mapped into SVM and Neural network classifiers. Mean Absolute Deviation (MAD), Mean Square Error (MSE) values based on numbers assigned to classes. Spearman and kendall’s tau-b co-efficient which exhibit the true relation between
the predicted class and the actual class, these two measures are also considered in addition with MAD and MSE. Krzysztof Dembczyński , Wojciech Kotłowski and Roman Słowiński [9] proposed two algorithms Ordinal
203 | P a g e
III.PROBLEM DEFINITION
In multiclass ordinal imbalanced scenario, the samples are unevenly distributed in complex datasets. The patterns are created in borderline increases classification accuracy degrades in terms of ordering relationship of classes. Considering the path information maintains the ordering structure in between classes. Creation of new patterns to address within class imbalanced problem is more changeling task. The proposed methodology addresses this issue.
IV. PROPOSED METHODOLOGY
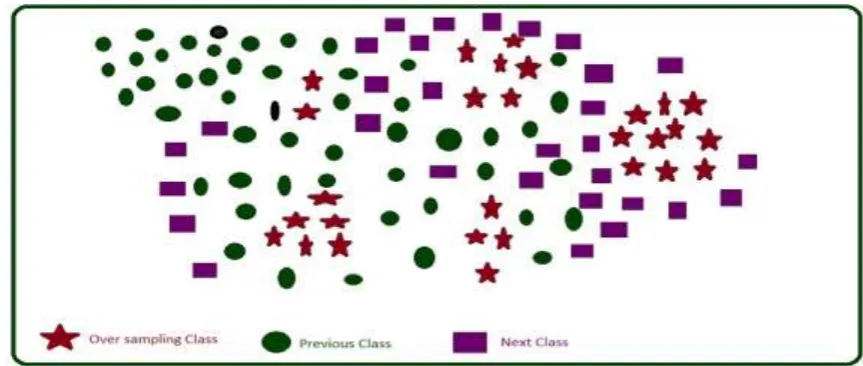
Our suggested technique is closely connected to Graph-Based Approach for Over-Sampling in the Context of Ordinal Regression [13]. The authors [13] suggested that, path information is most useful to maintain the ordering relation in between the classes. In ordinal graph-based over-sampling via interior shortest paths (OGO-ISP) [13] creates synthetic patterns on the shortest paths interior class edges based on oversampling rate. Like OGO-ISP, our proposed collinear based modified sampling technique constructs graph and find shortest distance. Authors [15] proposed collinear based oversampling in the intra class edges. The variation in our proposed technique compare with the works [13] [15] is instead of creating synthetic pattern using two seed patterns it uses more than two surrounded patterns to strengthen the probable area of synthetic patterns in the interior class edges. The proposed methodology is used to tackle the issue depicted in Fig. 1.
Fig 1. Example of sample distribution for complicated dataset
4.1Algorithm Steps
The detailed procedure of oversampling with collinear patterns is given below:
Step 1: Select the class to be oversampled
204 | P a g e
Step 2: Create graph for the picked class
For ex, q be the index of the class we want to over-sample. Create graph
G
q for classC
q based on three sub graphsG
q1,q,G
q,q andG
q,q1Step 3: Construct
G
q1,qFor every pattern in qth class, find its k-nearest neighbour in the q-1th class using the formula
)
,
,
(
X
X
1k
N
d q q . Create edges.For every pattern in q-1th class, find its k-nearest neighbour in the qth class using the
formula
N
d(
X
q1,
X
q,
k
)
. Create edges.Step 4: Construct graph
G
q1,qwith edges only those are common in)
,
,
(
X
1X
k
N
d q q
N
d(
X
q,
X
q1,
k
)
Step 5: Construct
G
q,qFor every pattern in qth class, find its k nearest neighbours in the qth class and create edges with these neighbours
Step 6: Construct
G
q,q1 same likeG
q1,qStep7: Find the shortest path from
G
q1,qtoG
q,q1viaG
q,qusing Dijkstra’s algorithm for each vertex inG
q1,qStep 8: Select an edge from
G
q,q based on oversampling rate that should be one of the shortest path edgeCreation of synthetic patterns
Step 9: Decide new synthetic pattern
S
p in between the 2 seed patternsStep 10:Find 6-nearest neighbours for
S
pexcept 2 seed patternsFrom 6-nearest neighbours find number of minority and majority patterns
'
205 | P a g e
m= Number of minority patterns
'
m
+m=6Step 11 : If (3<=m<=6) And (
S
pand any2 minority patterns are collinear) And (S
p lies between any 2 minority patterns) then AcceptS
pas synthetic patternsElse
Repeat step 8;
End
4.2
Dataset Characteristics
The goal of our experiments is to examine the new proposed method with the relevant work. The data set adopted for our experiments are shown in Table I. The processed datasets are derived from [14].
Table1. Nature of Data sets
Dataset Total number of
patterns Number of Attributes Total number of classes
Toy 300 2 5
wisconsin5 194 32 5
Bondrate 57 37 4
housing5 506 13 5
balance-scale 625 4 3
ERA 1000 4 9
triazines10 186 60 10
machine10 209 6 10
Car 1728 21 4
ESL 488 4 9
4.3
Evaluation Measures
4.3.1 Information Retrieval
Q qq
IR
Q
IR
1
1
206 | P a g e
4.3.2 IR for each class
q q j j q
N
Q
N
IR
.
,whereN
jis no. of samples inj
thclass4.3.3 Mean Absolute Error (MAE)
MAE is the average amount of deviation between predicted class label and actual class label.
q N i i i qq
y
y
N
MAE
1)
ˆ
(
)
(
1
4.3.4 Mean Square Error
MSE is the average amount of squared deviation between predicted class label and actual class
21
)
ˆ
(
)
(
1
q N i i i qq
y
y
N
MSE
4.3.5 Mean zero-one error (MZE)
MZE = 1- Acc, Where Acc is accuracy or correct classification rate.
[15] Suggested that MAE, MSE and MZE measures are not adequate to evaluate ordinal classification. These are measures are not suitable to maintain the class order accuracy.
4.4 Additional Measures for Ordinal Classification
4.4.1 Maximum Mean Absolute Error (MMAE)
[16] Proposed MMAE exclusively for ordinal classification. It considers the MAE value which has great distance between true labels and predicted one.
MMAE=
max
MAE
q;
q
1
,....,
Q
4.4.2 Geometric Mean Sensitivity
Geometric mean of the correct classification rates for all classes, Q Q q q
S
GMS
1 ,Where)))
(
)
ˆ
(
(
1
1 i N i i qq
I
O
y
O
y
N
S
q
is percentage of correctly classified samples for the th
207 | P a g e
4.4
Experimental Results
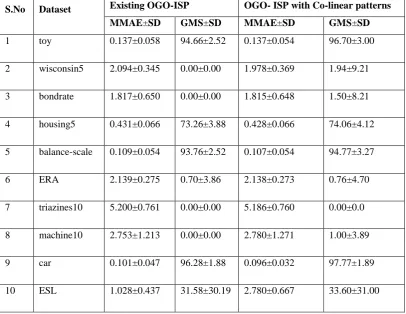
In our experiments, minority classes are identified using IR value lies higher than 1.5. Both overall accuracy and per class accuracy are the vital factors for ordinal classification problem. We use the evaluation measures such as Maximum-Mean Absolute Error (MMAE) and Geometric Mean sensitivity (GMS) for comparing the results against the existing method. Support Vector Ordinal Regression with Implicit Constraints (SVORIM) is considered as a classifier. The average MMAE and GMS values are considered by applying a holdout stratified technique to divide the datasets 30 times, using 75 percent of patterns for training and 25 percent for testing. Table II. Shows the experimental results obtained after the experiment for the datasets which shows better accuracy with high sensitivity.
Table 2. Experimental Results
S.No Dataset Existing OGO-ISP OGO- ISP with Co-linear patterns
MMAE±SD GMS±SD MMAE±SD GMS±SD
1 toy 0.137±0.058 94.66±2.52 0.137±0.054 96.70±3.00
2 wisconsin5 2.094±0.345 0.00±0.00 1.978±0.369 1.94±9.21
3 bondrate 1.817±0.650 0.00±0.00 1.815±0.648 1.50±8.21
4 housing5 0.431±0.066 73.26±3.88 0.428±0.066 74.06±4.12
5 balance-scale 0.109±0.054 93.76±2.52 0.107±0.054 94.77±3.27
6 ERA 2.139±0.275 0.70±3.86 2.138±0.273 0.76±4.70
7 triazines10 5.200±0.761 0.00±0.00 5.186±0.760 0.00±0.0
8 machine10 2.753±1.213 0.00±0.00 2.780±1.271 1.00±3.89
9 car 0.101±0.047 96.28±1.88 0.096±0.032 97.77±1.89
10 ESL 1.028±0.437 31.58±30.19 2.780±0.667 33.60±31.00
V.CONCLUSION
208 | P a g e
We compared the MMAE and GMS values of our methods with OGO-ISP for ten data sets. Thus our proposed method only oversamples patterns which have highest confidence and surety. Experiments indicate that our method behaves better in terms of accuracy and sensitivity.
VI.ACKNOWLEDGMENT
I would like to express my special gratitude and thanks to Dr.K.Karunakaran, Principal and Secretary, Sri Ramakrishna College of Arts and Science, Coimbatore for providing excellent infrastructure and support for my Research work. I am highly indebted to my Research Guide Dr.Anna Saro Vijendran, Dean School of Computing, Sri Ramakrishna College of Arts and Science, Coimbatore for their guidance, constant supervision, support, effort, invaluably constructive criticism and friendly advice for my research work.
REFERENCES
[1] Shuo Wang, Member, and Xin Yao, ―Multiclass Imbalance Problems: Analysis and Potential Solutions‖,
IEEE Transactions On Systems, Man, And Cybernetics—Part B: Cybernetics, Vol. 42, No. 4, August 2012.
[2] Nitesh V. Chawla, Nathalie Japkowicz, Aleksander Ko lcz ―Special Issue on Learning from Imbalanced
Data Sets‖ Volume 6, Issue 1 - Page 1-6. 17
[3] Weiss, G.M. and Provost, F. (2001) The Effect of Class Distribution on Classifier Learning: An Empirical Study. Technical Report MLTR-43, Department of Computer Science, Rutgers University, New Brunswick, NJ, USA.
[4] Qiong, G., Cai, Z., Zhu, L. and Huang, B. (2008) Data Mining on Imbalanced Data Sets. International Conference on Advanced Computer Theory and Engineering, Phuket, 20-22 December, 1020-1024.
[5] Giang Hoang, Nguyen, Abdessalem Bouzerdoum and Son Lam Phung, ―Learning pattern classification task
with imbalanced data sets‖, Pattern recognition (pp. 193-208) www.intechopen.com.
[6] Bartosz Krawczyk, ―Learning from imbalanced data: open challenges and future directions‖ Prog Artif
Intell (2016) 5:221–232.
[7] Rushi Longadge, Snehlata S. Dongre, Latesh Malik ―Class Imbalance Problem in Data Mining: Review‖ International Journal of Computer Science and Network (IJCSN) Volume 2, Issue 1, February 2013 www.ijcsn.org ISSN 2277-5420
[8] Jaime S. Cardoso, Joaquim F. Pinto da Costa ,‖Learning to Classify Ordinal Data: The Data Replication
Method‖, Journal of Machine Learning Research 8 (2007) 1393-1429.
[9] Dembczy´nski, K., Kot lowski, W., S lowi´nski, R.: Ordinal Classification with Decision Rules. In: Mining Complex Data 2007. Volume 4944 of LNAI., Springer (2008) 169–181
209 | P a g e
[11] Paul Martin, Antoine Doucet and Frédéric Jurie,‖ Dating Color Images with Ordinal Classification‖, ICMR
’14, April 01 - 04 2014, Glasgow, United Kingdom, ACM.
[12] Phaiboon Jhonpita, Sukree Sinthupinyo and Thitivadee Chaiyawat, ―Ordinal Classification Method for the
Evaluation Of Thai Non-life Insurance Companies‖.
[13] Marıa Perez-Ortiz, Pedro Antonio Gutierrez, Cesar Hervas-Martınez and Xin Yao,‖Graph–Based
Approaches for Over-sampling in the Context of Ordinal Regression‖, IEEE Transactions on Knowledge and Data Engineering,27(5),p.no.1233-1245,ISSN:1041-4347,May 2015
[14] D. Dhanalakshmi and Anna Saro Vijendran,‖ An Analysis of Data Characteristics and Classifier
Performance in the Context of Ordinal Classification‖, International Journal of Data Mining and Emerging
Technologies, Volume 7, Number 1, May, 2017, pp. 36-42
[15] D. Dhanalakshmi and Anna Saro Vijendran,‖ A novel approach in oversampling algorithm for imbalanced
data sets in the context of ordinal classification‖, IEEE International Conference on Computational
Intelligence and Computing Research (ICCIC), 2016
[16] http://www.uco.es/groups/ayrna/GBOforOR
[17] Stefano Baccianella, Andrea Esuli and Fabrizio Sebastiani, ―Evaluation Measures for Ordinal Regression‖, Ninth International Conference on Intelligent Systems Design and Applications,2009.