Correlations and ridge in
p
Pb collisions in the LHCb Experiment
Mariusz Witek1,aon behalf of the LHCb Collaboration
1Institute of Nuclear Physics PAS, Cracow, Poland
Abstract.The LHCb experiment, besides its main programme concerning flavour physics performs also very well as a general purpose forward detector, covering the pseudo-rapidity range from 2.0 to 5.0. Exploiting the experiment’s unique geometry, the LHCb collaboration is pursuing a rich programme of forward QCD measurements. In partic-ular two-particle angpartic-ular correlations are studied in proton-lead collisions at a nucleon-nucleon centre-of-mass energy of √sNN=5 TeV, with data collected by the LHCb de-tector at the LHC in 2013. The analysis is based on data recorded in two opposing beam configurations, in which either the direction of the proton or that of the lead remnants is analysed. This is the first measurement of a long-range correlation on the near side in proton-lead collisions in the forward region. It extends previous observations in the central region.
1 Introduction
The two-particle angular correlations are one of the tools to study the dynamics of multi-particle production in QCD and to probe collective effects arising in the dense environment of a high-energy collision. They are usually described by two-dimensional (Δη,Δφ)-correlation functions measured in the laboratory system. The two ranges can be distinguished, the short-range (|Δη|2) and long-range (|Δη| 2) effects. On the near-side (|Δφ| ≈ 0) a short-range “jet-peak" at Δη ≈ 0 is the dominant structure. It is caused by the fact that in the fragmentation process, the final-state particles are collimated around the initial parton. To balance the momentum, the peak is accompanied by a long-range structure on the away side (|Δφ| ≈ π) caused by particles that fly opposite in azimuthal angle. The near side long range correlations in the form of the so called ridge effect have been seen at the Relativistic Heavy-Ion Collider (RHIC)in p+Au and Au+Au collisions [1, 2]. Surprisingly, it turned out that in the high multiplicity class of proton-proton interactions the ridge has been also found by CMS [3]. Later, the ridge effect was reported forp+Pb collisions by Alice [4], Atlas [5] and CMS [6]. The theoretical interpretation of the mechanism responsible for the ridge in small colliding system like proton-proton is still under discussion. Various models have been proposed including colour reconnection and gluon saturation in the framework of a colour-glass condensate [7–10] or the hydrodynamic evolution of a high density partonic medium [11], multiparton interactions [12–14], jet-medium interactions [15, 16], and collective effects [17–21] induced by the formation and expansion
of a high-density system likely produced in these collisions. The instrumentation of the LHCb single-arm spectrometer covers a unique rapidity range 2< η < 5 in the laboratory frame [22, 23]. The measurements are based on proton-lead collisions that are dominated by single interactions (98%). The two beam configurations provided by LHC, p+Pb and Pb+p which differs by the direction of proton and ion beams can be analysed in the forward region. The simple trigger was configured to accept events with at least one reconstructed track in the vertex detector for non-empty beam bunch crossing. The events were required to have exactly one reconstructed primary vertex with at least five tracks. The tracks were selected to originate directly from interaction point based on its impact parameter with respect to primary vertex. The effect of fake tracks after track quality cuts imposed and the track reconstruction efficiency is taken into account as a weight assigned to each track. The analysis is based on a subset of the total data set recorded during the 2013 pPb running period, 0.46 nb−1 in thep+Pb configuration and 0.30 nb−1 for the Pb+pconfiguration. The rapidity range in the nucleon-nucleon centre-of-mass frame is 1.5 < y <4.4 for p+Pb and−5.4 < y < −2.5 for Pb+p. The results of the analysis were published in Ref. [24].
2 Analysis method
The particles are divided into three subsets according to theirpT: 0.15−1.0 GeV/c, 1.0−2.0 GeV/c
and 2.0−3.0 GeV/c, and analysed separately. The analysis method follows the standard approach formulated e.g. in Ref. [25]. All particles in a given subset are taken as a trigger particle one by one. All other particles are combined with the trigger particle in a pair. Two correlation functions are constructed. The signal oneS(Δη,Δφ) for pairs from the same event and B(Δη,Δφ) for pairs combined from mixed events. The correlation function reads:
1
Ntrig
d2Npair
dΔηdΔφ =
S(Δη,Δφ)
B(Δη,Δφ)×B(0,0), (1)
whereNpair is the number of particle pairs found in a (Δη,Δφ) bin andNtrig is the number of
trig-ger particles andB(0,0) is the normalization factor. By construction, the effects due to the detector occupancy, acceptance and material are accounted for by dividing the signal by the background dis-tribution, where the latter is normalised to unity around the origin.
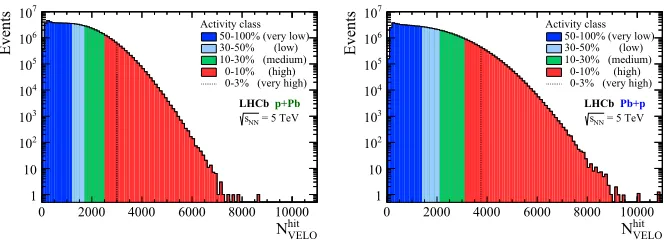
Since the two-particle correlations are strongly dependent on the total number of particles pro-duced in collision, the analysis is performed for various classes of event activity. Thep+Pb and Pb+p minimum bias samples each consist of about 1.1×10⁸events which are randomly selected from about
10 times larger full sample. The high-multiplicity samples contain all available events with at least 2200 hits in the vertex detector and amount to about 1.1×10⁸events inp+Pb and 1.3×10⁸ events
hit VELO N
0 2000 4000 6000 8000 10000
Events
1 10
2
10
3
10
4
10
5
10
6
10
7
10
Activity class 50-100% (very low) 30-50% (low) 10-30% (medium) 0-10% (high) 0-3% (very high)
p+Pb
LHCb = 5 TeV
NN
s
hit VELO N
0 2000 4000 6000 8000 10000
Events
1 10
2
10
3
10
4
10
5
10
6
10
7
10
Activity class 50-100% (very low) 30-50% (low) 10-30% (medium) 0-10% (high) 0-3% (very high)
Pb+p
LHCb = 5 TeV
NN
s
Figure 1. Hit-multiplicity distribution in the vertex detector for selected events of the minimum-bias samples in the (left) p+Pb and (right) Pb+pconfigurations. The activity classes are defined as fractions of the full distribution, as indicated by colours (shades). The 0−3% class is a sub-sample of the 0−10% class. The figures were taken from Ref. [24].
Table 1.Common absolute activity bins for thep+Pb and Pb+psamples. The activity ofp+Pb events is scaled to match the same activity ranges of Pb+pevents, as explained in the text. For illustration purposes the average number,NchMC, of prompt charged particles withp>2 GeV/c,pT>0.15 GeV/cand 2.0< η <4.9 is listed for
events simulated with the Hijingevent generator.
Common absolute Nhit
VELO-range p+Pb Pb+p
activity bin in Pb+pscale NchMC NchMC
Bin I 2200−2400 62.8±6.6 64.4
Bin II 2400−2600 68.4±7.1 67.0
Bin III 2600−2800 73.7±7.6 76.4
Bin IV 2800−3000 79.2±7.9 82.4
Bin V 3000−3500 86.7±8.2 92.9
3 Results
The correlation for particles with 1 < pT < 2 GeV/cis illustrated in Fig. 2 forp+Pb configuration
and in Fig. 3 for Pb+pconfiguration. The near-side peak aroundΔη = Δφ =0 is truncated in the histograms. For low activity events only the jet-peak is observed while for highest activity class a clear ridge effect emerges. It is more pronounced in the case of Pb+psample.
The detailed study of the evolution of the long-range correlations on the near and away sides is usually performed in one dimensional projections integrated overΔη:
Y(Δφ)≡ 1
Ntrig
dNpair
dΔφ = 1
Δηb−Δηa
Δηb
Δηa
1
Ntrig
d2Npair
dΔηdΔφdΔη. (2)
The jet-peak area is excluded by averaging the two-dimensional yield over the interval fromΔηa=2.0 toΔηb =2.9. The non interesting correlations in the form of flat pedestals in the yield are subtracted using the zero-yield-at-minimum (ZYAM) method [26]. The subtracted one-dimensional yields for the p+Pb (full circles) and Pb+p (open circles) data samples are shown in Fig. 4 for all activity classes andpT intervals. It can be seen that the correlation strength increases with event activity on
the near side, but decreases towards higherpTwhere fewer particles are found. Since more particles
η Δ -2 0 2 φ Δ -1 0 1 2 3 4 φΔ d ηΔ d N 2 d trig N 1 0.35 0.4 0.45
= 5 TeV NN s p+Pb LHCb
Event class 50-100% < 2.0 GeV/c T 1.0 < p
(a) η Δ -2 0 2 φ Δ -1 0 1 2 3 4 φΔ d ηΔ d N 2 d trig N 1 1.35 1.4 1.45
= 5 TeV NN s p+Pb LHCb
Event class 0-3% < 2.0 GeV/c T 1.0 < p
(b)
Figure 2.Two-particle correlation functions for events recorded in thep+Pb configuration, showing the (a) low and (b) high event-activity classes. The figures were taken from Ref. [24].
η Δ -2 0 2 φ Δ -1 0 1 2 3 4 φΔ d ηΔ d N 2 d trig N 1 0.4 0.45 0.5
= 5 TeV NN s
Pb+p
LHCb
Event class 50-100% < 2.0 GeV/c T 1.0 < p
(a) η Δ -2 0 2 φ Δ -1 0 1 2 3 4 φΔ d ηΔ d N 2 d trig N 1 2.05 2.1 2.15 2.2
= 5 TeV NN s
Pb+p
LHCb
Event class 0-3% < 2.0 GeV/c T 1.0 < p
(b)
Figure 3.Two-particle correlation functions for events recorded in the Pb+pconfiguration, showing the (a) low and (b) high event-activity classes. The figures were taken from Ref. [24].
larger offset is observed, as indicated by the ZYAM constants. In the highest-activity class, 0−3%, the near-side ridge is strongly pronounced in allpTintervals for both Pb+pandp+Pb samples. The
ridge effect decreases with decreasing event activity and disappears for the activity class 30−50%. Forp+Pb the near-side peak is significantly lower.
Similar ZYAM-subtracted yields for common bins of absolute activity are presented in Fig. 5 for 1 < pT <2 GeV/c. The results for the p+Pb and Pb+psamples are compared in five event classes
which probe identical activities in the range of 2.0< η <4.9. The measured hit-multiplicities of the
p+Pb sample are scaled to agree with the hit-multiplicities of the Pb+psample. It turns out that the observed long-range correlations become compatible forp+Pb and Pb+p.
4 Summary
The samples ofpPb collisions at √sNN =5 TeV collected by the LHCb experiment were used to study
φ
Δ Δφ Δφ Δφ
< 1.0 GeV/c
T
0.15 < p 1.0 < pT< 2.0 GeV/c 2.0 < pT< 3.0 GeV/c
50-100% 30-50% 10-30% 0-10% 0-3% ZYAM )-C φΔ Y( 0.00 0.05 0.10
0.15 =1.61 (p+Pb) ZYAM C =2.06 (Pb+p) ZYAM C =0.32 (p+Pb) ZYAM C =0.37 (Pb+p) ZYAM C
φ
Δ
LHCb= 5 TeV
NN s data p+Pb data Pb+p ZYAM )-C φΔ Y( 0.00 0.05 0.10 0.15 =2.83 (p+Pb) ZYAM C =4.01 (Pb+p) ZYAM C =0.56 (p+Pb) ZYAM C =0.70 (Pb+p) ZYAM C =0.18 (p+Pb) ZYAM C =0.21 (Pb+p) ZYAM C ZYAM )-C φΔ Y( 0.00 0.05 0.10 0.15 =3.74 (p+Pb) ZYAM C =5.78 (Pb+p) ZYAM C =0.81 (p+Pb) ZYAM C =1.14 (Pb+p) ZYAM C =0.23 (p+Pb) ZYAM C =0.26 (Pb+p) ZYAM C ZYAM )-C φΔ Y( 0.00 0.05 0.10
0.15 =5.03 (p+Pb) ZYAM C =7.81 (Pb+p) ZYAM C =1.19 (p+Pb) ZYAM C =1.78 (Pb+p) ZYAM C =0.29 (p+Pb) ZYAM C =0.36 (Pb+p) ZYAM C φ Δ
0 2 4
ZYAM )-C φΔ Y( 0.00 0.05 0.10 0.15 =5.67 (p+Pb) ZYAM C =8.63 (Pb+p) ZYAM C φ Δ
0 2 4
=1.39 (p+Pb) ZYAM C =2.07 (Pb+p) ZYAM C φ Δ
0 2 4
=0.32 (p+Pb) ZYAM C =0.40 (Pb+p) ZYAM C
Figure 4.One-dimensional correlation yield as a function ofΔφobtained from the ZYAM-method by averaging over 2.0<Δη <2.9. The figure was taken from Ref. [24].
φ Δ
0 2 4
ZYAM )-C φΔ Y ( 0.00 0.05 0.10 0.15 φ Δ
0 2 4
Activity bin I
=1.21 (p+Pb) ZYAM C =1.04 (Pb+p) ZYAM C data p+Pb data Pb+p
= 5 TeV
NN
s LHCb
φ Δ
0 2 4
Activity bin II
=1.32 (p+Pb) ZYAM C =1.16 (Pb+p) ZYAM C
< 2.0 GeV/c
T
1.0 < p
φ Δ
0 2 4
Activity bin III
=1.42 (p+Pb) ZYAM C =1.27 (Pb+p) ZYAM C φ Δ
0 2 4
Activity bin IV
=1.51 (p+Pb) ZYAM C =1.38 (Pb+p) ZYAM C φ Δ
0 2 4
Activity bin V
=1.64 (p+Pb) ZYAM C =1.54 (Pb+p) ZYAM C
previous LHC measurements. The analysis was performed separately for thep+Pb and Pb+pbeam configurations probing the rapidities in the nucleon-nucleon centre-of-mass frame of 1.5 < y < 4.4
and−5.4< y <−2.5, respectively. The analysis was performed in variouspTranges and for different
event activity classes. In high event activity class, a long-range correlation on the near side (the ridge) is observed in both configurations. The near-side ridge is most pronounced in the range 1< pT <
2 GeV/c. For identical absolute activity ranges in the p+Pb and Pb+pconfigurations the observed long-range correlations are compatible.
Acknowledgements
I would like to express my gratitude to the National Science Centre NCN in Poland, for financial support under the contract no. 2013/11/B/ST2/03829.
References
[1] B. Abelev et al., Phys. Rev.C80, 064912 (2009). [2] B. Alver et al., Phys. Rev. Lett.104, 062301 (2010).
[3] Khachatryan, V., Sirunyan, A.M. et al., CMS collaboration, J. High Energ. Phys. (2010) 91. [4] B. Abelev et al., ALICE Collaboration, Phys. Lett.B719, 29 (2013)
[5] G. Aad et al., ATLAS Collaboration, Phys. Rev. Lett.110, 182302 (2013) [6] S. Chatrchyan et al., CMS Collaboration, Phys. Lett.B718, 795 (2013) [7] Dusling, Kevin and Venugopalan, Raju, Phys.Rev.D87, 051502 (2013) [8] Dusling, Kevin and Venugopalan, Raju, Phys.Rev.D87, 054014 (2013) [9] Dusling, Kevin and Venugopalan, Raju, Phys.Rev.D87, 094034 (2013)
[10] Kovchegov, Yuri V. and Wertepny, Douglas E., Nucl.Phys.A906, 50-83 (2013)
[11] Bzdak, Adam and Schenke, Bjoern and Tribedy, Prithwish and Venugopalan, Raju, Phys.Rev.
C87, 064906 (2013)
[12] Alderweireldt, Sara and Van Mechelen, Pierre, Proceedings of the 3rd International Workshop on Multiple Partonic Interactions at the LHC (MPI@LHC 2011), 33-40 (2012)
[13] Strikman, Mark, Acta Phys.Polon.B42, 2607-2630 (2011)
[14] Ryskin, M.G. and Martin, A.D. and Khoze, V.A., J.Phys.G38, 085006 (2011) [15] Hwa, Rudolph C. and Yang, C.B., Phys.Rev.C83, 024911 (2011)
[16] Wong, Cheuk-Yin, Phys.Rev.C84, 024901 (2011)
[17] Avsar, Emil and Flensburg, Christoffer and Hatta Yoshitaka and Ollitrault, Jean-Yves and Ueda, Takahiro, Phys.Lett.,B702,394-397 (2011)
[18] Werner, K. and Karpenko, Iu. and Pierog, T., Phys.Rev.Lett.106, 122004 (2011) [19] Bozek, Piotr, Phys. Rev.C85, 014911 (2012)
[20] Bozek, Piotr and Broniowski, Wojciech, Phys.Lett.B718,1557-1561 (2013) [21] Shuryak, Edward and Zahed, Ismail, Phys.Rev.C88, 044915 (2013) [22] Alves Jr., A. A. and others, LHCb collaboration, JINST3, S08005 (2008) [23] Aaij, R. and others, LHCb collaboration, Int. J. Mod. Phys.A30, 1530022 (2015) [24] Aaij, R. and others, LHCb collaboration, Phys. Lett.B762473-483 (2016) [25] Abelev, Betty and others, ALICE collaboration, Phys.Lett.B719, 29-41 (2013)