Hardware Implementation of E-Nose in Arm-7 Board
through Neural Networks
Moorthilingam.J
PG Scholar VLSI DesignK.S.R. College of Engineering Tiruchengode – 637 215
Bagavathi C
Assistant Professor Department of ECE K.S.R. College of EngineeringTiruchengode – 637 215
ABSTRACT
In the fast pacing world, it has becomes essential to so many gadgets that humans should take their effort to understand and use them. One such device is an Electronic Nose (E-Nose). There is still a long voyage ahead before artificial Electronic nose is developed completely. This work is a commendation for refining and enhancing current detection capabilities. Gas sensors used in electronic noses are based on broad selectivity profiles, mimicking the responses of olfactory receptors in the biological olfactory system. To identify a particular odour, the design is should be able to detect the odour which sufficient confidence and hence saving the humans for hazardous situation and false alarms.
General Terms
Neural Networks, Chemical sensors
Keywords
Gas sensors, E nose, ARM 7 processor, Analog to digital converters
1.
INTRODUCTION
An electronic nose (E-nose) is a device that is designed to mimic the function of the biological nose. The technological advancements in appreciating and realizing artificial human olfactory senses make it more feasible to quantify odours [1]. E-Nose uses an array of sensors to detect and discriminate complex odours. The sensor array consists of a group of chemical gas sensors which are non-specific and they respond to odours. The detection and identification of a particular odorant is based on a combined response pattern from all sensors rather than a response pattern from a particular sensor. In addition to the sensor array, the response pattern recognition algorithm is another key component in an E-nose system that determines how well the E-nose identifies Volatile Organic Compounds.
The electronic nose instrumentation was developed in the early 1980 [2]. Since then, the analysis of volatile compounds has been of increasing interest due to their applications. The short comings of Gas chromatography had paved way for the development of electronic nose. The realization of the electronic nose was made possible by using the human olfactory system as a paradigm [3]. The human olfactory system consists of a slim region of thin epithelium in the upper portion of nose well known for its sensitivity in the identifying the odour. Following the anatomy of biological nose, E-nose is developed to include an array of conducting polymer sensors and neural networks [4]. The sensors are transducers which convert the odour to electrical signals which are being processed by the neural network part to identify the odour.
Figure 1: Block diagram of E-Nose
The E-Nose design consists of five parts as shown in figure 1. Preprocessing can be used to recompense for sensor drift, Normalize the sensor data, and compress the sensor response. Feature extraction reduces the dimensionality of the measurement space and extracts information for classification purposes. The classification module assigns a class label to an unknown sample based on the information contained in the entire data set or on previously recorded data. The final decision making block uses application specific information to modify the classifier assignment and to enhance the accuracy of the system.
Electronic Nose is a smart instrument that is designed to detect and discriminate among complex odours using an array of sensors. The array of sensors consists of a number of broadly tuned (non-specific) sensors that are treated with a variety of odour-sensitive biological or chemical materials. An odour stimulus generates a characteristic fingerprint from this array of sensors. Section II deals with sensors. Section III deals with analog to digital converter and section IV deals with spiking neural networks. Section V deals with results and discussion.
2.
SENSORS
Sensors are small devices made with chemical sensitivity for volatile compounds. The most common types of sensors used in Electronic Noses are conductivity sensors, optical sensors and piezoelectric sensors [5]. The sensors used in this work are conductivity sensors and the background discussion here is limited to this type of sensor only. When a chemical is detected with a profound odour, the electrical signal from the sensor suffers a change. This can be used as a landmark for identifying the chemical. Each gas with odour can be categorized by working on the output signals of the sensors. Each sensor can detect few of the chemical compounds with odour. It might require a few sensors to set up a complete E-nose system. In this work, three sensors (MQ5, MQ6 and MQ7) are employed. The structure of MQ5 and MQ6 sensor are similar as shown in figure 2. Each sensor will have several working conditions to configure the environment. Standard working conditions such as temperature, humidity, oxygen concentration, sensing resistance, chemical composition, and concentration slope rate are the parameters which
Sensor Array
Preprocessing Feature Extraction
Classification Decision
distinguishes these sensors. The principle behind the working of the sensor is that the resistance of the material in the sensor changes its resistance to varying concentrations of chemicals which are volatile and is in contact with the sensor surface [5].
Figure 2: Structure of MQ5 and MQ6 sensor
Figure 3: Structure of MQ7 sensor
The sensors are mainly for detecting gases and convert them into electrical signals in the form of concentration. As the output signal of the sensor is large enough, the interface circuit uses only a voltage follower as a buffer between the sensor output and the A/D converter, which makes the system less sensitive to external interferences.
3.
SUCCESSIVE APPROXIMATION
ADC CIRCUIT
[image:2.595.318.541.447.648.2]After successfully converting chemical odorants into electrical signals, the processing should be performed. For processing, the signal has to converted to its digital form as processing will be a lot simpler and accurate in digital form. For converting into digital signal, Successive Approximation ADC circuit because it is suitable for working with the terms of Neural Networks. A successive-approximation converter, Figure 4, is composed of a digital-to-analog converter (DAC), a single comparator, and some control logic and registers.
Figure 4: Successive Approximation ADC Circuit
4.
SPIKING NEURAL NETWORK
Artificial neural network is a mathematical tool used to identify some of the specific classification of the sub systems from the main complex system. During analysis of the input and output signals spikes are used to classify the pre-data of the source, hence this is called spike neural network system. The spiking neurons can be used to store spacio-temporal information in communication [6]. During training, the weight of the synapse is modified according to the timing difference between the pre-synaptic spike and the post-synaptic spike [7]. When the post-synaptic spike occurs immediately after the pre-synaptic spike, the synaptic weight is increased [long-term potentiation (LTP)] [8]. By contrast, the synaptic weight is decreased [long-term depression (LTD)] when the post-synaptic spike occurs immediately before the pre-data (STDP) [9]. Recent studies have shown that the synaptic weight plasticity depends not only on the action potential timing but also on the post-synaptic depolarization [10]. Furthermore, LTP dominates at high firing frequencies. This mechanism can be realized even for synapses that have only two steady states (potentiated or depressed), and is widely implemented in the spike-based neuromorphic learning system [11]. Although most SNN circuits learn the patterns of the firing rate, this type of learning suffers from a tradeoff between accuracy and speed. Spiking neural networks have wide applications in data modeling [12], delay prediction [13], classification problems [14], pattern classification [15] and in many more data analysis crisis [16].
5.
RESULTS AND DISCUSSION
In Spiking Neuron Networks (SNNs), the presence and timing of individual spikes is considered as the means of communication and neural computation. This compares with traditional neuron models where analog values are considered, representing the rate at which spikes are fired.
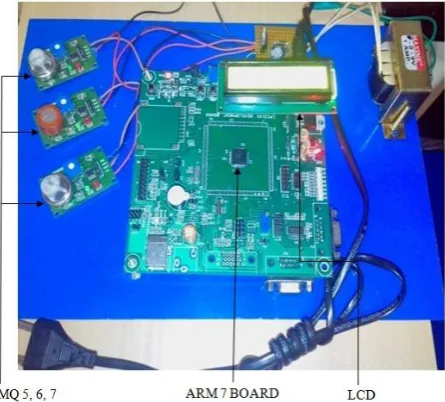
Figure 5: Hardware Implemented for E-Nose
[image:2.595.53.273.530.689.2]parts are both functions available in the ARM 7 processor. Before the programs are interfaced into the ARM processor, E-nose will show just normal readings are shown in the LCD screen.
The data collection was done for detecting different gases by measuring the readings of concentration of the gas during a span of 6 days. These data will be used to train the spiking neural network for threshold of the device. When the concentration reaches a particular value, the E-nose should detect the reaction as a gas with enough concentration to cause sufficient damage. The gases under consideration are Carbon dioxide CO2, Carbon monoxide CO and Nitrous oxide
[image:3.595.320.537.205.318.2]NO. For analysis, the E-Nose was tested in smoke for the concentration of these gases.
Figure 6: Concentration of carbon dioxide for 6 days
[image:3.595.53.284.237.368.2]The concentration of carbon dioxide was found to be approximately 180 to 250 ppm. It can be noted that the readings from sensor 1 is found to lower than that of other two sensors for all the days of measurement.
Figure 7: Concentration of carbon monoxide for 6 days
The concentration of carbon monoxide was found to be approximately 200 to 250 ppm.
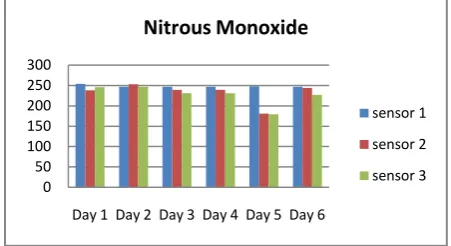
Figure 8: Concentration of nitrous monoxide for 6 days
The concentration of nitrous monoxide was found to be approximately 230 to 250 ppm. It can be noted that the readings on day 5 have varied quite a lot from the readings on other days. For improved accuracy, the readings on all days except day 5 can be taken for fixing the threshold.
[image:3.595.320.536.350.483.2]The results of the algorithm are shown in figure 8 and figure 9. The result can be interpreted as the display shows that when the levels of gases crosses 100 ppm, the result analysis will display a warning stating the possible allergy due to gas which is supposed to be detected.
[image:3.595.54.280.448.565.2]Figure 9: Result from the hardware when smoke is the input
Figure 10: Result from the hardware when thinner is the input
6.
APPLICATIONS
E-nose after created, then by the doctor’s consultation gases such as the carbon dioxide, carbon mono oxide, nitrous oxide are gases are harmful to asthmas patients because the some of the asthma patients are doesn’t know the dangerous gas smell at the surroundings [17]. For this main purpose only E-Nose was developed. CO2 gases will be come from the motor cycle,
CO gas from the factories, car A/C. Nitrous oxide (NO) gas from the vehicle, all these gases are tested by the ENOSE the details are given below.
Ethylene oxide (EtO) is a gas capable of killing micro organisms by the alkylation of the sulphur-containing based on: proteins. As it is a highly inflammable gas, haemodiain. After undergoing long-term dialysis were studied in order to of sensitization to EtO and the importance of atopy evaluate the importance of ethylene oxide (EtO) in as a risk factor for sensitization to EtO in causing allergic reactions during dialysis. The use of EtO during dialysis can give rise to range of clinical features including itching, rhinitis, bronchial asthma, urticaria, angioedema, extremely rare severe reaction. Enormous amounts of hazardous waste (nuclear, chemical, and mixed wastes) were generated by more than 40 years of weapons production in the U.S. Department of Energy weapon complex. The Pacific Northwest National Laboratory 0
50 100 150 200 250 300
Day 1 Day 2 Day 3 Day 4 Day 5 Day 6
Carbon Dioxide
Sensor 1
Sensor 2
Sensor 3
0 100 200 300
Day 1 Day 2 Day 3 Day 4 Day 5 Day 6
Carbon Monoxide
sensor 1
sensor 2
sensor 3
0 50 100 150 200 250 300
Day 1 Day 2 Day 3 Day 4 Day 5 Day 6
Nitrous Monoxide
sensor 1
sensor 2
[image:3.595.53.279.626.749.2]is exploring the technologies required to perform environmental restoration and waste management in a cost effective manner. This effort includes the development of portable, inexpensive systems capable of real-time identification of contaminants in the field. Electronic noses fit this category.
Environmental applications of electronic noses include analysis of fuel mixtures, detection of oil leaks, testing ground water for odours, and identification of household odours. Potential applications include identification of toxic wastes, air quality monitoring, and monitoring factory emissions [5]. Because the sense of smell is an important sense to the physician, an electronic nose has applicability as a diagnostic tool. An electronic nose can examine odours from the body (e.g., breath, wounds, body fluids, etc.) and identify possible problems. Odours in the breath can be indicative of gastrointestinal problems, sinus problems, infections, diabetes, and liver problems. Infected wounds and tissues emit distinctive odours that can be detected by an electronic nose. Odours coming from body fluids can indicate liver and bladder problems. Currently, an electronic nose for examining wound infections is being tested at South Manchester University Hospital.
A more futuristic application of electronic noses has been recently proposed for telesurgery [18]. While the inclusion of visual, aural, and tactile senses into telepresent systems is widespread, the sense of smell has been largely ignored. An electronic nose will potentially be a key component in an olfactory input to telepresent virtual reality systems including telesurgery. The electronic nose would identify odours in the remote surgical environment. These identified odours would then be electronically transmitted to another site where an odour generation system would recreate them.
Currently, the biggest market for electronic noses is the food industry. Applications of electronic noses in the food industry include quality assessment in food production, inspection of food quality by odour [19], control of food cooking processes, inspection of fish, monitoring the fermentation process, checking rancidity of mayonnaise, verifying if orange juice is natural, monitoring food and beverage odours [20], grading whiskey, inspection of beverage containers, checking plastic wrap for containment of onion odour, flavour analysis [21] and automated flavour control to name a few. In some instances electronic noses can be used to augment or replace panels of human experts. In other cases, electronic noses can be used to reduce the amount of analytical chemistry that is performed in food production especially when qualitative results will do. Patterns or fingerprints from known odours are used to construct a database and train a pattern recognition system so that unknown odours can subsequently be classified and/or identified. E-Noses can be used to detect diseases such as diabetics through odour [22].
An electronic nose system primarily consists of four functional blocks, viz., Odour Handling and Delivery System, Sensors and Interface Electronics, Signal Processing and Intelligent Pattern Analysis and Recognition. The array of sensors is exposed to volatile odour vapour through suitable odour handling and delivery system that ensures constant exposure rate to each of the sensors. The response signals of sensor array are conditioned and processed through suitable circuitry and fed to an intelligent pattern recognition engine for classification, analysis and declaration.
The most complicated parts of electronic olfaction process are odour capture and associated sensor technology. Any sensor
that responds reversibly to chemicals in gas or vapour phase, has the potential to participate in an array of sensor designed as electronic nose. For black manufactured tea, an array of Metal Oxide Semiconductor (MoS) sensors has been used for assessment of volatiles.
7.
CONCLUSION
This work has found a way to implement the architecture of electronic nose of ARM 7 processor. The hardware designed was found to work efficiently. This work can be extended to improve the portability and compactness of the device. the simulation results are successfully shows the spiking graph for the allergic gases.
8.
REFERENCES
[1] Shyam Gopal Sharma, “Implementation of Artificial Neural Network for Odor Identification using E-Nose”, National Conference on Computational Instrumentation, CSIO, 2010.
[2] J. W. Gardner and P. Barlett, “A brief history of electronic noses,” Sensors and Actuators B, Vol. 18, pp. 211–220, 1994.
[3] Pascal Boilot, Evor L. Hines, Julian W. Gardn Richard Pitt, Spencer John, Joanne Mitchell, and David W. Morgan, “Classification of Bacteria Responsible For ENT for ENT and EYE and EYE Infections Using the Cyranose System” IEEE Sensors Journal, Vol. 2, No. 3, 2002.
[4] Dongliang Huang and Henry Leung, “Simultaneous Classification and Concentration Estimation for Electronic Nose”, IEEE Sensors Journal, Vol. 7, No. 5, pp. 825-834, 2007.
[5] Vincenzo Di Lecce, Jessica Uva, “A Wireless Electronic Nose for Emergency Indoor Monitoring”, Fifth International Conference on Sensor Technologies and Applications, pp. 274 – 280, 2011.
[6] Wolfgang Maass “Networks of Spiking Neurons: The Third Generation of Neural Network Models”, Neural Networks, Vol.10, No. 9, pp 1659 – 1671, 1997.
[7] Hung-Yi Hsieh and Kea-Tiong, “VLSI Implementation of a Bio-Inspired Olfactory spiking Neural Network”, IEEE Transactions on Neural Networks, Vol. 14, No. 5, 2003. [8] Srinjoy Mitra, Stefano Fusi, and Giacomo Indiveri,
“Real-Time Classification of Complex Patterns Using Spike – Based Learning in Neuromorphic VLSI”, IEEE Transactions on Biomedical Circuits and Systems, Vol.3, No.1, 2009.
[9] Adria Btsill-i-Petit and Alan F. Murray, “Synchrony Detection and Amplification by Silicon Neurons with STDP Synapses” IEEE Transactions on Neural Networks, Vol. 15, No. 5, 2004
[10] Elisabetta Chicca, Davide Badoni, Vittorio Dante, Massimo D’Andrea Giovanni, Gaetano Salina, Luciana Carota, “A VLSI Recurrent Network of Integrate-and-Fire Neurons Connected by Plastic Synapses With Long-Term Memory” IEEE Transactions on Neural Networks, Vol. 14, No. 5, 2003.
On Circuits And Systems—I: Regular Papers, Vol. 4, No. 1, 2007.
[12] J. Liu et al, “Evolving Spiking Neural Networks and Neurogenetic Systems for Spatio- and Spectro- Temporal Data Modelling and Pattern Recognition”, IEEE WCCI, LCNS 7311, pp 234 – 260, 2012.
[13] Qing sun, Francois Schwartz, Jacques Micheal Yannic Herve, and Renzo Dalmolin, “Implementation Study of an Analog Spiking Neural Network for Assisting Cardiac Delay Prediction in a Cardiac Delay Prediction in a Cardiac Resynchronization Therapy Device”, IEEE Transactions on Neural Networks, Vol. 22, No. 6, 2011. [14] John J. Wade, Liam J. McDaid, Jose A. Santos, and
Heather M. Sayers, “SWAT: A Spiking Neural Network Training Algorithm for Classification Problems” IEEE Transactions on Neural Networks, Vol. 21, No. 11, 2010 [15] S. Mitra, G. Indiveri and S. Fusi, “Learning to classify
complex patterns using a VLSI network of spiking neurons”, Advances in Neural Information Processing Systems 20, Cambridge (MA), MIT Press, pp 1009 – 1016, 2008.
[16] Lyle N. Long, “An adaptive Spiking Neural Network with Hebbian Learning”, IEEE Symposium Series on Computational Intelligence, pp 1 – 7, 2011.
[17] Montuschi, P., Santonico, M., Mondino, C., Pennazza, G., Mantini, G., Martinelli, E., Capuano, R., Ciabattoni, G., Paolesse, R., Di Natale, C., Barnes, P.J. & D-Amico, A., “Diagnostic Performance of an Electronic Nose, Fractional Exhaled Nitric Oxide, and Lung Function Testing in Asthma”, Chest, Vol. 137, No.4, pp. 790-796, 2010.
[18] Alphus Dan Wilson, “Future Applications of Electronic-Nose Technologies in Healthcare and Biomedicine”, www.intechopen.com
[19] Md Salim S. N., Md Shakaff A. Y., Ahamd M. N., Adom A. H., Husin Z., “Development of electronic nose for fruits ripeness determination”, ICST, 515-518, 2005.
[20] Cheli, F., Campagnoli, A., Pinotti, L., Savoini, G. & Dell’Orto, “Electronic Nose for Determination of Aflatoxins in Maize”, Biotechnology, Agronomy, Society and Environment, Vol.13, No.1, pp. 39-43, 2009. [21] Zhu L, Seburg R.A, Tsai E, Puech S & Mifsud JC,
“Flavor Analysis in a Pharmaceutical Oral Solution Formulation Using an Electronic Nose” Journal of Pharmaceutical and Biomedical Analysis, Vol. 34, No.3, pp. 453 – 461, 2004.