Munich Personal RePEc Archive
The importance of developing future
contracts: a case study of Iran
Agricultural Commodity Exchanges
Hosseini-Yekani, Seyed-Ali and Bakhshoodeh, Mohammad
December 2006
ERF
1 3
TH
A
NNUAL
C
ONFERENCE
OI L:
I TS I MPACT ON THE GLOBAL ECONOMY
Conference Paper
►
T
HE
I
MPORTANCE OF
D
EVELOPI NG
F
UTURE
C
ONTRACTS
:
A
C
ASE
S
TUDY OF
I
RAN
A
GRI CULTURAL
C
OMMODI TY
E
XCHANGES
A
LIH
OSSEI NIY
EKANIPaper for presentation at the 13thannual conference Economic Research Forum (ERF),
Kuwait, 16-18 December, 2006
The importance of developing future contracts: a case study of Iran
Agricultural Commodity Exchanges
Ali Hosseini Yekani and Mohammad Bakhshoodeh
Respectively, PhD Student and Associate Professor, Department of Agricultural Economics, College of Agriculture, University of Shiraz, Iran.
Abstract:
In addition to interest in establishing local exchanges, there are growing interests in
countries without futures markets to use established contracts on existing world
exchanges. Cash contracts are dominant in Iran Agricultural Commodity Exchange
(IACE), established recently in 2004 but cannot play relevant role of hedge for producers
in agricultural markets. This paper attempts to find out either existing future contracts in
the exchanges of rest of the world or establishing new future contracts are more relevant
for the IACE. In this regard, we utilized the basis risk analysis to study whether or not
local physical cash markets in Iran have a strong price relationship to existing futures
contracts. The usefulness of making future contracts available at the IACE operators is
also investigated using simulation of futures price in a Monte Carlo approach framework.
The results showed that the usefulness of the particular foreign future contract (such as
Tokyo Grain Exchange) in hedging domestic cash price risks is low. Either, there could
be inefficiencies related to the transmission of information to the Iran agricultural
markets. Furthermore, using effective risk management tools are needed for such future
contracts in the IACE.
1. Introduction
The price volatility of agricultural commodities is a major source of risk for producers
and agribusiness firms. In recent years, there has been an explosion in establishing
commodity exchanges and development of new contracts on existing exchanges for
hedging producers from market risks. In addition to interest in establishing local
exchanges, there is growing interest in countries that have no futures markets to use
established contracts on existing world exchanges. In the agricultural commodity area,
countries that have a strong price relationship between a particular commodity and the
corresponding futures contract use existing contracts extensively for risk management
purposes (Figiel et al., 1997). A good example for this is the use of the Chicago Board of
Trade (CBOT) soybean futures market by Argentine and Brazilian soybean exporters.
The US, Brazil and Argentina all are extensive participants in the world soybean export
markets. This creates a linkage between prices in the three countries and this linkage
creates hedging possibilities for South American exporters.
Iran Agricultural Commodity Exchange (IACE) has been recently established in 2005
where contracts are made by cash. The commodities traded in IACE include corn (67%),
oilseed meals (20%), barley (10%), sugar (1.5%), rice (1%), chickpea (0.4%), lentil,
pistachio and saffron (almost 0.1% together). These contracts can not play the role of
hedge the producers in agricultural market. Establishing new futures contracts in IACE
may have some advantages compared to existing futures contracts in the other exchanges
of world. In this context, we are interested to study whether or not local physical cash
markets in Iran have a strong price relationship to existing futures contracts.
In absence of strong price correlation, development of a contract based on local needs
might be the best way to satisfy local price risk management interests. Some evidences
are available for such a claim. For example, the lack of price correlation between
Malaysian palm oil markets and the CBOT soybean oil futures contract has supported the
development of palm oil futures on the Kuala Lumpur Commodity Exchange (KLCE).
Similarly, the establishment of an exchange that would trade coffee futures is being
considered in Indonesia as local prices often are moving in divergence to prices traded in
Many studies have focused on the relationship between the domestic and world prices of
main agricultural commodities. Figiel et al. (1997) investigated the impact of government
policies on the relationship between Polish and world wheat prices and founded that
wheat cash prices in Poland are not closely related to futures prices in Chicago and
London. Also, Du (2004) compared the price behavior of the China Zhengzhou
Commodity Exchange (CZCE) with that of the Chicago Board of Trade (CBOT) in the
US. Results showed that the existing interrelations between the two markets are
significant and asymmetric, where CBOT holds a dominant position in the interactions
while CZCE is more likely a follower (See Durham and Si, 1999 and Bamba, 2004).
The main purpose of this study is investigating existence the price relationship between
Iran physical cash markets and world futures exchanges.
The results of this study will have practical value to Iranian producers considering the use
of futures markets. Moreover, this analysis has policy implications with regard to whether
or not a futures exchange in Iran is needed.
2. Methodology
In this study, the basis risk analysis is used to investigate the existence of price
relationship between the domestic cash markets in Iran and existing futures contracts in
the other commodity exchanges.
The basis in a hedging situation is defined as (Figiel et al., 1997 and Hull, 2000):
Basis =spot price of commodity to be hedged - futures price of contract used
If the commodity to be hedged and the commodity underlying the futures contract are the
same, the basis should be zero at the expiration of the futures contract. Prior to expiration,
the basis may be positive or negative. The basis increases when the spot price increases
more than the futures price and decline vice versa. Increase in the basis is referred to as a
strengthening of the basis and its decline is referred to as a weakening of the basis (Figiel
et al., 1997 and Hull, 2000).
Basis risk is defined as the fluctuation of basis. If there is a strong price relationship
between the physical cash market and the futures market, price changes in the physical
risk of declining prices to the futures market; of course the firm has also foregone the
opportunity to benefit from price increases. This risk shifting process is one of the
primary values of a futures market (Du, 2004, Figiel et al., 1997 and Hull, 2000).
However, not all of the risk can be shifted as there is never a perfect relationship between
cash and futures markets. There is always some residual risk associated with the hedging
process. This residual risk (the price risk that can't be shifted to futures markets) is
commonly referred to as the basis risk. In other words, the basis risk is the price variation
in the physical cash market that can not be explained by futures price variation (Hull,
2000). A low level of variation in the basis implies that there is a strong price relationship
between cash and futures markets and viable risk management strategies can be devised.
A high level of basis variation indicates that the relationship between the physical cash
market and the futures market is not strong and that not enough risk can be shifted to
make the hedging operation useful (Hull, 2000).
In order to assess the correlation between cash prices and the corresponding futures
prices, the ordinary least square regression is used. In this study to estimate equation (1):
s(t) = a + b* f(t) (1)
where s(t) and f(t) are the spot and futures prices at time t respectively. In this single
equation, coefficients are estimated under assumption that the structural relationship
described by the equation is invariant over time. Therefore, we applied the Augmented
Dickey-Fuller (ADF) statistics for nonstationarity test of s(t) and f(t) series, before
estimating the above single regression.
The adjusted R squared of considered regression can be viewed as one way of measuring
the residual risk inherent in the basis (Figiel et al., 1997). The adjusted R squared in
regression (1) indicates the percentage of the variability in cash prices that is explained
by the futures prices. The percentage of the cash price changes that is unexplained (1-R
squared) is an estimate of the basis risk. The higher the unexplained variability, the lower
the value of the adjusted R squared (the higher the basis risk), and the lower the
In the last section of this study, usefulness of making future contracts available to IACE
operators is investigated using simulation of futures price within a Monte Carlo approach
framework.
So far, the price simulation is appraised in very studies and in a Monte Carlo framework
specially (see Broadie et al., 1997, Chuan Duan and Wei, 1999 and Longstaff and
Schwartz, 1998). To use this approach in future price simulation, first it is necessary to
determine the model of price behavior. The quantity of random disturbance term is
calculated using Monte Carlo approach and then the prices are forecasted for future days.
According to assumptions about the type of distribution of random disturbance term,
researchers usually use different types of price behavior models such as Markov process,
Wiener process, Generalized Wiener process and Ito process (Deaton, D.A. and Laroque,
G., 1992 and Hull, 2000).
Based on Jarque-Bera Normality test in this study, we use the geometric Brownian
motion that is the developed model of Markov process. The discrete-time version of the
model is (Hull, 2000):
t t S S ∆ + ∆ =
∆ µ σε
that is:
t S t S
S = ∆ + ∆
∆ µ σ ε
∆S denotes the change in commodity price in a small interval of time (∆t), and ε is a random drawing from a standardized normal distribution (that is a normal distribution
with a mean of zero and standard deviation of one). The parameters µ and σ are the mean
and standard deviation of daily price changes respectively.
The standard deviation of daily price changes is calculated as (Hull, 2000):
∑
= − − = m i i nn u u
Where, ui is the price changes in ith day defined as:
Given prices, the mean and the standard deviation of price changes, it is necessary to
know the accurate estimation of ∆t. Therefore, we use the inverse of the number of price
changes (number of trading days) as the amount of ∆t.
In this study, corn is selected as the representative commodity traded in IACE and the
other agricultural commodity exchanges of the world, because of high level of traded
contracts in IACE (about 67%) and frequently existence in the main agricultural
commodity exchanges of the world such as CBOT, EURONEXT and TGE.
Furthermore, the Tokyo Grain Exchange (TGE) historical price data is selected as the
world corn futures prices because of having relevant market conditions in Asia and high
level of traded commodity.
We used daily historical price data of IACE (spot prices) and TGE (nearby futures prices)
corn from this date to September 2005. TGE corn prices are converted to Iranian rials
(Rls) equivalent prices. Also, we use daily historical price data of traditional market of
corn in Iran (both domestic and foreign corn).
3. Results and discussions:
In order to achieve a suitable perspective of corn market in Iran and Japan, we considered
the corn price variation over time. The primary objective of examining variation over
time was to gain insight into the degree of Iran price volatility. The basic method was to
quantify the spread of minimum and maximum prices and the monthly coefficient of
variation.
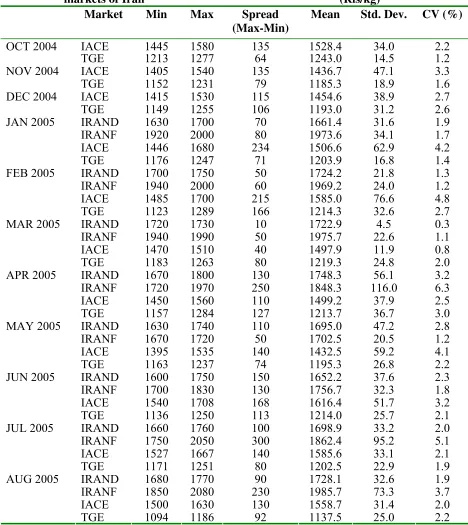
As is shown in Table 1, there is a great deal of variation observed over time in corn prices
in Iran. Where, prices tend to be very volatile especially in traditional markets.
Comparing these prices with those in TGE, Iran corn prices exhibit strong monthly
fluctuations. For example, during the time period covered, corn price variation as
measured by the coefficient of variation ranged from 0.8% to 4.8% in IACE and from
1.1% to 6.3% in Iran traditional foreign corn market while the coefficient of variation
over the same period of time is 1.2% to 3% at the TGE.
Table 1. Variation over time of daily corn prices in IACE, TGE and traditional markets of Iran (Rls/kg)
Market Min Max Spread (Max-Min)
Mean Std. Dev. CV (%)
IACE 1445 1580 135 1528.4 34.0 2.2 OCT 2004
TGE 1213 1277 64 1243.0 14.5 1.2
IACE 1405 1540 135 1436.7 47.1 3.3 NOV 2004
TGE 1152 1231 79 1185.3 18.9 1.6
IACE 1415 1530 115 1454.6 38.9 2.7 DEC 2004
TGE 1149 1255 106 1193.0 31.2 2.6
IRAND 1630 1700 70 1661.4 31.6 1.9 IRANF 1920 2000 80 1973.6 34.1 1.7 IACE 1446 1680 234 1506.6 62.9 4.2 JAN 2005
TGE 1176 1247 71 1203.9 16.8 1.4
IRAND 1700 1750 50 1724.2 21.8 1.3 IRANF 1940 2000 60 1969.2 24.0 1.2 IACE 1485 1700 215 1585.0 76.6 4.8 FEB 2005
TGE 1123 1289 166 1214.3 32.6 2.7
IRAND 1720 1730 10 1722.9 4.5 0.3 IRANF 1940 1990 50 1975.7 22.6 1.1 IACE 1470 1510 40 1497.9 11.9 0.8 MAR 2005
TGE 1183 1263 80 1219.3 24.8 2.0
IRAND 1670 1800 130 1748.3 56.1 3.2 IRANF 1720 1970 250 1848.3 116.0 6.3 IACE 1450 1560 110 1499.2 37.9 2.5 APR 2005
TGE 1157 1284 127 1213.7 36.7 3.0
IRAND 1630 1740 110 1695.0 47.2 2.8 IRANF 1670 1720 50 1702.5 20.5 1.2 IACE 1395 1535 140 1432.5 59.2 4.1 MAY 2005
TGE 1163 1237 74 1195.3 26.8 2.2
IRAND 1600 1750 150 1652.2 37.6 2.3 IRANF 1700 1830 130 1756.7 32.3 1.8 IACE 1540 1708 168 1616.4 51.7 3.2 JUN 2005
TGE 1136 1250 113 1214.0 25.7 2.1
IRAND 1660 1760 100 1698.9 33.2 2.0 IRANF 1750 2050 300 1862.4 95.2 5.1 IACE 1527 1667 140 1585.6 33.1 2.1 JUL 2005
TGE 1171 1251 80 1202.5 22.9 1.9
IRAND 1680 1770 90 1728.1 32.6 1.9 IRANF 1850 2080 230 1985.7 73.3 3.7 IACE 1500 1630 130 1558.7 31.4 2.0 AUG 2005
TGE 1094 1186 92 1137.5 25.0 2.2
Clearly under such conditions alternatives such as hedging with derivatives that are
The estimation of the R squared using the regression analysis described in section 2 was
performed for the overall considering period. In this way, first we used Dickey-Fuller
(DF) statistics for stationarity test of four considering series, because the results of
Breusch-Godfrey Serial Correlation LM Test showed that there were not residual serial
correlation and no need to use Augmented Dickey-Fuller (ADF) test. The DF test results
showed that the price series of IACE and TGE are stationary in level, but the price series
of traditional market (both domestic and foreign corn) are I(1) and therefore, their first
difference would be stationary.
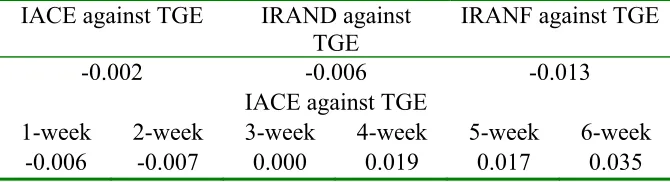
Then, in addition to the correlations with prices in levels, correlation of lagged prices (in
5 scenarios) was assessed. The results (quantified adjusted R squared) are showed in
Table 2. In general, there were poor correlations among the price series examined in this
[image:10.612.138.473.397.488.2]section.
Table 2. Correlation of corn spot prices in Iran regressed against respective TGE nearby futures prices (level and lagged)
As shown in Table 2, the lagging process improves the correlation results, especially
when prices are lagged more than one month.
After examining the numerical correlations, it is worthwhile to take a more graphical look
at the relationship between Iran corn prices and futures prices on the TGE. The prices of
IACE, TGE and traditional corn market prices are shown in Figure 1.
As noted before, when engaged in hedging activities, a commercial firm thinks in terms
of residual risk or more commonly a basis risk. This risk is the fluctuation of the price
differential between cash and futures prices (basis). IACE against TGE IRAND against
TGE
IRANF against TGE
-0.002 -0.006 -0.013 IACE against TGE
Figure 1. Corn prices in IACE, TGE and Iran traditional market (domestic (IRAND) and foreign (IRANF) corn) (Rls/kg)
TGE IACE IRAND IRANF 1000 1200 1400 1600 1800 2000 2200 Se p 04
Oct 04 No v 04
Dec 0 4 Jan 05 Feb 0 5 Ma r 05
Ap r 05
May 05
Ju n 05
Jul 05
Aug 0 5
Se p 05
In the case of our analysis, the physical cash price is the IACE and traditional corn
market prices and the futures price is TGE price. A graphical display of these
relationships is shown in Figure 2. This Figure shows visually the strong basis risk of the
Iran corn basis using TGE futures prices as a base.
Figure 2. Basis between IACE and Iran traditional market cash and TGE futures prices
IACE - TGE
IRAND - TGE IRANF - TGE
0 100 200 300 400 500 600 700 800 900 1000 Oct 04 Nov 04
Dec 0 4
Jan 05
Fe b 05
Mar 05
Apr 05
Ma y 05
Ju n 05
Ju l 05
Aug 05
[image:11.612.101.509.438.675.2]In the last part of this study, we investigate the usefulness of making future contracts
available of IACE operators, using simulation of futures price in a Monte Carlo approach
framework.
To use this approach in future price simulation, first it is necessary to determine the
model of price behavior. In order to specify the best model that shows the corn price
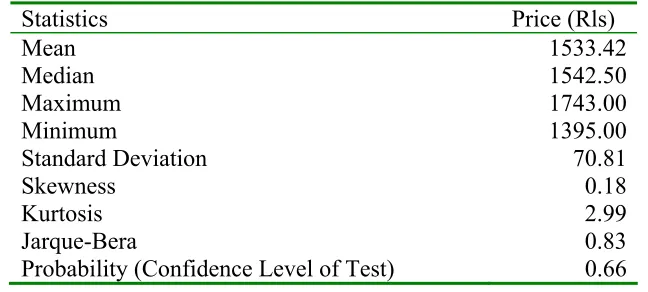
behavior in IACE, Jarque-Bera statistic is used to test normality of corn price time series.
The results show that the null hypothesis based on normal distribution of corn price time
series is not rejected in 99% confidence level. Table 3 shows the existence of normal
distribution in corn price time series and the results of Jarque-Bera test.
Statistics Price (Rls)
Mean 1533.42 Median 1542.50 Maximum 1743.00 Minimum 1395.00
Standard Deviation 70.81
Skewness 0.18 Kurtosis 2.99 Jarque-Bera 0.83 Probability (Confidence Level of Test) 0.66
As is noted in methodology section, according to the results of Jarque-Bera normality
test, the geometric Brownian motion model is used to simulate corn future prices in
IACE. Six representative days in two periods of time are selected for start simulation in
Monte Carlo framework. In the first time period, price simulations are done for the last
days of December 2004, January 2005 and February 2005 to the last day of April 2005
and in the second period, price simulations are started in the last days of June, July and
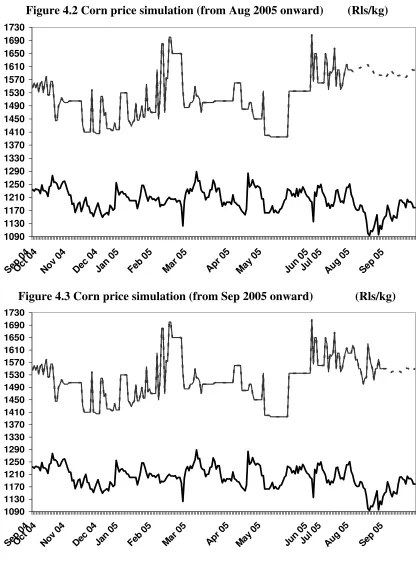
August and finished in the last day of September 2005. Simulated in different times,
Figures 3-1 to 3-3 exhibit the results of corn price simulations in the time period of Sep
2004-Apr 2005, and Figures 4-1 to 4-3 show similar results whithin SEP 2004-SEP 2005.
The lower lines in each of these three figures show the future corn prices at TGE and the
[image:12.612.139.463.299.445.2]upper graph shows the corn prices at IACE in which, the solid section shows the corn
Figure 3.1 Corn price simulation (from Jan 2005 onward) (Rls/kg) 1090 1130 1170 1210 1250 1290 1330 1370 1410 1450 1490 1530 1570 1610 1650 1690 1730 Sep 04 Oct 04 No v 04 Dec 04 Jan 05 Fe b 05
Mar 05
Apr 05
Figure 3.2 Corn price simulation (from Feb 2005 onward) (Rls/kg)
1090 1130 1170 1210 1250 1290 1330 1370 1410 1450 1490 1530 1570 1610 1650 1690 1730 Se p 04
Oct 04
No v 04
Dec 04
Figure 3.3 Corn price simulation (from Mar 2005 onward) (Rls/kg 1090 1130 1170 1210 1250 1290 1330 1370 1410 1450 1490 1530 1570 1610 1650 1690 1730 Se p 04
Oct 04
No v 04
Dec 04
[image:14.612.103.515.382.672.2]Jan 0 5 Feb 05 Mar 05 Ap r 05
Figure 4.1 Corn price simulation (from Jul 2005 onward) (Rls/kg)
1090 1130 1170 1210 1250 1290 1330 1370 1410 1450 1490 1530 1570 1610 1650 1690 1730 Se p 04 Oct 04
Nov 04
De c 04
Jan 0 5
Feb 05
Ma r 05
Apr 05
May 05 Jun 05
Jul 05
Aug 05
Figure 4.2 Corn price simulation (from Aug 2005 onward) (Rls/kg) 1090 1130 1170 1210 1250 1290 1330 1370 1410 1450 1490 1530 1570 1610 1650 1690 1730 Se p 04 Oct 04
Nov 04
De c 04
Jan 0 5
Feb 05
Ma r 05
Apr 05
May 05 Jun 05
Jul 05
Aug 05
Sep 05
Figure 4.3 Corn price simulation (from Sep 2005 onward) (Rls/kg)
1090 1130 1170 1210 1250 1290 1330 1370 1410 1450 1490 1530 1570 1610 1650 1690 1730 Se p 04 Oc
t 04 No
v 04 Dec
04 Jan
05 Fe
b 05 Mar
05 Ap
r 05 Ma
y 05
Ju n 05
Ju l 05
Aug 05
Se p 05
These figures indicate that the corn future prices in IACE (simulated price) and TGE
the TGE are not a suitable and strong substitution for establishing new futures contract in
IACE.
4. Conclusions:
The results of this study showed that, in Iran, prices tend to be very volatile especially in
traditional market. Comparing these prices with those at the TGE, Iran corn prices exhibit
strong changes in variation from month to month. This price variability over time
represents great price risk for those who operate on Iran corn market. It also indicates a
need for using effective risk management tools that under such conditions, alternatives
such as hedging with derivatives that are already available in many countries should be
examined.
In general, there is poor correlation among the Iran spot and TGE futures prices. In other
words, there is strong basis risk in the Iran corn basis using TGE futures prices as a base.
Therefore, the usefulness degree of the particular foreign futures contract (such as TGE)
in hedging domestic cash price risks is low.
The lagging process improves the correlation results, especially when prices are lagged
more than one month. This suggests that there could be inefficiencies related to the
transmission of information to the Iran corn markets. In other words, it takes up several
times for factors readily apparent to those trading at the TGE (as representative market of
world) to be fully discounted into the Iran corn market.
According to the results of price simulation in Monte Carlo framework, there is no
correlation between the TGE future prices and IACE simulated prices. Therefore, the
existing futures contracts in the other agricultural commodity exchanges of world (such
as TGE) are not a strong substitution for establishing new futures contract in IACE.
References:
1. Bamba, I. (2004) Monetary Policy Impacts on Cash Crop Coffee and Cocoa Using
Structural Vector Error Correction Model, selected paper, American Agricultural
Economics Association.
3. Chuan Duan, J. and Wei, J. (1999) Pricing Foreign Currency and Cross Currency
Options Under GARCH, Working Paper, Department of Finance Hong Kong University
of Science and Technology.
4. Deaton, D.A. and Laroque, G. (1992) On the Behavior of Commodity Prices, Review
of Economic Studies, 59(1), pp. 1-24.
5. Du, W. (2004) International Market Integration under WTO: Evidence in the Price
Behaviors of Chinese and US Wheat Futures, selected paper, American Agricultural
Economics Association.
6. Durham, C. and Si, W. (1999) The Dalian Commodity Exchange’s Soybean Futures
Contract: China’s Integration with World Commodity Markets, Chinese Agriculture and
the WTO Proceedings, Western Coordinating Committee, December 1999.
7. Figiel, S., Olsztyn, A. and Scott, T. (1997) The impact of government policies on the
relationship between polish and world wheat prices, World Bank.
8. Hull, J. (2000), Options, Futures, and other Derivatives, Prentice Hall, New York.
9. Longstaff, F. and Schwartz, E. S. (1998) Valuing American Options by Simulation: A