Munich Personal RePEc Archive
The Hot Hand, Competitive Experience,
and Performance Differences by Gender
Cotton, Christopher and Price, Joseph
Cornell University
18 July 2006
Online at
https://mpra.ub.uni-muenchen.de/1843/
The Hot Hand, Competitive Experience, and
Performance Differences by Gender
Christopher Cotton
∗Joseph Price
Department of Economics
Cornell University
Abstract
Using data on junior golf tournaments, we find evidence that the “hot hand” does exist, and that its prevalence decreases as golfers gain experience. This provides an explanation as to why studies that consider professional athletes conclude that the hot hand does not exist. We also show that females are much more likely to experience the hot hand compared with similar males, and provide evidence that this disparity is driven by differences in competitive experience. As golfers’ experience increases, gender dissimilarities disappear. We argue that exposure to competition may also drive other gender differences identified in competitive environments.
(JEL) J16, J7
∗ Contact information: [email protected] or [email protected]
We are very grateful to Tung Lee and the American Junior Golf Association for providing the data. This paper has benefited from helpful comments by Talia Bar, Tom Gilovich, and Ted O’Donoghue.
I. Introduction
The term “hot hand” refers to the idea that, controlling for skill, the probability an
individual succeeds at a task in the current period depends on whether the individual
succeeded or failed in previous periods. Despite the popular belief in the hot hand—the
belief that people go through hot and cold performance spells—there exists little evidence
that the hot hand actually exists (Camerer 1989, Camerer and Loewenstein 2004,
McFadden 2006).
In their seminal paper, Gilovich, Vallone and Tversky (1985) find no evidence
that runs of sequential successes or failures by professional basketball players occur more
often then they would if a completely random process governed performance.1 They refer
to the popular belief in the hot hand as the “hot hand fallacy.” Other papers extend
Gilovich, Vallone and Tversky’s analysis to other sport, and non-sport settings.2 The
majority of these papers find no conclusive evidence that the hot hand exists.3 However,
these analyses focus on professional or highly experienced individuals completing routine
tasks they likely completed hundreds or thousands of times before. We argue that the hot
hand, if it does exist, is likely driven by psychological factors including fluctuations in
self-confidence, emotion and ability to remain focused, and that the impact these factors
1
For example, a baseball player who has a 30% probability of getting a hit during any at bat will still have occasional games in which he gets a hit each time he is at bat, and other games in which he does not get any hits. Some people believe that the player experienced a “hot” or “cold” game, even if his performance was completely random given his skill.
2
The application to sports includes baseball (Albright 1993), putting and dart throwing (Gilden and Wilson 1995), horseshoes (Smith 2003), bowling (Dorsey-Palmateer and Smith 2006), PGA golf (Clark 2005), and tennis (Klaassen and Magnus 2001). Additionally, Cheng, Pi and Work (1999) look at the hot hand performance of mutual funds. Hindricks, Patel and Zeckhauser (1993) also consider the performance of mutual funds, but use a different definition of the hot hand compared with the other studies.
3
have on performance should decrease as individuals gain experience. Therefore, we
would not expect these previous studies to find evidence of the hot hand.
Our analysis uses data on the performance of junior golfers between 12 and 17
years of age in American Junior Golf Association (AJGA) tournaments. We show that, in
such a setting, the hot hand does exist and that its presence decreases as golfers gain
tournament experience. There is a strong occurrence of the hot hand among golfers in
their first year of AJGA tournament competition. However, by the third year of
tournament competition, the prevalence of the hot hand among these same players is
statistically indistinguishable from zero. The relationship between experience and the hot
hand explains why analyses of professional athletes find little evidence in support of the
hot hand.4
Additionally, we show that female golfers are more prone to experiencing
performance streaks compared with similar males. This is consistent with a variety of
recent papers that argue that males and females respond to competition differently. For
example, Gneezy, Niederle and Rustichini (2003), and Gneezy and Rustichini (2004)
show that men increase their absolute level of performance in response to competition
more than women do.5
4
To the extent that the hot hand is related to a player’s self-confidence, these results are in line with Lenney’s (1977) argument that over- or under-confidence issues will be corrected over time if there is unambiguous feedback regarding one’s ability.
5
The reason for the gender differences identified in the previous literature is
unclear. One explanation is that differences in genetic makeup, instinctive nature, or
other “hard-wired” characteristics drive the differences in reaction to competition.
However, we find evidence in support of an alternative explanation: that apparent gender
dissimilarities are driven by differences in past exposure to competitive environments
between males and females. We show that although the hot hand has a significantly
greater impact on the performance of females compared with males, this difference is
essentially eliminated by the second year of AJGA tournament experience. This result
suggests that differences in exposure to competitive environments may also explain other
gender differences identified in the literature (e.g., Gneezy, Niederle and Rustichini 2003;
Gneezy and Rustichini 2004; Niederle and Vesterlund 2005).
The paper proceeds as follows. Section II provides an overview of the junior golf
tournaments and our data. Section III presents the empirical analysis. The paper
concludes with a discussion of our results and their implications in Section IV.
II. Junior Golf Tournament Data
Our analysis uses data provided by the American Junior Golf Association (AJGA) on the
hole-by-hole performance of individual golfers in golf tournaments from 2002 through
2005. The AJGA is the largest organization for junior golfers in the United States and
runs roughly 75 open and invitational tournaments per year throughout the country with
On each day of a tournament, each golfer participates in one round (18 holes) of
golf. Most of the tournaments involve multiple days of golf with participation in the 2nd,
3rd, or 4th round depending on performance during the previous rounds. Boys and girls
compete in each tournament against members of their same gender.6
Golfers attempt to minimize the number of strokes taken in each round of golf.
The golfer with the lowest score wins the round. For each hole, a par is assigned that
reflects the expected number of strokes required to complete the hole. The par on a given
hole can be 3, 4, or 5 strokes. A golf course is typically made up of multiple holes at each
level of par, with par-4 holes being the most common. A player’s performance on each
hole is judged relative to par, with scores at or below par being seen as successful holes,
and scores above par being viewed as unsuccessful holes. Throughout our analysis, we
will refer to achieving par or below as a “hit” and scoring above par as a “miss” in order
to remain consistent with the terminology in the hot hand literature.
While we do not have data on the performance of players prior to 2002, we do
have a list of participants for all of the tournaments in 2001. We exclude all players who
participated in two or more tournaments in 2001 from our analysis. This insures that we
have an accurate measure of a player’s actual experience in the AJGA. We also limit our
data to players who participated in at least three tournaments in a given calendar year.
Our analysis includes 1,750 individual golfers, 540 of who participate in multiple years.
In testing for the hot hand, we consider the probability of success on a total of 478,681
player holes (358,612 holes played by males, and 120,069 holes played by females). For
each of these holes we know whether the player achieved par or better (which occurs
6
about 61% of the time for women and 70% of the time for men). Table 1 provides a count
of the number of players in our sample by first year of participation in an AJGA
tournament and current experience.
III. Empirical Strategy and Results
This section outlines our empirical strategy for testing for the hot-hand effect and
presents results on how the hot hand effect differs by gender and experience. The first
two methods we use to test for the hot hand (conditional probability analysis and the runs
test) are based on the approach of Gilovich, Vallone, and Tversky (1985). These two tests
are similar to those used in the majority of past hot hand analysis and both test for the
fraction of players for whom performance is not independent of past performance. As a
third check, we use a logit regression that tests the impact of gender, experience and
previous-hole performance on the probability of achieving par. The logit regression
allows us to quantify the degree to which the probability of success is influenced by past
performance.
Conditional Probability Analysis
The first method we use to test for the hot hand is a comparison of conditional
probabilities that tests whether a player is more likely to achieve par following a series of
good performances compared to a series of bad performances. We test the following null
hypothesis:
where a player is said to achieve a “hit” if he or she did at least as well as par, and
achieve a “miss” otherwise. We also carry out a similar test based on the previous two
holes.
The results of this analysis are included in Tables 2 and 3. In Table 2, the rows
labeled A-H in each panel represent the eight male or female players who participated in
the most rounds of golf in a single year (around 26). Using the players for which we have
the most observations insures that each cell has a sufficient number of observations to
make meaningful comparisons. The results in table 2 show that the female players have a
high prevalence of the hot hand (6 of the 8 women) while none of the men demonstrate
the hot hand at a significant level. For some of these women the gap between the
probabilities of achieving par following two successful holes compared to two failed
holes is very large. For example, player D is six times more likely to achieve par (71.6%
vs. 12.3%) following two par holes compared to when following two non-par holes and a
similar gaps exist for players B and G.
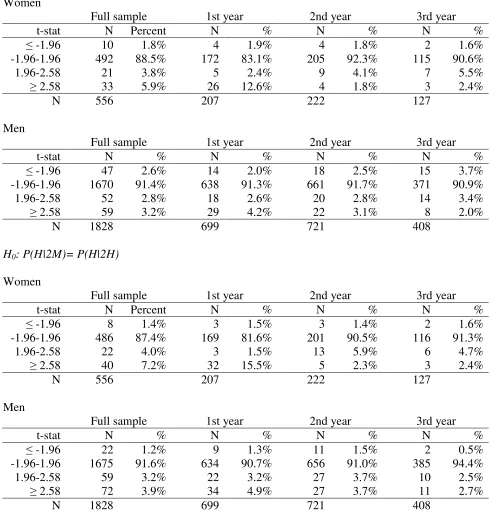
Table 3 carries out a similar analysis for the full sample of players and separates
the results by the AJGA tournament experience level of each player. The upper panel
provides the distribution of test statistics based on the difference in the probability of
achieving par following a hit compared to following a hit. The lower panel is the same
analysis but based on the difference in the probability of success following two hits
compared to two misses.
The distribution is broken up into four categories representing natural cutoffs in
the normal distribution. Under the assumption of independence, we should observe a test
and 3.2% of the men in our sample exceed this cutoff. This indicates that there are more
hot-handed players in our sample than should occur if success is independent of past
performance and that female players are more likely than male players to fit this
category.
The second through fourth column of Table 3 separate the sample based on the
experience level of the player. The results in these columns show that the hot hand effect
is most prevalent in the first year of tournament player with 13% of women and 4% of
men having test statistics greater than 2.58 (relative to the 1% we’d expect). By the
second and third year of tournament play the gender gap in the hot hand has disappeared
with only about 2% of both men and women having a test statistic greater than 2.58, and
5%-7% with a test statistic greater than 1.96.
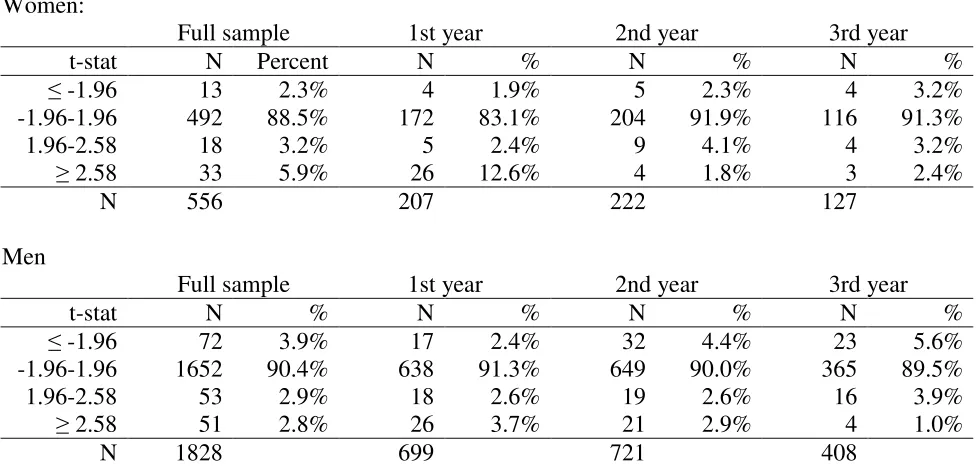
Runs Test
Our second method, the runs test, looks at the degree to which successes and
failures clump together. For this test, each sequence of consecutive hits or misses is
referred to as a run. For example, the sequence “1101110” consists of 4 runs with two
runs of ones and two runs of zeros. If misses tend to clump together then this would
create a smaller number of runs than we would expect under the assumption of
independence. The statistical test if based on the Wald-Wolfowitz runs test.
Table 4 is set up in an identical fashion as Table 3 with the test statistic referring
to the runs test instead of a difference in probabilities. For the full sample, women are
60% more likely to exhibit the hot hand (9.1% vs. 5.7%) and are twice as likely to exhibit
prevalence of the hot hand effect is most concentrated in first year players with 15% of
women and 6.3% of men demonstrating a hot hand effect based on the degree to which
their misses clump together.
Logit Regression Analysis
Our final method is a regression-based test for the hot hand that examines how the
probability of achieving par depends on the performance of the previous hole. By
including player-year fixed effects in the regression, we test whether a given player is
more likely to achieve par (relative to his or her average performance) following a good
performance compared to following a bad performance. We interact performance on the
previous hole with the player’s gender and experience to test for gender and experience
differences in the response to past performance. Our logit regression takes the following
form:
Prob(hit)it = ·hit it-1 + 1· gender ·hit it-1 + 2· experience ·hit it-1 + i·Xi
+ 3· par3t + 4 · par5t + it
where “hit” refers to whether the player scored at or below par. The subscript t refers to
the particular hole, with hitt-1 indicating whether the player achieved par on the previous
hole. The subscript i refers to the individual player (or player-year) with Xi representing a
either a set of player characteristics, player fixed effects, or player-year fixed effects.
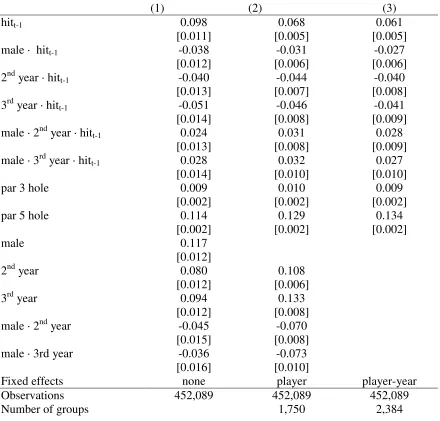
The results in table 5 provide the average marginal effect of each variable on the
probability of achieving par. The 2nd column includes a set of player fixed effects and the
influenced by the performance on the previous hole with the first column showing that a
player is 9.8 percent more likely to achieve par following a successful hole than an
unsuccessful one. The impact of past performance is reduced to 6.8 percentage points
when we include player fixed effects and to 6.1 percentage points when we include
player-year fixed effects.
The interaction between past performance and the player’s gender show that men
are less influenced by past performance. The interaction between experience and past
performance show that hot hand decreases with experience with the largest drop
occurring between the first and second year of tournament experience. The interaction
between gender, experience, and past performance indicates that women are becoming
less streaky at a faster rate than men. As a result, the gender gap in the hot hand effect
disappears with experience such that by the third year of tournament play the overall hot
hand effect results in only about a 2 percentage point difference in the probability of
achieving par following a hit compared to following a miss.
The results obtained above were based on an unbalanced panel. However, when
we run a similar model for the set of players that we observe for three years, we obtain
nearly identical result. We also test for whether streaky players are more likely to stop
participating in tournaments and find that this is not the case. These two results indicate
that the level of streaky behavior is altered by experience and not merely the attrition of
more streaky players.
IV. Discussion
Our ability to control for both a golfer’s experience and gender allows us to consider
additional implications of our analysis that were not possible in the previous analyses of
the hot hand, or previous tests of gender differences in response to competition. Most hot
hand analyses focus on only one gender of athletes at the highest level of competition.
Past studies of gender differences in competition do not control for competitors’
experience. In the section below, we discuss the contributions of our analysis.
The Hot Hand and Experience
In contrast to most of the past literature, we show that the hot hand does exist, at
least in certain situations. However, we also show that the hot hand decreases as golfers
in our sample gain experience. The impact the hot hand effect has on the performance of
junior golfers essentially disappears by the golfers’ third year of tournament participation.
This suggests that the hot hand also does not significantly impact the performance of
more experienced (e.g., professional) golfers, or highly experienced participants in other
situations to the extent that the relationship between the hot hand and experience carries
over from golf to other activities.
False Consensus Effect
People tend to believe that the hot hand effect impacts performance in situations
in which it does not exist (Camerer 1989). Gilovich, Vallone and Tversky (1985) label
this incorrect belief as the hot hand fallacy, and show that the streaks people misinterpret
outcome of a completely random process. Behavioral economists often refer to the hot
hand fallacy as its own psychological tendency (e.g., Camerer and Loewenstein 2004;
McFadden 2006). However, our analysis suggests that the belief in the hot hand may not
define an independent tendency, but rather that it may be driven by the false consensus
effect, a widely established psychological concept. Formulating a new hypothesis is
possible given the relationship between the hot hand and experience that we identify.
The false consensus effect represents the idea that people overestimate the extent
to which the behavior and preferences of others are similar to their own behavior and
preferences. Such an effect has been widely documented in the psychology literature
following its initial identification by Ross, Green and House (1977).7 In the case of the
hot hand, if people recognize that they (or other amateurs) experience the hot hand when
participating in an activity, then they may overestimate the likelihood that others also
experience the hot hand. This explanation requires that people do not recognize that the
presence of the hot hand depends on one’s experience. However, this is a reasonable
explanation given that, until now, statistical analyses have not recognized the relationship
between the hot hand and experience.
Similarly, even experienced athletes may believe the hot hand effect impacts
performance if they formed their beliefs regarding the prevalence of the hot hand when
they were less experienced.
7
Many other papers also find evidence of the false consensus effect. For an overview of the psychology analyses, see Mullen, et. al. (1985). Others, including Selten and Ockenfels (1998) and Engelmann and Strobel (2000), find evidence in economic settings.
Gender Differences and Competition
Of all of our results, those regarding the relationship between gender differences
and competitive experience are likely to have the greatest implications for the economics
literature. We find that female golfers are more likely to be influenced by past
performance than similar males, and that this difference is eliminated after the females
gain experience. Our favored explanation for the initial gender difference is that males
are more likely to have more competitive experience prior to joining the AJGA than
females.8 Once females accumulate enough tournament experience, the gender difference
is eliminated.
Although we analyze gender differences with respect to the hot hand, we see no
reason why similar effects would not influence other measures of competitive
performance. To the extent that differences regarding the hot hand are similar to other
gender differences identified in the literature (e.g., Gneezy, Niederle and Rustichini 2003;
Gneezy and Rustichini 2004; Niederle and Vesterlund 2005), our results suggest that
recent papers that show males respond more favorably to competition compared to
females may be driven by differences in competitive experience (or exposure to
competition) rather than actual biological differences.
We do not further explore this implication here, but encourage further
consideration of this question. Future analyses may test whether differences in
8
We collect data from the Junior World Golf Championships (JWGC) from 1995 through 2005 on the number of male and female golfers registered in each age category. While the AJGA data does not include the age of the golfers, the JWGC lists participants in narrow age ranges, and does not require golfers to be at least 12 years of age. This makes it possible to observe if male golfers begin participating in tournaments at an earlier age compared with female golfers. We find that on average males start competing in
competitive experience drive the results of Gneezy, Niederle and Rustichini (2003),
Gneezy and Rustichini (2004) and Niederle and Vesterlund (2005); and whether
increasing exposure to competition can eliminate gender differences in less trivial
References
Albright, S. Christian (1993). “A Statistical analysis of hitting streaks in baseball.”
Journal of the American Statistical Association, 88: 1175-1183.
Barber, Brad M. and Terrance Odean (2001). "Boys will be boys: gender, overconfidence and common stock investment." Quarterly Journal of Economics, 261-292.
Camerer, Colin (1989). “Does the basketball market believe in the ‘Hot Hand’?”
American Economic Review, 79(5): 1257-61.
Camerer, Colin and George Loewenstein (2004) “Behavioral Economics: Past, Present, Future.” In Advances in Behavioral Economics, Colin Camerer, George Loewenstein and Matthew Rabin, Eds. New Jersey: Princeton University Press.
Cheng, Louis T., Lynn K. Pi, and Don Wort (1999). “Are there hot hands among mutual fund houses in Hong Kong?” Journal of Business Finance and Accounting, 26n1-2, 103-135.
Clark, Richard. (2005). “Examination of hole-to-hole streakiness on the PGA tour.”
Perceptual and Motor Skills, 100: 806-814.
Dorsey-Palmateer, Reid and Gary Smith (2004). “Bowlers’ Hot Hands.” American Statistician, 58(1): 38-45.
Engelmann, Dirk and Martin Strobel (2000). “The False Consensus Effect Disappears if Representative Information and Monetary Incentives Are Given.” Experimental
Economics, 3:241-260.
Gilden, David L. and Stephanie Gray Wilson (1995). “Streaks in skilled performance.”
Psychonomic Bulletin and Review, 2: 260-265.
Gilovich, Thomas, Robert Vallone & Amos Tversky (1985). “The hot hand in basketball: On the misperception of random sequences.” Cognitive Psychology, 17, 295-314.
Gneezy, Uri, Muriel Niederle and Aldo Rustichini (2003). "Performance in Competitive Environments: Gender Differences." Quarterly Journal of Economics, 20:1049-1074.
Gneezy, Uri, and Aldo Rustichini (2002). "Gender and competition at a young age."
American Economic Review, 94(2): 377-381.
Klaassen, Franc and Jan Magnus (2001). “Are points in tennis independent and
identically distributed? Evidence from a dynamic binary panel data model.” Journal of the American Statistical Association, 96: 500-509.
Larkey, Patrick D., Richard A. Smith and Joseph B. Kadan (1989). "It's Okay to Believe in the 'Hot Hand'." Chance, 2(4):22-30.
Lenney, Ellen (1977). “Women’s self-confidence in achievement settings.”
Psychological Bulletin, 84: 1-13.
Loewenstein, George, Ted O’Donoghue and Matthew Rabin (2003). “Projection Bias in Predicting Future Utility.” Quarterly Journal of Economics, 118(4): 1209-1248.
Lundeberg, Mary A., Paul W. Fox and Judith Puncochar (1994). “Highly confident, but wrong: Gender differences and similarities in confidence judgments.” Journal of Educational Psychology, 86(1): 114-121.
McFadden, Daniel (2006). “Free Markets and Fettered Consumers.” American Economic Review, 96(1): 5-29.
Mullen, Brian, Jennifer L. Atkins, Debbie S. Champion, Cecelia Edwards, Dana Hardy, John E. Story and Mary Vanderklok (1985). “The False Consensus Effect: A Meta-Analysis of 115 Hypothesis Tests.” Journal of Experimental Social Psychology, 21(3): 262-283.
Niederle, Muriel and Lise Vesterlund (2005). "Do women Shy Away from Competition? Do Men Compete Too Much?" Working paper, June 2005.
Ross, Lee, David Greene and Pamela House (1977). “The False Consensus Effect: An Egocentric Bias in Social Perception and Attribution Processes.” Journal of Experimental Social Psychology, 13(2): 279-301.
Selten, Reinhard and Axel Ockenfels (1998). “An Experimental Solidarity Game.”
Journal of Economic Behavior and Organization, 34: 517-539.
Smith, Gary (2003). “Horseshoe pitchers’ hot hands.” Psychonomic Bulletin and Review, 10: 753-758.
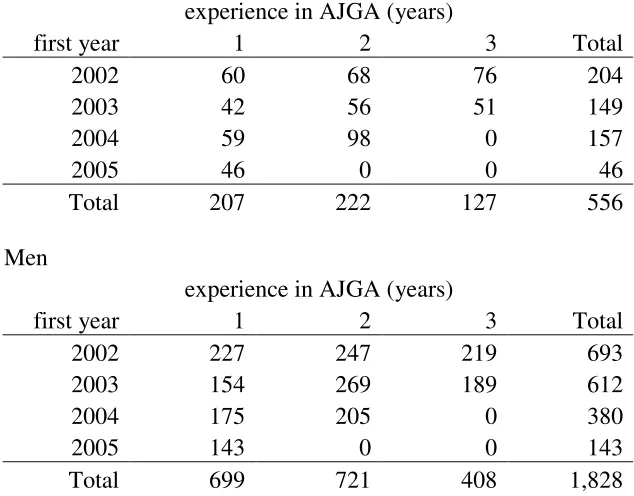
Table 1. Number players in our sample by first year of participation in an
AJGA tournament and experience.
Women
experience in AJGA (years)
first year 1 2 3 Total
2002 60 68 76 204
2003 42 56 51 149
2004 59 98 0 157
2005 46 0 0 46
Total 207 222 127 556
Men
experience in AJGA (years)
first year 1 2 3 Total
2002 227 247 219 693
2003 154 269 189 612
2004 175 205 0 380
2005 143 0 0 143
Total 699 721 408 1,828
Table 2. Probability of achieving par conditional on past performance
Women P(H|2M) P(H|1M) P(H) P(H|1H) P(H| 2H)
P(H|1M)= P(H|1H) (t-stat)
P(H|2M)= P(H|2H) (t-stat)
A 0.667 0.696 0.720 0.728 0.729 0.66 0.77
B 0.142 0.331 0.614 0.789 0.787 9.36** 10.85** C 0.808 0.762 0.710 0.690 0.665 -1.41 -1.47 D 0.123 0.363 0.559 0.712 0.716 6.89** 9.50** E 0.261 0.490 0.628 0.709 0.699 4.31** 6.22** F 0.253 0.482 0.641 0.731 0.750 4.92** 7.39** G 0.172 0.297 0.541 0.740 0.733 8.73** 9.35** H 0.279 0.468 0.577 0.650 0.698 3.56** 6.13**
Men P(H|2M) P(H|1M) P(H) P(H|1H) P(H| 2H)
P(H|1M)= P(H|1H) (t-stat)
P(H|2M)= P(H|2H) (t-stat)
A 0.739 0.750 0.782 0.791 0.789 0.86 0.56
B 0.929 0.819 0.808 0.806 0.817 -0.27 -1.07 C 0.739 0.767 0.752 0.748 0.737 -0.39 -0.02 D 0.846 0.847 0.841 0.839 0.842 -0.17 -0.04
E 0.679 0.705 0.709 0.710 0.716 0.10 0.41
F 0.867 0.803 0.795 0.793 0.796 -0.20 -0.67 G 0.875 0.829 0.822 0.821 0.818 -0.17 -0.58
H 0.654 0.706 0.754 0.769 0.778 1.29 1.43
Table 3. Distribution of test statistic that performance is independent of
performance on the previous holes by gender and experience.
H0: P(H|1M)= P(H|1H)
Women
Full sample 1st year 2nd year 3rd year
t-stat N Percent N % N % N %
-1.96 10 1.8% 4 1.9% 4 1.8% 2 1.6% -1.96-1.96 492 88.5% 172 83.1% 205 92.3% 115 90.6% 1.96-2.58 21 3.8% 5 2.4% 9 4.1% 7 5.5% 2.58 33 5.9% 26 12.6% 4 1.8% 3 2.4%
N 556 207 222 127
Men
Full sample 1st year 2nd year 3rd year
t-stat N % N % N % N %
-1.96 47 2.6% 14 2.0% 18 2.5% 15 3.7% -1.96-1.96 1670 91.4% 638 91.3% 661 91.7% 371 90.9% 1.96-2.58 52 2.8% 18 2.6% 20 2.8% 14 3.4% 2.58 59 3.2% 29 4.2% 22 3.1% 8 2.0%
N 1828 699 721 408
H0: P(H|2M)= P(H|2H)
Women
Full sample 1st year 2nd year 3rd year
t-stat N Percent N % N % N %
-1.96 8 1.4% 3 1.5% 3 1.4% 2 1.6% -1.96-1.96 486 87.4% 169 81.6% 201 90.5% 116 91.3% 1.96-2.58 22 4.0% 3 1.5% 13 5.9% 6 4.7% 2.58 40 7.2% 32 15.5% 5 2.3% 3 2.4%
N 556 207 222 127
Men
Full sample 1st year 2nd year 3rd year
t-stat N % N % N % N %
-1.96 22 1.2% 9 1.3% 11 1.5% 2 0.5% -1.96-1.96 1675 91.6% 634 90.7% 656 91.0% 385 94.4% 1.96-2.58 59 3.2% 22 3.2% 27 3.7% 10 2.5% 2.58 72 3.9% 34 4.9% 27 3.7% 11 2.7%
N 1828 699 721 408
Table 4. Distribution of test statistic that hits and misses clump together by
gender and experience.
H0: Runs = Expected Runs
Women:
Full sample 1st year 2nd year 3rd year
t-stat N Percent N % N % N %
-1.96 13 2.3% 4 1.9% 5 2.3% 4 3.2% -1.96-1.96 492 88.5% 172 83.1% 204 91.9% 116 91.3% 1.96-2.58 18 3.2% 5 2.4% 9 4.1% 4 3.2% 2.58 33 5.9% 26 12.6% 4 1.8% 3 2.4%
N 556 207 222 127
Men
Full sample 1st year 2nd year 3rd year
t-stat N % N % N % N %
-1.96 72 3.9% 17 2.4% 32 4.4% 23 5.6% -1.96-1.96 1652 90.4% 638 91.3% 649 90.0% 365 89.5% 1.96-2.58 53 2.9% 18 2.6% 19 2.6% 16 3.9% 2.58 51 2.8% 26 3.7% 21 2.9% 4 1.0%
N 1828 699 721 408
Table 5. Average marginal effects of various factors on the likelihood of
achieving par using logit regression
(1) (2) (3)
hitt-1 0.098 0.068 0.061
[0.011] [0.005] [0.005] male · hitt-1 -0.038 -0.031 -0.027
[0.012] [0.006] [0.006] 2nd year · hitt-1 -0.040 -0.044 -0.040
[0.013] [0.007] [0.008] 3rd year · hitt-1 -0.051 -0.046 -0.041
[0.014] [0.008] [0.009] male · 2nd year · hitt-1 0.024 0.031 0.028
[0.013] [0.008] [0.009] male · 3rd year · hitt-1 0.028 0.032 0.027
[0.014] [0.010] [0.010]
par 3 hole 0.009 0.010 0.009
[0.002] [0.002] [0.002]
par 5 hole 0.114 0.129 0.134
[0.002] [0.002] [0.002]
male 0.117
[0.012]
2nd year 0.080 0.108
[0.012] [0.006]
3rd year 0.094 0.133
[0.012] [0.008] male · 2nd year -0.045 -0.070
[0.015] [0.008] male · 3rd year -0.036 -0.073
[0.016] [0.010]
Fixed effects none player player-year Observations 452,089 452,089 452,089
Number of groups 1,750 2,384
Notes: The results presented in this table are average marginal effects of each variable on the likelihood of achieving par on a given hole. Standard errors are presented in brackets. The standard errors in the first column account for within player-year correlation of the error terms. The indicator “hitt-1” refers to whether or not the player achieved par on the
previous hole. The unit of observation is the individual hole for each player. All of the estimates are significant at the 99% level with the exception of the interactions between gender, experience, and past performance in the first column.