The influence of strain rate and the effect of friction on the
forging load in simple upsetting and closed die forging.
KLEMZ, Frances BlandAvailable from Sheffield Hallam University Research Archive (SHURA) at: http://shura.shu.ac.uk/3466/
This document is the author deposited version. You are advised to consult the publisher's version if you wish to cite from it.
Published version
KLEMZ, Frances Bland (1984). The influence of strain rate and the effect of friction on the forging load in simple upsetting and closed die forging. Doctoral, Sheffield City Polytechnic.
Copyright and re-use policy
See http://shura.shu.ac.uk/information.html
REFERENCE ONLY
ProQuest Number: 10697228
All rights reserved INFORMATION TO ALL USERS
The quality of this reproduction is dependent upon the quality of the copy submitted. In the unlikely event that the author did not send a com plete manuscript and there are missing pages, these will be noted. Also, if material had to be removed,
a note will indicate the deletion.
uest
ProQuest 10697228
Published by ProQuest LLC(2017). Copyright of the Dissertation is held by the Author.
All rights reserved.
This work is protected against unauthorized copying under Title 17, United States C ode Microform Edition © ProQuest LLC.
ProQuest LLC.
789 East Eisenhower Parkway P.O. Box 1346
THE INFLUENCE OF STRAIN RATE AND THE EFFECT OF FRICTION ON THE FORGING LOAD IN SIMPLE UPSETTING AND CLOSED DIE FORGING
Francis Bland Klemz MPhil, CEng, MIMechE
A thesis submitted to the COUNCIL FOR NATiONAL ACADEMIC AWARDS in partial fulfilment for the degree of DOCTOR OF PHILOSOPHY
Department of Mechanical and Production Engineering Sheffield City Polytechnic (Sponsoring Establishment)
The Drop Forging Research Association
Sheffield S3 7BA (Collaborating Establishment)
p°*0 STREET
ACKNOWLEDGEMENTS
The author wishes to express his gratitude to
Dr M S J Hashmi, Director of Studies, for suggesting this research project, for his encouragement and helpful
supervision.
Sincere thanks also to Dr A Thomas, Senior Scientific
Officer, Drop Forging Research Association, Sheffield, for his very useful guidance, comments and continued interest in this project.
The encouragement given by Mr 0 Bardsley, former Head of Department, is much appreciated.
The assistance given by Mr R Teasdale, Mr D McKay,
DECLARATION
The author declares that no part of this work has been submitted in support of another degree or qualification to this or any other establishment. The author further
declares that he has not been a registered candidate or enrolled student for another award of the CNAA or other academic or professional institution during the course of the research programme.
ABSTRACT
THE INFLUENCE OF STRAIN RATE AND THE EFFECT OF FRICTION ON THE FORGING LOAD IN SIMPLE UPSETTING AND CLOSED DIE FORGING.
F B Klemz
Forging provides an elegant solution to the problem of
producing complicated shapes from heated metal. This study attempts to relate some of the important parameters involved when considering, simple upsetting, closed die forging and extrusion forging.
A literature survey showed some of the empirical graphical and statistical methods of load prediction together with analytical methods of estimating load and energy. Investi gations of the effects of high strain rate and temperature on the stress-strain properties of materials are also
evident.
In the present study special equipment including an experimental drop hammer and various die-sets have been designed and manufactured. Instrumentation to measure load/time and displacement/time behaviour, of the deformed metal, has been incorporated and calibrated. A high speed camera was used to record the behaviour mode of test
pieces used in the simple upsetting tests.
Analytically two separate mathematical solutions have been developed: A numerical technique using a lumped-mass
model for the analysis of simple upsetting and closed-die forging and, for extrusion forging, an analysis which equates the shear and compression energy requirements to the work done by the forging load.
Cylindrical test pieces were used for all the experiments and both dry and lubricated test conditions were investi gated. The static and dynamic tests provide data on Load, Energy and the Profile of the deformed billet. In addition for the Extrusion Forging, both single ended and double ended tests were conducted. Material dependency was also examined by a further series of tests on aluminium and copper.
CONTENTS
Page No
ACKNOWLEDGEMENTS i
DECLARATION ii
ABSTRACT iii
CONTENTS v
INDEX TO FIGURES viii
CHAPTER 1 INTRODUCTION 1
1.1 Background 2
1.2 Literature Survey 2
1.2.1 Empirical graphical and statis
tical methods of load prediction 2
1.2.2 Analytical methods of
estimating load and energy 4
1.2.3 Stress strain properties at high
strain rates 6
1.2.4 Use of a 'model material1
technique 8
1.2.5 Extrusion forging 9
1.3 Present work 10
1.3.1 Simple upsetting and closed
die forging 10
1.3.2 Extrusion forging 12
CHAPTER 2 EXPERIMENTAL EQUIPMENT,
INSTRUMENTATION AND MATERIAL
PROPERTIES 14
2.1 Equipment 15
2.1.1 Drop hammer 15
2.1.2 Displacement measurement 16
2.2 Instrumentation 16
2.2.1 Load cell 16
2.2.2 Calibration of load cell 17
2.2.3 Infra-red switch unit 18
2.3 Load and displacement recordings 18
2.3.1 Load recordings 18
2.3.2 Displacement recordings 19
2.4 Determination of material properties 19;
2.4.1 Quasi-static tests 19
2.4.2 Dynamic tests 20
2.4.3 Quasi-static tests on lead and
idealised diagram 21
2.4.4 Quasi-static tests on aluminium
alloy and idealised diagram 22
CHAPTER 3 ANALYSIS USING A NUMERICAL TECHNIQUE 36
3.1 Introduction 37
3.2 The numerical technique 37
3.2.1 Strain-rate sensitivity 46
CHAPTER 4 SIMPLE UPSETTING OF CYLINDRICAL
BILLETS 53
4.1 Introduction 54
4.2 Experimental work 54
CO. Theoretical predictions 55
4.4 Results and discussions 56
CHAPTER 5 CLOSED DIE FORGING 73
5.1 Introduction 74
5.2 Experimental work 74
5.3 Theoretical prediction 74
5.4 Results and discussion 76
CHAPTER 6 EXTRUSION FORGING 87
6.1 Introduction 88
6.2 Analysis 91
6.2.1 First stage 92
6.2.2 Second stage 99
6.2.3 Third stage 104
6.2.4 Effect of friction 105
6.3 Experimental work 111
6.4 Results and discussions 111
6.4.1 Single ended extrusion forging 112
6.4.2 Tests on materials other than
lead 120
6.4.3 Double-ended extrusion forging 121
6.4.4 Discussion on the effect of
friction 122
CHAPTER 7 CONCLUSIONS AND SUGGESTIONS FOR
FURTHER WORK 197
7.1 Conclusions 198
7.1.1 The effect of friction 199
7.1.2 The effect of strain rate 200
7.2 Suggestions for further work 200
7.2.1 The equipment 200
7.2.2 Experimental work 201
7.2.3 The Analysis 201
REFERENCES 202
APPENDICES
1 Quasi-static compression of a short
cylinder of perfectly plastic material Al.l
2 Fast compression of a short cylinder A2.1
3 Tables of theoretical results A3.1
4 Computer program A4.1
5 Copies of published papers on this work A5.1
LIST OF FIGURES
Fig. No.
1 Arrangement of drop hammer
2 Drop hammer tup
3 Photograph: Moving grid/infra-red
switch device
4 Measurement of deformation
5 Photograph: Layout of instrumentation
6 Schematic block diagram of
instrumentation
7 Calibration of load cell
8 Calibration of instrumentation to
measure load
9 Typical load-time trace
10 Displacement recordings
11 Stress-strain results for different strain
rates
12 Stress-strain characteristics for lead
13 Stress-strain characteristics for aluminium
alloy
14a An element of the billet
14b Equivalent finite-difference model
15 Finite difference time/displacement
relationship
16 Elastic binary strain hardening stress
strain property
17 Cross section of billet
18 Approximated polygonal stress strain
diagram
19 Stress strain diagram identifying symbols
used in theoretical analysis
20 Approximated polygonal stress strain
21 Typical load-time trace for aluminium billet
22 Actual load configuration and the
corresponding numerical model. Simple upsetting
23 Theoretical and experimental lead billet
profiles - lubricated conditions
24 Theoretical and experimental lead billet
profiles - dry test conditions
25 Theoretical and experimental results: Die
load v Deformation. Lead cylinder (lubricated)
26 Theoretical and experimental results: Die
load v Deformation. Aluminium alloy cylinder (lubricated)
27 Theoretical and experimental results: Die
load v Deformation. Aluminium alloy cylinder (lubricated and dry test conditions)
28 Theoretical and experimental results: Billet
radius v time. Aluminium alloy cylinder (dry test conditions)
29 Theoretical and experimental results: K.E.
absorbed percent v deformation. Lead billets (lubricated)
30 Theoretical and experimental results: K.E.
absorbed percent v time. Aluminium alloy cylinder (lubricated)
31 Theoretical and experimental results:
Deformation v time. Lead cylinder (lubricated)
32 Theoretical and experimental results:
Deformation v time. Aluminium alloy cylinder (lubricated)
33 Actual load configuration and the
corresponding numerical model. Closed die forging
34 Billet size and final profile
35 Theoretically predicted instantaneous
profiles under lubricated conditions
36 Theoretically predicted instantaneous profiles under dry friction conditions
37 Comparison of theoretical and experimental
forging load v tup displacement curves
38 Variation in billet radius with tup
displacement at mid-section and die- billet constraint
39 Variation in strain rate with tup
displacement at mid-section and die billet constraint
40 Showing die pressure vs tup displacement
curves predicted theoretically and obtained experimentally
41 Photograph: split dies
42 Photograph: closed-die forgings
43 First stage of deformation. Extrusion
forging
44 Second stage of deformation
45 Die-billet configuration
46 Use of positioning ring to centralise
test piece
47 Theoretical profiles. Boss diameter 18 mm
48 Theoretical profiles. Boss diameter 9 mm
49 Photograph: Deformation mode of lead
billets
50 Photograph: Extrusion forgings. Three
different boss sizes
51 Theoretical/Experimental curves. Flange
diameters v total displacement. Boss diameter 18 mm. Static Lubricated
52 Theoretical/Experimental curves. Flange
diameters v total displacement. Boss diameter 18 mm. Dynamic Lubricated
53 Theoretical/Experimental curves. Flange
diameters v total displacement. Boss diameter 12 mm. Static Lubricated
54 Theoretical/Experimental curves. Flange
diameters v total displacement. Boss diameter 12 mm. Dynamic Lubricated
55 Theoretical/Experimental curves. Diameter ratio v Total displacement. Boss diameter 12 mm. Static Lubricated
56 Theoretical/Experimental curves. Diameter
ratio v Total displacement. Boss diameter 18 mm. Static Lubricated
57 Theoretical/Experimental curves. Diameter
ratio v Total displacement. Boss diameters 9 mm, 12 mm and 18 mm. Static Lubricated
58 Theoretical/Experimental curves. Flange
diameters v total displacement. Boss diameter 18 mm. Static dry.
59 Theoretical/Experimental curves. Flange
diameters v total displacement. Boss diameter 18 mm. Dynamic dry.
60 Theoretical/Experimental curves. Flange
diameters v total displacement. Boss diameter 12 mm. Static dry.
61 Experimental results. Top diameter of
flange v total displacement. Boss
diameter 18 mm. Static results. Dry and lubricated
6 2 Experimental results. Bottom diameter of
flange v total displacement. Boss
diameter 18 mm. Static results. Dry and lubricated
63 Experimental results. Top diameter of
flange v total displacement. Boss
diameter 12 mm. Static results. Dry and lubricated
64 Experimental results. Bottom diameter of
flange v total displacement. Boss
diameter 12 mm. Static results. Dry and lubricated
65 Photograph: Effect of friction on billet
profile
66 Experimental results. Top diameter of
flange v total displacement. Boss diameter 18 mm. Dynamic and static tests. Lubricated
67 Experimental results. Bottom diameter of
flange v total displacement. Boss diameter 18 mm. Dynamic and static tests. Lubricated
Page 68 69 70 71 72 73 74 75 76 77 78 78a 79 80
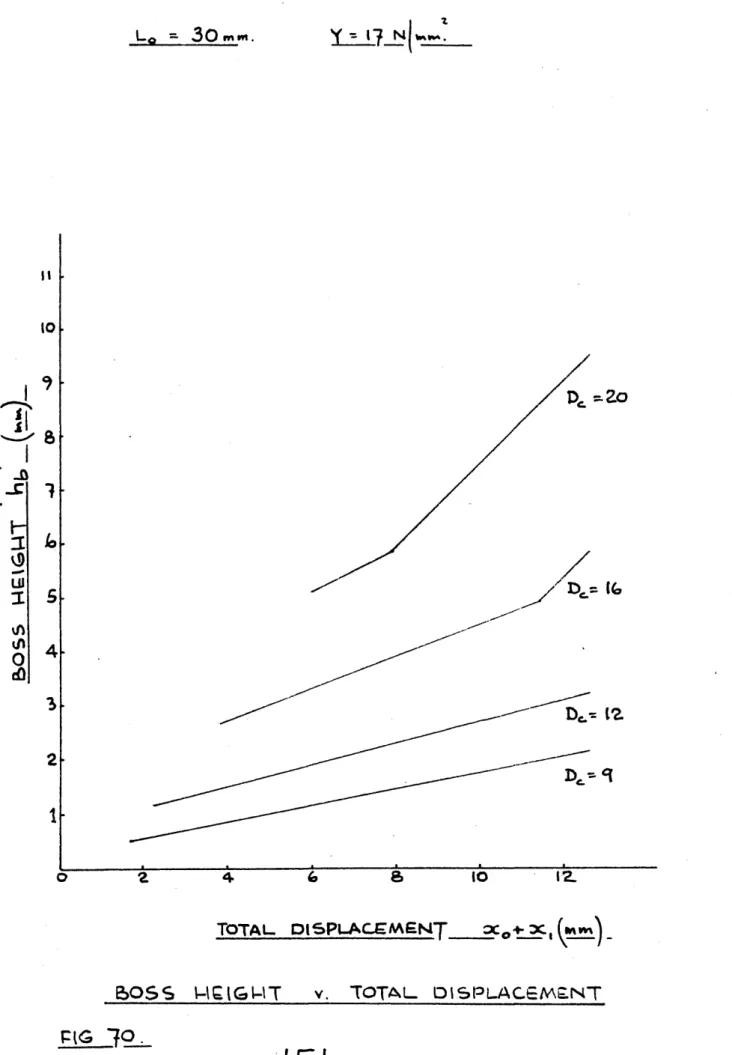
Theoretical results. Boss height v total displacement. Test piece length 18 mm. For boss diameters of 9, 12, 16 and 20 mm.
Theoretical results. Boss height v total displacement. Test piece length 22 mm. For boss diameters of 9, 16 and 20 mm. Theoretical results. Boss height v total displacement. Test piece length 30 mm. For boss diameters of 9, 12, 16 and 20 mm.
Theoretical/experimental curves. Boss height v total displacement. Boss
diameters 9 and 18 mm. Static and Dynamic. Lubricated.
Theoretical curve. Flange thickness v total displacement. Boss diameter 9 mm. Test piece lengths 18, 24 and 30 mm. Theoretical curve. Flange thickness v total displacement. Boss diameter 16 mm. Test piece lengths 18, 24 and 30 mm.
Theoretical curve. Flange thickness v total displacement. Boss diameter 20 mm. Test piece lengths 18, 24 and 30 mm.
Theoretical curve. Height ratio v total displacement. Boss diameter 18 mm. Test piece lengths 18, 20, 24 and 30 mm.
Theoretical curve. Height ratio v total displacement. Boss diameter 20 mm.
Test piece lengths 18, 20, 24 and 30 mm. Theoretical curves. Height ratio v total displacement. Test piece length 24 mm. Boss diameters 9, 12 and 18 mm.
Theoretical/experimental curves. Height ratio v total displacement. Boss
diameters 9 and 18 mm. Static. Lubricated. Theoretical/experimental results. Ratio of total billet height to total displacement Theoretical curves. Height ratio v diameter ratio for forging loads of 13 kN and 14 kN. Theoretical curve. Force required to
initiate deformation v boss diameter. Billet diameter 24 mm.
j/age
81 Theoretical curves. Forging load v total
displacement. Boss diameter 9 mm. Test piece lengths 18, 22 and 30 mm.
82 Theoretical curves. Forging load v total
displacement. Boss diameter 12 mm. Test piece lengths 18, 22 and 30 mm.
83 Theoretical curves. Forging load v total
displacement. Boss diameter 14 mm. Test piece lengths 18 and 30 mm.
84 Theoretical curves. Forging load v total
displacement. Boss diameter 16 mm. Test piece lengths 18 and 30 mm.
85 Theoretical curves. Forging load v total
displacement. Boss diameter 18 mm. Test piece lengths 18 and 30 mm.
86 Theoretical curves. Forging load v total
displacement. Boss diameter 20 mm. Test piece lengths 18, 22 and 30 mm.
87 Theoretical curves. Forging load v total
displacement. Test piece length 24 mm. Boss diameters 9, 12 and 18 mm.
88a Theoretical/experimental results. Forging load v total displacement. Boss diameter 18 mm. Experimental, static and dynamic lubricated.
88b Theoretical/experimental results. Forging load v total displacement. Boss diameter 12 mm. Experimental, static and dynamic lubricated.
89 Experimental results. Forging load v Total
displacement. Boss diameter 12 mm. Static tests. Dry and lubricated.
90 Experimental results. Forging load v Total
displacement. Boss diameter 18 mm. Static tests. Dry and lubricated.
91 Theoretical curves. Forging load v total
displacement. Boss diameter 9 mm. Forging temperatures 800, 1000 and 1200°C. Also lead at room temperature (
92 Theoretical curves. Forging load v total
displacement. Boss diameter 12 mm. Forging temperatures 800, 1000 and 1200°C. Also lead at room temperature
93 94 95 96 97 98 99 100 101 102 103 104 105
Theoretical curves. Forging load v total displacement. Boss diameter 14 mm. Forging temperatures 800, 1000 and 1200°C. Also
lead at room temperature
Theoretical curves. Forging load v total displacement. Boss diameter 16 mm. Forging temperatures 800, 1000 and 1200°C. Also lead at room temperature
Theoretical curves. Forging load v total displacement. Boss diameter 18 mm. Forging temperatures 800, 1000 and 1200°C. Also lead at room temperature
Theoretical curves. Forging load v total displacement. Boss diameter 20 mm. Forging temperatures 800, 1000 and 1200°C. Also lead at room temperature
Theoretical/experimental curves. Total energy absorbed v total displacement. Boss diameter 9 mm. Static, lubricated.
Theoretical/experimental curves. Total energy absorbed v total displacement. Boss diameter 12 mm. Static, lubricated.
Theoretical/experimental curves. Total energy absorbed v total displacement. Boss diameter 18 mm. Static, lubricated.
Theoretical/experimental curves. Total energy absorbed v total displacement. Boss diameter 9 mm. Dynamic and quasi-static tests.
Theoretical/experimental curves. Total energy absorbed v total displacement. Boss diameter 12 mm. Dynamic and quasi-static tests
Theoretical/experimental curves. Total energy absorbed v total displacement. Boss diameter 18 mm. Dynamic and quasi-static tests.
Photograph: Displacement mode. Boss diameter 18 mm. Copper
Theoretical/experimental curves. Energy v displacement. Boss diameter 18 mm. Static, lubricated.
Theoretical/experimental curves. Ratio of flange diameters v displacement. Boss diameter 18 mm. Static, lubricated.
106 Experimental/theoretical results. Flange diameters v displacement. Boss diameter 18 mm. Static, lubricated
107 Photograph: Displacement mode. Double
ended extrusion. Boss diameter 18 mm. Copper
108 Photograph: Displacement mode. Double
ended extrusion. Boss diameter 18 mm. Aluminium, copper and lead
109 Photograph: Double ended extrusion. Boss
diameter 18 mm. Uneven 'profile shown in lead and aluminium billets
110 Percentage total height v percentage deformation. Friction factor, m, = 1 111 Percentage total height v percentage
deformation. Friction factor, m, = 0.5 112 Percentage total height v percentage
deformation. Three different friction factors
113 Forging load v percentage deformation. Four different friction factors
114 Quasi-static compression of a short cylinder of perfectly plastic material
115 Fast compression of a short cylinder
189
190
191
192
193
194
195
196
A1.2 A2.3
1.1 Background
In recent years there has been an urgent need to increase the rate at which forgings can be produced in order to reduce manufacturing costs. This has led to a study of the dynamic behaviour of metals in order to exploit to the full the potential of high rate
forming methods.
Manufacturers with existing forging equipment need rel iable information regarding the load and energy needed to make particular forgings. It should be noted that the numerical technique, such as the finite element method and other techniques based on the upper bound method have
successfully been employed to solve very complex forming processes. However these techniques require large
computer facilities and are not easily accessible to
everyday Engineers. Hence there would always be room for analytical solutions, for specific problems, based on simpler and easily understandable principles.
1.2 Literature Survey
1.2.1 Empirical Graphical and Statistical Methods of Load Prediction
A number of empirical methods have been formulated [1-5] to determine the forging load under dynamic conditions. However, these are applicable to a limited number of cases only.
Graphs relating the area of forging including flash to the forging load for different degrees of die complexity have been used. Examples are given in a
Drop Forging Research Association report
BALOGUN measured forging loads on presses to produce axisymmetric and plane strain forgings. Using
multiple linear regression analysis, equations for estimating forging load were then developed.
NEUBERGER and PANNASCH^ plotted values of mean
effective yield strength vs mean height and deriving equations for the upper and lower curves which
encompassed their experimental data, obtained
expressions for the mean effective yield stress in terms of forging weight and forging area. They have also extended their analysis to produce nomograms for predicting load and energy requirements. Other investigators [8-10] have also compiled similar design nomograms.
In the Drop Forging Research Association report^ on Load and Energy estimation in Forging, results
9
calculated using Neuberger and Pannasch's method were used to obtain equations for relative yield strength and forging load. The load equations were based on a multiple linear regression analysis of experimental results on completely axisymmetric for gings with external flash. The load equation is in terms of the area of forging including flash, the ratio of the flash land width to flash land thick ness and the mean height of the forging including flash.
1.2.2 Analytical Methods for Estimating Load and Energy
12
SIEBEL produced an analysis for the load estima tion for the free upsetting of a cylinder or prism.
1 3
SCHROEDER and WEBSTER have given a more detailed analysis of free upsetting in which they recognise a limiting value for frictional resistance. Once this resistance exceeds the material yield strength they argue that deformation proceeds by internal shearing of the deformed metal.
FOSTER‘S modified S I E B E L ' a n a l y s i s to extend to complex forging shapes. His method is to divide the forging into sections, and having found the stress required to induce metal flow in each section, determines the value of the load in each section by integration of the stress throughout the section.
15
DEAN , in a paper discussing the effect of flash land geometry on die stresses, evolved a method of calculating forging load based on an interpretation
13
of the Schroeder-Webster analysis.
Dean assumed that, in the final stage of forging, deformation is confined to a disc whose thickness is that of the flash gap. Within the body of the
forging sticking friction is assumed, whilst the conditions in the flash land are decided by calcul ating the radius of the sticking region. The
parameters involved in Dean's equations are: radius
to the entrance to the flash, radius to which sticking extends, radius to edge of flash land, coefficient of friction, normal stress on forging section, load, flash land width and mean yield strength.
16
DIETRICH and ANSELL have considered the forging of plane symmetrical sections. As with the Siebel-
14
Foster method the forging is divided into sections and calculations begin with the flash and proceed towards the centre. Frictional resistance is accounted for by means of a 'back-pressure' term and the extrusion effect when metal flows into a reduced section is also allowed for.
17
BISWAS and ROOKS have adapted an original analysis 18
by ALTAN to predict forming load and energy. In analysing the forging load for axisymmetric shapes they assumed that, free upsetting, extrusion into cavities and the formation of flash occur as three discrete forming stages.
19
McDERMOTT has extended the upper bound elemental 25
technique first suggested by KUDO to calculate forging energy. In applying the method a forging is split into a number of regions and for each region an equation is set up relating the rate of energy dissipation to the strain rate of the forging in various principal directions. By developing
yield strength in a section can be determined, allowing load and energy to be calculated.
1.2.3 Stress-Strain Properties at High Strain Rates
A number of workers have attempted to derive a single equation expressing the stress in terms of strain,
20
strain rate and temperature. LUBAHN obtained such an equation containing six constants from three
empirical relationships. He assumed that for large strains the true stress/strain curve could be
represented by a simple power law. This assumption was supported by tensile test data obtained on a
21
number of materials by FUSFELD and by LOW and
22
GAROFALO but was in poor agreement with the results 2 3
Of DORN et al.
24
ALDER and PHILLIPS used a cam plastometer to produce constant true strain rates in the range
1-40 sec”* during compression to 50% reduction of height on (a) commercial-purity aluminium from -190°C to 550°C, (b) phosphorus-dioxidized copper from 18°C to 900°C and (c) a 0.17% carbon steel from 930°C to 1200°C. They found that of the three materials tested only aluminium, at room temperature, had a stress strain relationship that could be represented by a power law. This power law had an index of
approximately 0.2. The effect of strain rate on the stress for a given strain was better expressed by a power law than by the semi-logarithmic formula of
LUDWIK26.
27-31
SOKOLOV also concluded from tests on lead, tin,
zinc, aluminium, copper, nickel, brass and several steels, over a range of strain rates from 10"^ to 10^ sec-* and at temperatures from 20°C to their respective melting points, that the power law provided a better interpretation of the effect of strain rate. However, a number of American
32—36
workers ~ found from compression tests at
lO^-loS sec“l on copper at room temperature that the stress was proportional to the logarithm of the
strain rate for a given strain (up to 25% compression).
Other workers who have been concerned with the
effect of strain rate on the tensile properties are: GINNS37, ELAM38, JONES and MOORE39, and MANJOINE and
40
NADAI . Nadai, working on aluminium, copper, and steel at strain rates of lO^-lo^ sec”"* and at
elevated temperatures, found that the ultimate true stress varied approximately linearly with the
logarithm of the strain rate, in agreement with the results of JONES and MOORE^ Qn the yield strength of fourteen metals tested at room temperature and at strain rates up to 10“1 sec”*.
40
SLATER, JOHNSON and AKU derived approximate
equations to account for the compressive engineering strain-time, dimensionless compressive engineering strain-rate, compressive engineering strain and
dynamic force-time characteristics for the fast compression of prismatic blocks of strain-
hardening, strain-rate-sensitive material using a drop hammer. Within the limits of maximum strain rate of 250 sec~^, maximum engineering compressive strain of 0.4 and a constant ambient temperature of approximately 20°C experimental and theoretical results were compared. Agreement between experi mental and theoretical results was found, with the exception of the force-time relationship, where the theoretical prediction underestimates the maximum force by between 10 and 15 per cent. They concluded that lead at ambient temperature was not particular ly strain-rate sensitive for strain rates of up to 250 sec"l.
1.2.4 Use of a 1Model-Material1 Technique
c o
DANCKERT and WANHEIM have used a model-material technique in the analysis of a rotational symmetrical forging. These results were then compared with an actual forging made from aluminium. This technique makes it possible to investigate the effect of
different preforms and billet sizes on:
(a) the filling capacity of the final dies (b) the flow pattern in the final product (c) the extent of die wear quantitatively.
They demonstrated the use of 'the plane analogy* as
a means of using the material model to get an overall idea of material flow in the dies. More accurate information about the flow pattern was obtained by way of a "three-dimensional model- material experiment" in which the model is
geometrically similar to the original process. To -determine the stress distribution in the dies a
special rubber model technique was used. In this technique the die to be investigated is made of transparent rubber which has a grid placed in its plane of symmetry. The transparent rubber die is placed in a liquid with the same refraction index as the rubber and the forging is carried out with the billet made of wax, simulating the metal billet. The distortion of the grid that occurs during for ging is recorded photographically. By measuring the displacement of the grid points during the deformation of the wax billet it is possible to calculate stress values and to locate stress concentrations in the die.
1.2.5 Extrusion Forging
predictions, which were based on an assumed velocity field. They concluded that to achieve a maximum amount of rise (extrusion) and minimum load and energy, a billet with a high aspect ratio should be used in conjunction with a radiused and drafted
die hole. Their analysis did not take account of the taper in the flange profile.
($2.
NEWNHAM and ROWE applied a slip-line field theory analysis to the problem of compound metal flow in a simple extrusion/forging process. They tested their predictions experimentally and confirmed the tran sition from simple forging to rigid-core forging and hence to extrusion with forging. Their
analysis also did not take account of the taper in the flange profile.
1.3 Present Work
1.3.1 Simple Upsetting and Closed Die Forging
A theoretical and experimental study of the load
requirements associated with the upsetting and closed die forging of cylindrical billets, which takes into account the effects of interface friction, axial
inertia, strain rate and strain hardening properties of the material, was made.
A theoretical analysis has been developed based on a numerical technique which enables the billet
profile, the tup load and velocity to be determined at any stage during the in-process time. The
stress and strain-time history at any point within the billet can also be determined. This method uses a lumped mass model for the actual cylindrical
billet. Each mass was considered in turn and the associated dynamic force equilibrium equation was expressed in finite difference form. This related the displacement of each mass to the strain in the corresponding link after each time increment. The stress in each link, and hence the axial force, was then calculated from the material stress strain characteristics.
Various dies, to enable axisymmetrical shapes to be formed from lead cylinders, were made. These dies allow for radial expansion only and no provision was made for flash. Split dies were used for the more complicated shapes.
For the simple upsetting tests high speed photo graphs were taken of the billet as it was deformed. A Hi-cam high speed camera working at 2400 frames per second was used. The processed film was then projected on to a screen using a 16 mm
projector with single frame movement facilities and analysed for instantaneous profiles and tup-
displacement-time curves.
For the upsetting tests only, tests were also carried out on aluminium alloy billets heated to forging
temperature f
1.3.2 Extrusion/Forging
As the flow of metal in this process is only partially radial the lumped-mass method outlined in Chapter 3 was found to be inapplicable and a different
theoretical approach was developed. This approach considers the plastic work done in compression together with the work done in radial and circum
ferential shear. By equating the forces involved and assuming that the material deforms in a mode asso ciated with the least work done, the shape of the profile during deformation can be predicted.
Dies with three different extrusion ratios were manufactured for experimental work in order to check the extrusion/forging theory. The majority of tests were carried out using lead billets. A few tests on aluminium and copper billets were also
carried out to check for material dependency.
Double-ended extrusion tests were also carried out using lead and copper billets.
A drop hammer was designed specifically for the
experimental work associated with this study. Its energy capacity enables lead billets to be
deformed easily. The fact that lead is hot-worked at temperature means that it can be used to simulate the behaviour of other stronger materials that need to be heated to a suitable hot working temperature. The drop hammer incorporates instrumentation which enables load/time and displacement time behaviour to be measured and recorded.
CHAPTER 2
EXPERIMENTAL EQUIPMENT, INSTRUMENTATION AND BILLET MATERIAL PROPERTIES
14-2.1 Equipment
2.1.1 Drop Hammer
The drop hammer frame was made from 80 x 80 x 10 mm angle iron and is of welded construction. See
Fig. 1.
The framework provides the upper support for the tup guide rails, and support for a motorised hoist which is used to raise the tup to the required height. A cord release mechanism allows the tup to be
separated from its lifting cradle. The tup (see Fig. 2 and 3) has a mass of 15.64 kg with a maximum free fall height of 4.32 m. This is
equivalent to a maximum impact velocity of 9.2 m/sec.
At the base of the drop hammer an inner framework
made from 50 x 50 x 6 mm angle iron is used to
contain the load cell unit and to provide support for the tup guide rails. The load cell housing is
encased in concrete to provide an additional mass of material to absorb the shock load which occurs at impact.
In the interest of safety the lower 1 m of the drop hammer framework is encased in 3 mm thick duralumin plate. The remainder of the framework is encased in 25 x 25 mm wire mesh. Access for the removal of test pieces is by means of a hinged door which is pivoted in such a way that when in the open position
it will arrest the tup should it fall accidentally.
2.1.2 Displacement Measurement
The displacement/time behaviour of the material under test is measured using infra red light beams which are activated by means of a grid attached to the drop hammer tup (see Fig. 4). A complete
layout of the instrumentation is shown in a photo graph (Fig. 5).
2.2 Inst rumentat ion
2.2.1 Load Cell
A schematic block diagram of the load cell instru
mentation is shown in Fig. 6. The signal from the
load cell is fed into a Mini-balance and a Mini amplifier unit, the strain gauges being activated by a 5 volt d.c. supply. The signal from the strain gauge is balanced so that its output will be zero at zero load.
Because the output voltage from the load cell was in milli-volts a Mini-amplifier was used to increase the signal strength by )a gain of 200. This
amplified signal was then fed to a Digital storage Oscilloscope OS4040. Later this stored signal was used to produce a load time trace on an X,Y plotter. The digital storage oscilloscope was also used to record and display simultaneously the signals from
the infra-red switch unit.
2.2.2 Calibration of Load Cell
Before the load cell was assembled, in the base of the drop hammer, it was calibrated using a 500 kN Denison Tensile testing machine. The calibration curve is shown in Fig. 7.
A further calibration was necessary when all the instrumentation was in place and a series of tests with the drop hammer were to be made. The
calibration took the following form:
(a) The load-cell was disconnected
(b) A known voltage of 0.5 mV was applied to the load cell input terminals
(c) The resulting display on the oscilloscope was
copied using the XY plotter (see Fig. 8).
The 'step' on the XY plotter print out is equivalent
to 65.57 kN (Fig. 8). The size of the step can be
changed by altering the 'Y' axis settings on either the oscilloscope or XY plotter. (A large 'step' size was used when low impact forces were measured.)
The 0.5 mV output from the load cell was amplified 200 times. With the digital storage oscilloscope set to display a step of 1 cm per 20 mV a 'step' of 50 mm would have been obtained if there were no errors in the instrumentation.
2.2.3 Infra-Red Switch Unit
The velocity of the falling tup just before impact was obtained by an electronic counter which was activated and stopped by an infra-red switch unit. See Fig. 4. The signals were generated from the switch unit by interrupting the passage of light passing between two light emitting and light sensitive heads, the interrupting device being a strip of clear plastic sheet on which there had been drawn a series of equally spaced black, parallel, horizontal lines of equal thickness.
This switch was also used to trigger the
displacement/time display on the Digital storage oscilloscope OS4040, together with the load time display. A ten per cent pre-trigger was used.
Copies of the load/time, displacement/time traces were obtained from an XY plotter which had been connected directly to the digital storage
oscilloscope.
2.3 Load and Displacement Recordings
2.3.1 Load Recordings
A typical load/time trace is shown in Fig. 9. It is possible to read off values of load and time
direct from this trace (see page
3 1
)
2.3.2 Displacement Recordings
For each test using the drop hammer three traces are required, see Fig. 10.
Fig. 10(a) is obtained by lowering the tup gently on to the test piece and the resulting trace pro vides a datum which indicates the point of impact.
Fig. 10(b) shows how the tup decelerates as the metal is deformed.
Fig. 10(c) is obtained by lowering the tup gently on to the deformed test piece. Its function is to identify the total extent of deformation and will show clearly if there has been any rebound
incorporated in Fig. 10(b).
Fig. 10(b) is used to provide displacement/time data from which the deceleration of the tup can be cal culated. Since the mass of the tup is known the associated force (which is the forging force) can be calculated simply as the product of the deceler ation and the mass of the tup.
2.4 Determination of Material Properties
2.4.1 Quasi-Static Tests
The true stress/log strain relationships for the lead used to produce all the test pieces for this study were obtained using a Denison testing machine for
the static tests, and an Experimental Drop Hammer for the dynamic tests. The test pieces were cyl
inders 24 mm ± 0.13 mm diameter and 24 mm ± 0.13 mm
high. In each case a paste of graphite in
petroleum jelly was used to lubricate the surfaces in contact to reduce barrelling of the specimen.
In the quasi static test the Denison testing
machine was set to compress the test piece at its slowest rate, a constant speed of 3.5 mm/min. The test was interrupted at each true strain interval of
0.1 in order that the surfaces in contact could be
relubricated. Results from three identical tests were averaged.
2.4.2 Dynamic Tests
For the complete deformation to occur at a constant strain rate, using a drop hammer, it would be
necessary for the ratio, tup velocity/height of test piece, to be constant. In practice the strain rate will usually decrease as the deformation progresses. To allow for this only the initial 10% of data
associated with a particular load/time, displacement/ time output was used to calculate strain rate. By altering the height through which the tup had to fall the impact velocity was accurately controlled. By precompressing the test piece to the required thickness a strain rate could be applied to the test piece where its initial strain condition was known.
In this way successive steps were used to obtain stress/strain data at constant strain rate.
A computer program was used to help
analyse load/time and displacement/time data.
The relationship between stress and strain for diff erent strain rates is shown in Fig. 11. These
curves, based on experimental results were found to fit closely the strain rate sensitivity equation
1
o = Oi [1 + (6' p 6l0p]
where a is the dynamic flow stress corresponding
to strain rates e of up to 500 per second and is
the flow stress corresponding to strain rate e1 equal
to 1 per second. The constants of strain rate sensi
tivity D and p were found to be 1000s-1 and 0.65
respectively.
2.4.3 Quasi-static tests on lead and idealised diagram From the quasi-statically obtained stress-strain characteristics shown in Fig. 11 it was found
reasonable to assume that for direct comparison with quasi-static tests, the lead billets behaved as a bilinearly elastic-perfectly plastic material with a constant flow stress of 17 N/mm2, after a strain of about 14%. This is shown in Fig. 12 and was incor porated in the numerical technique. For the
extrusion forging analysis outlined in Chapter 6
lead billets were assumed to be rigid-perfectly plastic with a yield stress of 17 N/mm2.
Quasi-Static Tests on Aluminium Alloy and Idealised Diagram
The diagram shown in Fig. 13 was also obtained from quasi-static tests. In its idealised form it is
AE.g.ANG.ei'AEMT Dg-OP UftJAI^ee.
L ex»«TII46 STdtUWOttK
jAOTo«-\ieo wois*y
FA&aiCATTeO aaaik
COtLD ATTAC-^eE> to
CJEUGASe MeCHANilSNV
HlNfl»&C> ‘DOOB.
c.
\
V
\
LOAD ceL.U
23
FRAiaE
i_i
F
71
mG
cO
U-kG
.
< 01
j
c\J
vD ll.
I—
1
STAND CA(2RYING»
{nfcza- eeo
SWITCMES ^
" V
r
S2-<£
/
GfciD
^ 5lac-t l»*^cs on
c le a r plashc.^
j Tap
y
TEST Pl£c£
base o f oeop
h a/vvaeg^I
/V \E A S U C 2 ,g M g N T O F D E F O R M A T IO N
SN IW V
• <
t
28
N»
av
cn
woz
jd
JL
nd
ln
o
300
2 0 0
IOO
D E A D LO A D |g .N ,
fS
TJ
JLi
M9"
W/M
nfe
>3
JL
t
>
3W
3^
nd
9i
a
**»
*
-£
£
30
Ca l i s k a t ion of im s t k-u^ e n t aTiom used to Me<vsuee l o a d .
$ &
g
H I P
<
3
J
<
0
<L V K
31
pi
6
. q
lo Vd WI -AO In IO J
i.
DJt-I- «» 3 6
vn
3 9
a 2
a 9
o^ ui O oI
.a.
.1
§ ;
o < S
L
jj, 0 s8’ u. iij^ 9 o LL
C
c
c o v9 Cl z 0&
0u-U)
O
B c— C
C
C
t
n
•
c
c
c
c
_ c
S
T
e
e
s
<b
/
40.
e = 5o o s
:z.
b
I
IO
* O'lo
w>C. 0‘
o
S T I2A1W
e
ST££SS £>T£A)N RESULTS Foe. DIFFERENT STg/MN RATES
TR
UE
S
T
R
E
S
S
20
N£
2
b
ENGINEERING STRAIN e
S TRESS - STRAIN CHARACTERISTICS F O R LEAD.
FIG. 12.
34-TR
U
E
S
T
R
E
S
S
40
30 O
x
I Z b 20O'Z
o-o
ENGINEERING STRAIN e
STRESS-STRAIN CHARACTERISTICS FOR ALIMINIUM ALLOV.
FIG, 13
CHAPTER 3
ANALYSIS USING A NUMERICAL TECHNIQUE
3.1 Introduction
In order to study theoretically the deformation mode and hence assess the influence of friction, material inertia, and strain rate sensitivity on the forging load in simple upsetting, a numerical technique has been employed. From this the billet profile, the tup load and velocity can be determined at any stage
during the in-process time associated with the simple upsetting of cylindrical billets. The stress and strain time history at any point within the billet can also be determined.
3.2 The Numerical Technique
In this technique a lumped-mass model is used for the ; \
actual billet and is based on the following assump tions:
(a) The billet is made up of a number of concentrated connected masses connected_to each other by
massless links of circular cross section which possess the same strength properties as the material of the billet.
(b) The plane sections remain plane throughout the deformation process.
(c) Uniform axial straining occurs within each individual link.
(d) The frictional stress in the billet-tup inter face is proportional to the normal stress in the face of the billet.
(e) The radial expansion for each connecting link is governed by the condition of volume constancy. (f) There is no resistance to radial expansion of
any link from the neighbouring link except for the links in contact with the top and bottom platens in which case interface frictional force resists radial expansion.
The procedure amounts to expressing the dynamic force equilibrium equations for each concentrated mass point in finite-difference form and relating the displace ment of each mass point to the strain in the corres ponding link after each time increment. The stress
in each link, and hence the axial force, is then determined from the material stress-strain
characteristics.
SYMBOLS
A annular area in the cross-section model
D material strain-rate constant
E elastic modulus
N axial force
P material strain rate constant
R current billet radius
m mass per unit length
As link length in the numerical model
At time increment
u,v displacement x,y co-ordinate axis
e engineering strain
a stress
Subscripts
i this refers to the mass point number and the
preceeding link
j time position
1 refers to the subannulus number
r refers to the annulus number
Superscripts
m modified value
t trial value
(•) single differentiation with respect to time (**) double differentiation with respect to time
The general equation of motion for an element of the billet, soon after the tup strikes the top face, can be derived by considering the internal forces acting on the element as shown in Fig. 14(a) and is given by
Fig. 14(b) shows the lumped parameter model for a number of elemental lengths of the billet shown in Fig. 14(a). For convenience each elemental length As will be considered to consist of one concentrated mass and a massless link and initially all elemental
lengths to be equal. This model replaces the actual billet by a mass-link system. Under the action of the
0 (1)
internal and inertia forces the position of each concentrated mass in the model identifies the
position of a corresponding elemental length of the actual billet. The finite-difference equation for the elemental length at the ith location of the model in Fig. 14(b) is given by
N. 1+1,1 - N. . - As rn.ii. . =--- 0 --- (2)i,J o 1J
Equation (2) applies to all the elemental lengths along the billet and gives the instantaneous value of
the acceleration u.i,J+l .... for any instant of time t .... .
1+1
Using finite difference notation the relation between displacement and time takes the form shown in Fig. 15
u. . + ij+11 = u • . (<5t ij )2 + 2u. . - u. . ij ij-l1 --- (3)
where 6t = t . - - t. --- (4)J J
When equation (2) is combined with equation (3)
instantaneous values of u. i,J+l for any instant of timey
t.,- can be determined. J + 1
In order to facilitate the calculation of stress which may vary across the cross section of the billet, it is necessary to idealise the actual cross section to an equivalent cross section model which consists of a number of annulv across each of which the stress is
assumed to be uniform. The circular cross section of the billet is assumed to consist of n discrete annuli, of material which can carry normal stresses. These annuli are considered to be separated by a material
which can not carry any normal stress but has infinite shear rigidity.
With this simplified model the stress in the billet can be defined by the individual normal stresses at the n separate annuli without having to contravene the
assumption that plane sections remain plane throughout the deformation process. The cross sectional area of each tubular layer can be calculated by equating the fully plastic pure axial load carrying ability, with
that of the actual cross section of the billet. A typical cross section model is shown in Fig. 17.
In order to describe the elastic-plastic stress state
in ar\ awyulus of the section-model, further idealisation
is made and each annulus is assumed to consist of sub annuli the number of which is determined by the number of positive sloped sides in the approximated polygonal stress-strain diagram shown in Fig. 18.
Fig. 19 is used in establishing a relationship between subannular area and its parent annular area
Assume that the deformation has reached stage B, ie sublayer Ar^ _ ^ is loaded elastically to the
condition a1e1 and the remaining subannular areas are
loaded to the condition a2£2«
The stress is the hypothetical stress that the
subannular area would have to be subjected to if
it were stressed elastically to a strain value of £2*
o is similarly related to £3 for the subannular area
Ar(l+1)‘
Equating forces NOTE: Ap = Ar(£_1) + Ar£ + Ar(^+i)
(1+1)raB (5)
°BA(1-1)r
= Ar(QB - cf 2 )
(cb - a1)
If the slope of OA = E, = ^ = E = Young's modulus
and the slope of AB = E2 o’ E22 "O’ -E11
and the slope of BC = E = -^-3 £ 33--f-—£ 22
then
Assume deformation has reached Stage C. Equating forces
a3Ar " A(l-l)rai + AlraB + A(l+l)raC (7)
combining equations (5) and (6)
o3\ a2Ar A(1+1)raB + A( 1+1 )raC
Ar(a3-a2) A(1+1)r^aC aB^
A (1+1)r = A (a3"a2)r
_ E_3_ (£ 3-£2) a E (£3-£2) r
_ E3 Ar ( 7 )
E
To find Alr
A-p A-pEq
Alr = Ar - X [El-E=] - - ¥ ■
= -^[E2 - E3 ] (8)
If the number of subannuli is reduced to two to be compatible with stress strain diagram shown in
Fig. 06) then the two. sul>tUvv\uUf areas A .. and Arl r(l+l)
relationships
Arl = 1 ^ [E1 - El+1] --- (9>
and
Ei+i
A /1 . 1 \ = A -4— ^ --- (10)r(l+l) r E ^
When the number of positive sloped sides in the
approximated polygonal stress-strain diagram exceeds two, the sukatmulof areas, as a fraction of the annular area, for any two adjacent positive sloped sides, can be obtained using equations (9) and (10) where E-^ is as defined in Fig. (20).
Knowing the suba*mu(af stress a . irl,j-l at time t . . atj-1
the 1th <iut>annu(c of the rth a^u(us at the ith link and t
the strain increment 6e. .at time t. at the rth annulusir, j j
of the ith link, the subannular stress a. , .at timel r 1, J
t., at the 1th sukannuU is determined as follows.
First a trial value irl, 3.of the sukannulaf stress
a. irr, j. is calculated by assuming an elastic path,
thus
at .. . = a. , . 1 + E6 e . . irl,j irl,j-1 ir,j (11)
Once the trial value is calculated, the correct value can be ascertained by using the following conditions:
Let a ^ be the su b a * > \ u l a r yield stress and be given by
a ^ = E ^ , where is the strain defining the 1th
corner of the polygonal stress strain diagram.
Denoting j as for convenience,
t t
If -ayi < Gi < ayi then a-^ =
If 1 < -a ,y i
If a, > a ,i y i
then an = -a ,1 y i
then an = a1 y i
This procedure is applied to all subawnuli
cxv\*%vaU for all the links.
(12)
of each
The values of the subavmufar stresses for the links in
immediate contact with the tup and the anvil are then modified, to take into account the interface friction, by using the equation,
a = crQ [l + 2p(R-r)/h] (13)
Following the terminology applied to the numerical model this equation could be written as
J = aU [1 + 2^ Ri-Rir>/h] (14)
where p is the interface friction coefficient, and an .1 > 3
is the subav\wulaf stress determined by equations (1 2).
After this modification, the axial forces N. .ini,J
each link are then obtained from the equation n k
N. . = ■ Z E a.
=1 1=1 irl»J
where A, . is the current suWcuuvuta/' area, i, J
(15)
If the links can be assumed to have the same mass
density as the billet, then further modification to the values of the sut cupular stresses can be made to
take into account the effect of radial inertia of the billet material, by using the equation
Equations (13) and (16) are detailed in appendices 1 and 2.
In its existing form, when using the present numerical approach the time increment cannot be chosen
arbitrarily. The value of the time increment should be less than the time needed for the elastic stress wave to propagate through the length of the link.
3.2.1 Strain Rate Sensitivity
To take into account strain rate sensitivity the stress strain behaviour of the material, for different strain rates, must be known. Approximated stress strain
diagrams are shown in Fig. 18, and referring to equations (3) and (4), namely
a = oq + 3pv2(R2-r2)/8h2 (16)
(
4
)
(3)
The change in length of the element S(AS)^ .+^ of the link occurring during the time interval 6t is
(17)
The strain increment and strain rate occurring in the link during the time interval are:
6 (AS). ._
Sc; = LlJ±1 (18)
i»J+1 AST1,0
where AS. i,o is the original &
length of the link and
Se.
e. , + 1 = —i,,J + l St --- (19)
The total strain in the link can now be determined from:
e. i,J + l i >3 + i>J + lh + (20)
e. .... = e. . + fie. .... --- (21)i,j + l i,j i,l+l
since the time interval and, hence, the strain incre ment are both small.
A computer simulation based on the lumped parameter model can be used and strain rate sensitivity
incorporated into the analysis in the form of a stress-strain rate law. For lead the law
I
o = cfi[l + (-■— -?•- P ] was used as detailed in Chapter
2
.
A N E L E M E N T OF T M E B>1LL£T
FIG. 14a.
Mi Ltnb. C
N c H i
W\v.-t
E Q U IV AL E N T F IN IT E - D lC T E g -E N C E /W O P & L
FIG. 14-b.
tj-l fcj fcJ*l
F IN IT E D IF F E R E N C E . T IME P IS P LA C E M E LN T tz g L M IO N & U IP
PIG. 15,
<fci Ct
(
E L A S T IC E>lMAey STRAIN H A PPEN IN G S T R E S S S T R A IN PfcOPEfcTV
ANNULUS AREA A r
NOTE: A = Ar(£_i) + ArA + Ar(&+1)
PIG. If
SUBANNULAR AREA
" A f L
c e o s s SECJ tOM M O DEL OF &1U-ET_
O F S TR A IN K A TE S E N S IT IV IT Y .
cr, in
in
UJ ci! H
iH
cr-.
APPROXIMATED POLYGONAL STRESS STRAIN DIAGRAM
FIG. 18
a t
For each positively sloped side there is one sub-annular area.
STRESS STRAIN DIAGRAM, IDENTIFYING SYMBOLS USED
IN TMEOI2.&TICAL A N A L Y S IS p \ Q , \<^
s
t
r
e
s
s
I
slo|3e. corrz.s,iponclin^
t o SU^anrvU.(l(£ ^
S T R A I N
e £
A P P R - O X l A A A T e P P O L Y G O N A L S T & F S S S T R . A 1 N D I A G R A f A
f i g .
ao
1 Introduction
Simple upsetting or dynamic compression of cylindrical billets is one of the most commonly used and relat
ively simple operations used to increase the diameter of the billet. The dimensions of larger sized billets are usually changed by hot upsetting at moderately high speeds and hence the forging load is influenced by interface friction and strain-rate sensitivity of the material. The object of this part of the work is to investigate the effects of friction and strain rate sensitivity on the forging load and final shape of the billet, both experimentally and theoretically.
2 Experimental Work
Simple upsetting tests were carried out under the drop hammer and a different degree of deformation was
imparted to each billet by releasing the tup from different heights. For each test the following data were obtained:
(a) the forging load (b) impact velocity
(c) deformation-time history.
The deformation sequence of a number of test specimens were recorded using a Hi-Cam high speed camera.
Using the drop hammer set to give maximum impact, velocity tests were carried out on lead billets
54-25 mm diameter x 24 mm long and aluminium alloy billets 19 mm diameter x 19 mm long. Two types of friction condition were studied, one, using a paste of graphite in petroleum jelly as lubricant to induce low friction and the other, without any lubricant, to induce dry friction conditions. High speed photographs were used to obtain experimental data giving instantaneous billet profiles and tup-displacement-time curves.
Elastic strain hardening and stress-strain character istics of the billet material were obtained from quasi static tests. The dynamic stress-strain properties were established from drop hammer tests (described in Chapter 2).
The load time variation was obtained from the tracings recorded on the oscilloscope. A typical photograph of such a trace for an aluminium alloy billet is shown in Fig. 21.
4.3 Theoretical Predictions
In order to predict the results theoretically, the numerical technique described in the previous Chapter was employed. In predicting the results it was assumed
that a constant frictional coefficient m = 0.06 existed
for both lead and aluminium billets. This value of m
was thought to be a reasonable estimate of what graphite in jelly would induce. For dry test conditions the
value of m = 0.577 was incorporated in the analysis for
lead billets [51] while for aluminium billets M = 0.18 was used [59].
The actual loading configuration and its equivalent numerical model, applied to both the lead and
aluminium billets, is shown in Fig. 22. The quasi- statically obtained stress strain characteristics and their polygonal approximations, as required by the numerical technique, for lead and aluminium alloy used for these tests are shown in Fig. 12 and Fig. 13
respectively.
4.4 Result-s and Discussions
The instantaneous profiles of a lead billet at various instants of time after the onset of the process were obtained from the high speed photographs and are shown in Fig.23(a). This test was carried out under lubricated conditions. The billet deformed in such a manner that the profile shape remained right cylindri cal throughout the deformation process. The
theoretically predicted instantaneous profiles for the same billet are shown in Fig.23(b) which shows profile shapes having either upwards or downwards directed
slightly tapered sides. Slight barrelling also becomes apparent in the profiles corresponding to higher
reductions in billet height. This slight discrepancy is thought to have arisen due to instability in the technique used. Experimentally it was not possible to identify such behaviour.
The instantaneous profiles shown in Fig. 24(a) for a lead billet deformed under dry lubrication conditions are seen to compare reasonably well with those in Fig. 24(b), which were predicted using the numerical technique. The die load determined experimentally was plotted in Figs. 25 and 26 against reduction in billet height measured from the high speed photographs for lead and aluminium alloy billets respectively, both tests being carried out under lubricated conditions.
The theoretically predicted curves are also included
in the respective figures for comparison* It can be
seen that for the lead billet both theoretical curves predict' lower die loads. For 14.4|mm reduction in height
the curve excluding the strain rate term predicts a load which is 38% of the actual load, whereas the curve including the strain rate term predicts a load which is 60% of the actual load. The effect of strain rate is clearly shown by these two theoretical curves. During the initial stages of deformation the theore tical curve matches closely with the experimental curve when strain rate sensitivity is incorporated in the analysis. For greater deformation
the frictional effect becomes predominant. The discrepancy between the theory and experiment for
larger deformation may thus be attributed to frictional effect. Although the effect of friction has been
incorporated in the analysis, in reality the coefficient of friction may change from what was assumed
originally, generally becoming much higher and
approaching that of sticking friction in hot forging.
Since aluminium alloy is not a strain rate sensitive material, only a single theoretical load curve is shown. The load predicted is comparable with that obtained experimentally, being slightly higher during the initial part of the deformation and slightly lower thereafter.
In order to compare the effect of friction the die
load/deformation curves obtained experimentally for the aluminium alloy billets under lubricated and dry
conditions are plotted in Fig. 27. The corresponding predicted curves are also shown in this figure. It
is seen that a maximum increase in die load of less than 10% occurs for reductions of billet height of up to 3 mm
(16%). The increase in die load due to friction as predicted using the numerical technique is much
less than that obtained experimentally.
The increase in friction, when the billet is deformed under dry test conditions, results in increased
barrelling of the billet. Fig. 28 shows the increase in radii at the middle and top section of the aluminium alloy billet. The extent of barrelling can be readily appreciated from this figure. The theoretically
predicted results suggest slightly less barrelling of