Published Online February 2014 (http://www.scirp.org/journal/jwarp) http://dx.doi.org/10.4236/jwarp.2014.62017
Quantifying in-Stream Processes on Phosphorus Export
Using an Empirical Approach
Soni M. Pradhanang1*, Rajith Mukundan1, Mark S. Zion2, Elliot M. Schneiderman2, Donald Pierson2, Tammo S. Steenhuis3 1
Institute for Sustainable Cities, Hunter College, City University of New York, New York, USA 2
New York City Department of Environmental Protection, Kingston, USA 3
Department of Biological and Environmental Engineering, Cornell University, Ithaca, USA Email: *[email protected]
Received October 27, 2013; revised November 29, 2013; accepted December 24, 2013
Copyright © 2014 Soni M. Pradhanang et al. This is an open access article distributed under the Creative Commons Attribution Li-cense, which permits unrestricted use, distribution, and reproduction in any medium, provided the original work is properly cited. In accordance of the Creative Commons Attribution License all Copyrights © 2014 are reserved for SCIRP and the owner of the intel-lectual property Soni M. Pradhanang et al. All Copyright © 2014 are guarded by law and by SCIRP as a guardian.
ABSTRACT
In-stream nutrient release and retention control the timing and quantity of export at the watershed outlet by mobilization and transport of phosphorus (P) sources from land to the channel, and remobilization of transient stores of P from stream beds. We investigated the significance of stream processes in regulating P loading to the Cannonsville watershed, NY, USA. A mass balance of estimated P inputs to the stream with observed P export at the watershed outlet was used to quantify P delivery and explore the behavior of P. Stream channel transport of both dissolved and particulate P is found to be non-conservative, with dissolved P being retained during low flows and particulate P released during high flows. The results suggest that differences in the magnitude and relative importance of in-stream biogeochemical processes under different flow regimes regulate P delivery in ways that may influence ecological impacts to downstream river reaches and reservoirs.
KEYWORDS
Point Sources; Non-Point Sources; P Release and Retention; Linear Mixing; E-EMMA
1. Introduction
Phosphorus (P) contamination of surface waters origi-nates from sources such as agriculture, municipal sewage treatment plants, individual septic treatment systems, decaying plant residue, runoff from urban areas and con-struction sites, stream bank erosion, and wildlife. In the Cannonsville Reservoir watershed, NY, P losses from agriculture are known to be a major source of P entering streams and the reservoir [1]. The downstream ecological impacts of P inputs are heavily dependent on the extent to which they are physically retained and/or chemically and biologically processed (Edwards and Withers, 2007; Withers and Jarvie, 2008). The net effects of the attenua-tion, retenattenua-tion, and processing of P are usually ignored in watershed management, where the primary focus is source control. In-stream processing of P loads may ac-count for the apparent disconnect between measures
im-plemented to reduce P inputs and improvements in water quality and ecology at watershed scale [2]. In rivers with P retention occurring during low flow conditions, with the P retained in the river bed subsequently transported during storm events. The release of P can occur within or between years [3,4] and can be along the longitudinal continuum of a single basin [5]. In-stream processes un-der low and intermediate flows may modify quantity, bioavailability, and timing of nutrient delivery in ways that reduce downstream eutrophication risk [6].
Watershed nutrient mass balance estimates require de-tailed data on topography, land use, soils, watershed management practices, and point source inputs. Total P inputs to the stream channel network are the sum of all the nonpoint and point sources in the watershed. These inputs can then be compared with the P loads at the wa-tershed outlet. Such analysis provides an estimate of net gain and loss. Uncertainties in P, storage and transforma-tion in the stream channel network may add considerable
uncertainties to P export estimates independent of the uncertainty in watershed inputs [7]. Understanding the ability of streams to accumulate, transform, or release P under differing hydrologic conditions is essential for un-derstanding watershed scale P export to downstream areas [7,8].
In its simplest breakdown, P can be transformed bio-geochemically between dissolved phosphorus (DP) and particulate phosphorus (PP) during transport process. The pools of DP and PP are not static in surface water. DP may be taken up by plants, algae, microorganisms or may be bound by minerals or sediment to form PP [2]. Phos-phorus readily adsorbs onto particulate matter and is commonly transported in the particulate form. Episodic transports occur during high flow events when inputs of particulates are high and in-stream retention is low [9]. The study by Doyle et al., [10] showed that both low flow and moderate floods maintained the P budget with low flows dominating P retention and moderate floods maintaining the output predominantly as PP. The stream bed sediments act as a sink, accumulating inorganic P from point sources during low flow periods. Discharges at different flow conditions can be expected to have dif-ferent ecological effects for a given stream and are ne-cessary to maintain long term nutrient balance [11]. The entire range of discharges will influence differing eco-logical processes, with a certain ecoeco-logical variable (e.g., nitrate load, periphyton accumulation, phosphorus loads) being most influenced by a particular portion of the hy-drologic regime.
Few studies estimate and address the impact of P con-trol measures on in-stream P retention over a range of flow conditions [12]. P retention during spring and early fall and release of stored P during winter were reported by [13] in a study of River Cherwell in Oxfordshire,
England. McDowell and Trudgill (2000), in a study of
South Devon, England reported that episodic release of P in summer mostly attributed to direct cattle access to stream, increases in soil P in summer from warmer tem-peratures, and P inputs via fertilizer or effluent spreading. These studies however did not address whether the P concentration were related to DP or PP. Meyer and Li-kens [8] reported that net P retention was inversely re-lated to discharge, i.e., as discharge increases, less DP was retained in their study reach. Retention of nutrients is of critical importance to the operation of stream eco-systems because the availability of food resources to aq-uatic organisms is largely determined by the nutrients retained. Retention of dissolved nutrients permits levels of primary production and microbial growth necessary to support grazing invertebrates [14]. Consumers in the upper food chain of streams, such as fish that rely on invertebrates for food are thus dependent on retention processes to supply food resources for their invertebrate
prey. The amount of retention is determined by a com-plex interaction of valley floor geomorphology, riparian conditions, and in-stream biological demand that accen-tuates the intimate linkage between aquatic and terrestrial ecosystems.
Understanding the net effects of P release and reten-tion processes in watersheds is important in the interpre-tation of effective management, remediation, and restora-tion measures. Such an understanding may also be in-corporated in water quality models to improve the mag-nitude and timing of nutrient predictions. The goals of this study were to analyze in-stream P processes under different flow regimes, and evaluate possible variability due to flow, season, release, and retention processes us-ing data from a number of different events. This analysis could potentially be used to examine the scale and varia-bility of DP and PP retention and release, as an aid to watershed management, and to improvise in-stream pro- cessing algorithms in existing water quality models.
2. Methods
2.1. Study Site
The Cannonsville Reservoir Watershed (CRW) is a New York City (NYC) water supply watershed located in the
Catskill region of New York State (Figure 1). The
wa-tershed drains an area of 891 km2 above the USGS
[image:2.595.310.538.519.718.2]gauging station (#01423000) at Walton and is predomi-nantly forested (67%), agriculture (23%), and brush lands (6%). The elevation of the watershed ranges from about 300 m near the watershed outlet to about 1100 m near the headwaters. The mean annual precipitation in this region is 1100 mm [15] and mean annual water yield is 601 mm of which 64% is baseflow and 36% surface runoff [16] based on standard hydrograph separation techniques [17].
As part of efforts to ensure high water quality in the Cannonsville Reservoir, the New York City Department of Environmental Protection (DEP), in cooperation with other watershed stakeholders, has implemented a number of watershed management programs. The watershed agricultural programs in the CRW include whole farm plans to protect water quality from agricultural pollution, with particular emphasis on waterborne pathogens, nu-trients and sediments. The program also helps farmers to keep livestock out of streams while managing their crop-lands and pasture crop-lands in a manner that reduces stream-side disturbances and other potential impacts. Regulatory upgrade programs for waste water treatment plants (WWTPs) provide for the design and installation of highly advanced state-of-the-art treatment of WWTP effluent. The CRW has eight WWTPs.
There is a long record of water quality data collected at the Beerston, NY site close to CRW outlet with the specific goal of accurately estimating the dissolved and particulate nutrient loads to the Cannonsville Reservoir (Figure 1). Frequent sampling captured the variations in concentration occurring during all major storm events as well as seasonal variations in baseflow concentration
(Longabucco and Rafferty, 1998). Figures 2(a) and(b)
show time series line plots for DP and PP concentration from 1996 to 2008. For this study, we used 5 years of data to evaluate the effects of P retention and release on the P loads estimated at the watershed outlet; 1997 (be-fore rigorous implementation of watershed level best management programs (BMPs) addressing both point and nonpoint source pollutants), 2001, 2003, 2005 and 2008 (post BMP implementations). These are also the years when cattle data are available. We chose the four post BMP implementation years to evaluate progressive changes in in-stream nutrient retention and release processes. These years also include both a low flow (2001) and a high flow year (2003).
2.2. Mixing Model Analysis
In this study, we adopt a simple empirical approach Ex-tended-End Member Mixing Analysis (E-EMMA) [6,18] (Figure 3) for quantifying P delivery to explore P net retention and release at the watershed outlet. This ap-proach enabled us to utilize water quality monitoring data, and point source data to quantify the impacts of in- stream and watershed P processing on P delivery at the watershed scale. The point source data we used for this study included WWTP effluent nutrient concentrations and estimates of nutrients directly added in-stream by cattle before and after the implementation of watershed management programs that excluded cattle from the stream in CRW.
With E-EMMA, the P load is plotted against flow for two end-member component mixing series. The nutrients
(a)
[image:3.595.311.535.84.516.2](b)
Figure 2. Time series of monthly averages of measured (a) DP and (b) PP concentration at Beerston site close to CRW.
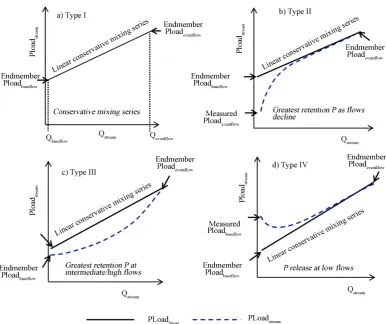
Figure 3. Schematic diagram showing the four main types of relationships between stream P load and stream flow: (a) Type I (conservative mixing series); (b) Type II (Greatest P retention as flows decline); (c) Type III (greatest P retention at interme-diate/high flows); (d) Type IV (P release at low flows) (Adapted from Jarvie et al., 2010).
undergoing significant net uptake or release as a result of deposition of PP, remobilization of P, sorption to sedi-ments, or interaction with biota. In contrast, a nonlinear mixing series would indicate that P was behaving non- conservatively. Nonlinear behavior under low-flow con-ditions is assumed to result from within-stream physical and biogeochemical changes on nutrients resulting in release or retention of nutrients. Nonlinear behavior un-der intermediate and higher flows represents the net ef-fects of in-stream and watershed retention/mobilization [6]. Under such conditions, P undergoes net uptake or release due to deposition and adsorption to sediments, remobilization of P or utilization by plants, algae or mi-crobes in stream. By comparing an observed nonlinear relationship between stream P load and stream flow measurements, with a theoretical linear conservative mixing series between the baseflow and eventflow end- member P loads, the net effects of P retention and release can be directly quantified.
2.3. Phosphorus Release and Retention Calculation
DP and PP loads for USGS gage (#01423000) at Walton
were used to illustrate how E-EMMA can be used to es-timate net losses and gains of P at the watershed outlet. The baseflow end-member P load (PLoadbaseflow) repre-
sents the sources of P to the stream that contribute under dry weather flow conditions. “PLoad” is used herein as a standard term to represent either DP or PP. These loads include the sum of the effluents of the eight WWTPs (PLoadEffluent), direct contributions from cattle in stream
(PLoadCattle), and any background groundwater sources
of P, which in this analysis were considered to be absent (assumptions outlined in Section 2.2):
Baseflow Effluent Cattle
PLoad =PLoad +PLoad (1)
Baseflow P load was calculated each individual year and is assumed to correspond to the lowest ten percentile daily flow value (Q10). This end member was needed to
create a linear mixing line as illustrated in Figure 3. The P loads for each upstream WWTP were obtained from DEP and P loads for cattle in stream were calculated based on the animal units, number of hours spent in stream and the manure produced during a day that is dropped directly into the stream. The method for calcu-lating P loads from the cattle in stream can be obtained
(PLoadeventflow) is an integration of all the watershed-wide
sources of P including non-point and point source and P mobilized from within the stream channel network and is estimated for each year from measured rates of Ploading:
90
Eventflow th
PLoad =PLoad (2)
where, PLoadEventflow is the stream water P load end
member during high flow conditions and PLoad90th is the
P load corresponding to the highest tenth percentile daily flow (Q90). So that potential outliers do not skew the
end-member calculation, PLoad90th is estimated from a
locally weighted smoothing (LOWESS) [19] of the rela-tionship between daily P load at the outlet (PLoadOutlet)
and daily discharge at the outlet (Q). The LOWESS
smoothing used in this analysis is 0.5 with two steps. Given the low water residence times and greatest effi-ciency of P delivery under highest flows, the impact of P retention on PLoadEventflow is likely to be relatively low.
Therefore, the PLoadEventflow is taken as the reference
point for the integrated watershed eventflow end-member, at which there is no net P retention. The end member values can then be used to derive a line describing PLoad
versus Q, with the two end member points
(
Q90,PLoadEventflow)
and(
Q10,PLoadbaseflow)
:(
)
Linear Outlet Gradient Intercept
PLoad = Q ∗ PLoad +PLoad (3a)
(
)
(
90 10)
Gradient
Eventflow Baseflow
PLoad
PLoad PLoad Q Q
= − − (3b)
90
Intercept Eventflow Gradient
PLoad =PLoad −Q PLoad (3c)
To estimate the net P retention or release, measured values of PLoadOutlet were then compared with the
cor-responding esitmated P load derived from the conserva-tive mixing model (PLoadlinear) as illustrated byFigure 3.
Separate values of PLoadEventflow, PLoadBaseflow and the
resulting PLoadLinear line are calculated for each year of
the analysis. The P load retained or released (Pprocess) is
calculated for the period of investigation.
(
)
Process Period Outlet Linear
P =
∑
PLoad −PLoad (4)PProcess will be positive during net release and negative
for net retention of P by stream processes over the period of interest. In this study, differences in PProcess were
eva-luated for various flow conditions, months and events. Different flow conditions consisted of low-flow con- ditions (the lowest 10% of flows), high-flow conditions (highest 10% of flows), and for several intermediate flow conditions, i.e., for moist conditions (10% - 40%), one covering mid-range flows (40% - 60%); and another for dry conditions (60% - 90%). The analysis at flow regime scale provides a simple differentiation between P reten-tion/ release as a result of (i) processes that occur under low flows (within the stream or in near-stream
environ-ments) and (ii) wider P processes along the watershed- stream continuum, under intermediate to higher flows. The analysis at the monthly scale helps to highlight any P processes that can be related to land use activities specif-ic to season, while runoff event (constituting a storm hydrograph) scale analysis allows the influence of size, seasonality, and/or dominant runoff processes of the events contributing to release or retention of P in stream to be evaluated.
3. Results and Discussions
For all the five studied years, the relationships between stream P load (PLoadOutlet) and streamflow were
nonli-near, with none approximating the conservative mixing relationship. Such nonlinear relationships indicate that P
processes in stream are non-conservative. Table 1
presents baseflow and event flow end members and cor-responding P loads. Net P retention or release processes
quantified by comparing the observed curvilinear
PLoa-dOutlet versus stream flow relationships with
correspond-ing P loads calculated uscorrespond-ing the correspondcorrespond-ing linear
mixing model, for each flow regime i.e., low, dry,
mid-range, moist and high flows are presented in the following section.
3.1. Dissolved Phosphorus Processes
3.1.1. By Flow Regimes
Comparison of observed annual DP load at the outlet and load derived from conservative mixing showed net reten-tion of DP. At the annual scale, net DP release/retenreten-tion process (all flow regimes included) ranged from 14% release to greater than 30% retention. During 2008
reten-tion was low and nearly balanced release (Table 2).
When considering different flow regimes, there was net retention of DP in low, dry, mid-range and moist flow regimes for all the five years, while the high flow regime showed release of DP in all of the years (Table 3, Figure 4). Figure 2(a) shows the decreasing trend of DP con-centration from 1996 to 2008 from measured data. The decreasing trend of DP concentration may be attributed to an overall reduced load as the result of watershed management practices and WWTP improvements, as well as stream channel retention of DP from 1997 to 2008. At high flows DP release varied by years.Figure 5
100 80 60 40 20 0 600 500 400 300 200 100 0 D is so lv ed P ho sp ho ru s L o ad ( kg /d ) 1997 200 150 100 50 0 300 250 200 150 100 50 0 D is so lv ed P ho sp ho ru s L o ad ( kg /d ) 2001 250 200 150 100 50 0 1200 1000 800 600 400 200 0 D is so lv ed P ho sp ho ru s L o ad ( kg /d ) 2003 400 300 200 100 0 1400 1200 1000 800 600 400 200 0 D is so lv ed P ho sp ho ru s L o ad ( kg /d ) 2005 250 200 150 100 50 0 1000 800 600 400 200 0 D is so lv ed P ho sp ho ru s L o ad ( kg /d ) 2008 60 50 40 30 20 10 0 100 80 60 40 20 0 2008 40 30 20 10 0 40 30 20 10 0 2005 50 40 30 20 10 0 120 100 80 60 40 20 0 2003 20 15 10 5 0 30 25 20 15 10 5 0 2001 35 30 25 20 15 10 5 0 70 60 50 40 30 20 10 0 1997
Streamflow (m3/s)
Streamflow (m3/s) Streamflow (m3/s)
[image:6.595.101.487.85.599.2]Streamflow (m3/s) Streamflow (m3/s)
Figure 4. Scatter plots showing non-conservative behaviors of DP. The points show the daily observed P loads and flows, light grey line show the LOWESS smoothed (50%) line through the daily points and the dark lines show the E-EMMA line with the endpoints of Ploadbaseflow and Ploadeventflow. Daily points above the E-EMMA line represent P release while points below the
line represent P retention. Inset figures are zoomed extent (up to 90th percentile flow and corresponding P load) of curvilinear relationship.
[20] allowing greater interaction with sediments and bi-ota and thus greatest potential for biogeochemical cycl-ing [6]. There is also potential for P retention as a result of an increased proportion of total flow being stored in hyporheic sediments under baseflow conditions. There
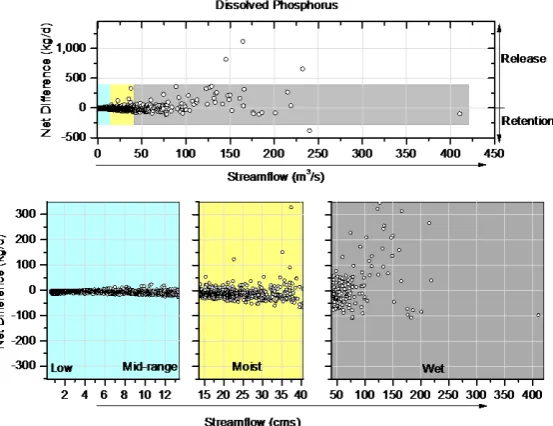
Figure 5. Scatter plots showing conservative behaviors of DP for all five years. The top scatter plot shows streamflow and net difference in P load for all five years. Bottom three plots are zoomed portions of the region highlighted in the top plot. The blue region indicates the low to mid-range flow regimes, the yellow region indicates the moist region, and the grey plot indi-cates the high flow regime. Points above the zero net difference indicate release of P and points below indicate retention.
Table 1. Baseflow and event flow end members and
corre-sponding P loads. (Note: Loads correcorre-sponding to the base- flow end member are from the observed P load. P load cor- responding to eventflow end member are loads from LOWESS fit).
Year End-member Flow (m3/s) DP load (kg/d) PP load (kg/d) 1997 Baseflow 0.75 15.26 6.67
Event Flow 31.05 66.16 69.85 2001 Baseflow 0.65 10.75 3.8
Event Flow 19.11 24.97 23.6 2003 Baseflow 5.66 13.84 3.8
Event Flow 48.34 105.88 114.26 2005 Baseflow 0.71 3.22 3.15
Event Flow 35.32 36.6 252.67 2008 Baseflow 1.58 4.90 2.62
Event Flow 55.08 83.04 59.89
low and intermediate flows. In-stream processes under low and intermediate flows may therefore reduce deli-very and modify the timing of DP loads to the stream outlet.
3.1.2. By Month
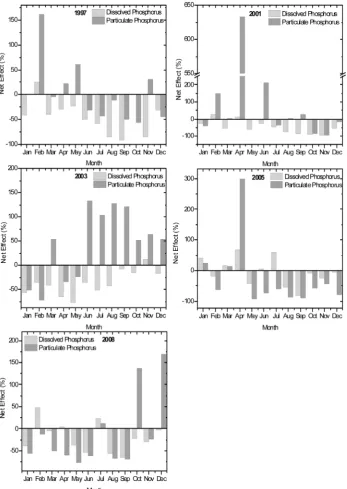
In order to further understand P retention and release processes, we analysed the P processes data by month. There was no distinct pattern of the retention or release processes observed on monthly basis, however DP was generally retained in more months than it was relaeased. DP was released during February for 1997, 2001 and 2008, and also during November of 1997 and 2003 (Figure 6). There was one instance during 2008 when
Table 2. Comparison of observed annual stream P loads (kg) and load derived from the conservative mixing analysis. Difference between observed and conservative loads con-stitute either net loss (retention) or net gain (release).
Year Retention/ release (kg) (±)
Retention/ release (%)
Retention/ release (kg) (±)
Retention/ release (%) Dissolved Phosphorus Particulate Phosphorus 1997 −11.05 −31.9 4.2* 19.2* 2001 −5.92 −33.0 36.01* 260.1* 2003 −17.87 −30.88 28.49* 50.32* 2005 3.01* 14.39* 57.45* 42.42*
2008 −1.39 −3.88 −1.18 −4.66
Table 3. Comparison of observed stream P loads (kg) and
loads derived from the conservative mixing analysis at dif-ferent flow regimes. Table lists percent difference between observed and conservative loads constitute either net loss (retention-negative) or net gain (release-positive).
P Loads (%)Flow Regime 1997 2001 2003 2005 2008
High 2.5* 286.6* 2.3* 76.1* 38.7*
Moist −28.3 −0.2 −40.7 −25.5 −23.2
DP (%) Mid-range −47.1 −30.6 −54.3 −25.7 −47.6
Dry −69.3 −78.1 −56.5 −25.2 −54.5 Low −90.2 −92.8 −53.3 −84.6 −63.9
P Loads (%)Flow Regime 1997 2001 2003 2005 2008
[image:7.595.57.288.418.560.2] [image:7.595.306.539.577.736.2]
Figure 6. DP and PP processes by month. The negative net differences indicate retention of nutrients and the positive net difference indicate release of corresponding nutrients. These plots are based on daily measurement
unusually high summer streamflow and DP release occurred. Such release may again be due to episodic rain during summer months that resulted in nutrient mixing and release from channel or near stream sources.
Average streamflow during July of 2008 was 14.4 m3/s and the least was during 1997 (1.5 m3/s). DP releases observed during February and November for certain years can be attributed primarily due to large storm events that occurred during those months.
3.2. Particulate Phosphorus Processes
3.2.1. By Flow Regimes
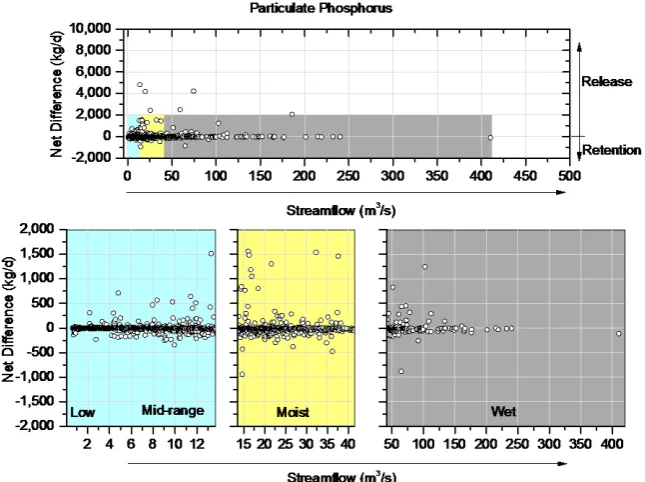
1996 to 2008. The release of PP may be attributed to extremely high P load associated with high streamflow that was observed during certain high flow events during the studied years. PP stream processing analysis at dif-ferent flow regimes (Table 3, Figure 7) showed that during 1997 there was a net PP release at all flow rates.
During 2001 and 2003 there was net release at high and moist flow regimes; and during 2005 and 2008 there was PP release only at high flows. Over all years PP release was always occurred during high flow, and PP releases at high flow were always the greatest calculated in any year (Table 3, Figure 8).
Streamflow (m3/s) Streamflow (m3/s)
Streamflow (m3/s) Streamflow (m3/s)
250 200 150 100 50 0 3500 3000 2500 2000 1500 1000 500 0 P ar ti c u la te P h o sp h o ru s L o ad ( k g /d ) 2003 400 300 200 100 0 35000 30000 25000 20000 15000 10000 5000 0 P ar ti c u la te P h o sp h o ru s L o ad ( k g /d ) 2005 250 200 150 100 50 0 1400 1200 1000 800 600 400 200 0 P ar ti c u la te P h o sp h o ru s L o ad ( k g /d ) 2008 60 50 40 30 20 10 0 70 60 50 40 30 20 10 0 2008 35 30 25 20 15 10 5 0 300 250 200 150 100 50 0 2005 50 40 30 20 10 0 200 150 100 50 0 2003 200 150 100 50 0 5000 4000 3000 2000 1000 0 P ar ti c u la te P h o sp h o ru s L o ad ( k g /d ) 2001 20 15 10 5 0 80 60 40 20 0 2001 35 30 25 20 15 10 5 0 140 110 80 50 20 1997 100 80 60 40 20 0 1600 1200 800 400 0 Pa rti cu lat e Ph os ph or us L oa d (k g/ d) 1997
[image:9.595.100.493.164.675.2]Streamflow (m3/s)
Figure 7. Scatter plots showing non-conservative behaviors of PP. The points show the daily observed P loads and flows, light grey line show the LOWESS smoothed (50%) line through the daily points and the dark lines show the E-EMMA line with the endpoints of Ploadbaseflow and Ploadeventflow. Daily points above the E-EMMA line represent P release while points below the
Figure 8. Scatter plots showing conservative behaviors of PP for all five years. The top scatter plot shows streamflow and net difference in P load for all five years. Bottom three plots are zoomed portions of the region highlighted in the top plot. The blue region indicates the low to mid-range flow regimes, the yellow region indicates the moist region, and the grey plot indi-cates the high flow regime. Points above the zero net difference indicate release of P and points below indicate retention.
P that becomes stored along the stream-watershed continuum (either through physical deposition or by bio-geochemical processes such as sorption to sediments or uptake by biota) will subsequently be available for remo-bilization and thus contribute to the nonpoint-source load (and to the eventflow end-member load) as flows rise [6]. Note that 1997 period was prior to watershed manage-ment activities, including many WWTP upgrades and reductions in cattle presence in the stream. It is therefore possible that net release of PP during 1997 at all flow regimes may be due to activities that might have directly contributed P to stream sediments, including the potential sorption of high concentration of wastewater treatment plant effluent and direct contribution of P by cattle in the stream. The greatest release of PP observed during 2005 may be attributed to few high flow events during spring runoff that produced extremely high P loads to the wa-tershed outlet. The greatest net PP retention under low to intermediate flow conditions for 2001, 2003, 2005 and 2008 are likely the result of net deposition of PP along the watershed–stream continuum.
3.2.2. By Month
PP release varied by months and by years (Figure 6). PP release tended to occur during spring and late fall months and these processes are associated with the high flows of this period driven by the combination of snow melt, pre-cipitation events and high antecedent moisture conditions. Our study also showed that events that occurred during
late October and November months resulted in PP re-lease during 1997, 2003 and 2008. The average flow during November ranged from 15.9 m3/s to 54.2 m3/s An experimental study conducted by Johnson et al., [21] indicated that sediments will release PP and DP when stirred up during storm periods. Their study indicated that particulate forms of P were lost from the watershed almost exclusively during storms and that most of the runoff and P loss occurred in a relatively short time span during which highest discharge rates occurred. Doyle et al., [10] reported from their studies that moderate floods release PP, while retention occurs during low flow con-ditions.
4. Conclusion
ef-forts to reduce P loading to streams. Given the well-de- fined baseflow and eventflow end-members that could be derived from the high resolution Cannonsville P load data, the interpretation here is that the curvilinear rela-tionship (Figures 4and7) reflects net P retention along the stream-watershed continuum during mixing of the eventflow and baseflow end members. The use of end member mixing approach to estimate P processing comes with some limitations. The choice of event flow end member can also influence the magnitude of the esti-mated P processes. Further study is needed to gain fuller understanding of the balance of processes that determine the eventflow end-member load at intermediate to high flow conditions, especially in watersheds dominated by nonpoint export, such as differential erosion associated with events of different magnitudes, intensities, seasons, and pre-existing conditions; re-deposition and other processing active during overland flow; and in-stream processing.
Acknowledgements
We thank the New York City, Department of Environ-mental Protection for funding this research project. We also express our gratitude to Dr. David Smith, Institute for Sustainable Cities, City University of New York for his valuable comments and suggestions.
REFERENCES
[1] E. M. Schneiderman, D. C. Pierson, D. G. Lounsbury and M. S. Zion, “Modeling the hydrochemistry of the Can-nonsville watershed with generalized watershed loading function (GWLF),” Journal of the American Water
Re-sources Association, Vol. 38, No. 5, 2002, pp. 1323-1374.
http://dx.doi.org/10.1111/j.1752-1688.2002.tb04350.x
[2] A. N. Sharpley, P. J. A. Kleinman, P. Jordan, L. Berg- strom and A. L. Allen, “Evaluating the Success of Phos-phorus Management from Field to Watershed,” Journal of Environmental Quality, Vol. 38, No. 5, 2009, pp. 1981- 1988.http://dx.doi.org/10.2134/jeq2008.0056
[3] L. M. Svendsen and B. Kronvang, “Retention of Nitrogen and Phosphorus in a Danish Lowland River System: Im-plications for the Export from the Watershed,”
Hydrobi-ologia, Vol. 25, No. 1352, 1993, pp. 123-135.
http://dx.doi.org/10.1007/BF00007172
[4] E. Wit and J. McClure, “Statistics for Microarrays: De-sign, Analysis, and Inference,” 5th Edition, John Wiley & Sons Ltd., Chichester, 2004.
http://dx.doi.org/10.1002/0470011084
[5] M. J. Bowes, W. A. House and R. A. Hodgkinson, “Pho- sphorus Dynamics along a River Continuum,” Science of the Total Environment Vol. 313, No. 1-3, 2003, pp. 199- 212.http://dx.doi.org/10.1016/S0048-9697(03)00260-2 [6] H. P. Jarvie, et al., “Quantifying Phosphorus Retention
and Release in Rivers and Watersheds Using Extended End-Member Mixing Analysis (E-EMMA),” Journal of
Environmental Quality, Vol. 40, No. 2, 2011, 2010, pp. 492-504.
[7] R. Marcé and J. Armengol, “Modeling Nutrient In-Stream Processes at the Watershed Scale Using Nutrient Spiral-ling Metrics,” Hydrology and Earth System Sciences
Discussussion, Vol. 6, No. 1, 2009, pp. 501-533.
http://dx.doi.org/10.5194/hessd-6-501-2009
[8] J. L. Meyer, G. E. Likens, “Transport and Transformation of Phosphorus in a Forest Stream Ecosystem,” Ecology Vol. 60, No. 6, 1979, pp. 1255-1269.
[9] C. Hupp, A. Pierce and G. Noe, “Floodplain Geomorphic Processes and Environmental Impacts of Human Altera-tion along Coastal Plain Rivers, USA,” Wetlands, Vol. 29, No. 2, 2009, pp. 413-429.
http://dx.doi.org/10.1672/08-169.1
[10] M. W. Doyle, E. H. Stanley, D. L. Strayer, R. B. Jacob-son and J. C. Schmidt, “Effective Discharge Analysis of Ecological Processes in Streams,” Water Resources
Re-search, Vol. 41, No. 11, 2005,Article ID: W11411.
http://dx.doi.org/10.1029/2005WR004222
[11] K. R. Reddy, R. H. Kadlec, E. Flaig and P. M. Gale, “Phosphorus Retention in Streams and Wetlands: A Re-view,” Critical Reviews in Environmental Science and Technology, Vol. 29, No. 1, 1999, pp. 83-146.
[12] D. M. Cooper, W. A. House, L. May and B. Gannon, “The Phosphorus Budget of the Thame Catchment, Ox-fordshire, UK: 1. Mass Balance,” Science of the Total, Vol. 282-283, 2002, pp. 233-251.
http://dx.doi.org/10.1016/S0048-9697(01)00953-6 [13] L. May, W. A. House, M. Bowes and J. McEvoy,
“Sea-sonal Export of Phosphorus from a Lowland Catchment: upper River Cherwell in Oxfordshire, England,” Science of The Total Environment, Vol. 269, No. 1-3, 2001, pp. 117-130.
http://dx.doi.org/10.1016/S0048-9697(00)00820-2 [14] G. A. Lamberti, S. V. Gregory, L. R. Ashkenas, R. C.
Wildman and A. D. Steinman, “Influence of Channel Geomorphology on Retention of Dissolved and Particu-late Matter in a Cascade Mountain Stream,” USDA Forest Service General Technical Reports, PSW-110, 1989. [15] S. M. Pradhanang, et al., “Application of SWAT Model
to Assess Snowpack Development and Streamflow in the Cannonsville Watershed, New York, USA,” Hydrological
Processes, Vol. 25, No. 21, 2011, pp. 3268-3277.
http://dx.doi.org/10.1002/hyp.8171
[16] S. M. Pradhanang, et al., “Streamflow Responses to Cli-mate Change: Analysis of Hydrologic Indicators in a New York City Water Supply Watershed,” Journal of the American Water Resources Association, Vol. 49, No. 6, 2013, pp. 1308-1326.
http://dx.doi.org/10.1111/jawr.12086
[17] J. G. Arnold and P. M. Allen, “Automated Methods for Estimating Baseflow and Ground Water Recharge from Streamflow Records,” Journal of the American Water
Resources Association, Vol. 35, No. 2, 1999, pp. 411-424.
http://dx.doi.org/10.1111/j.1752-1688.1999.tb03599.x [18] C. Neal, et al., “Declines in Phosphorus Concentration in
Science of The Total Environment, Vol. 408, No. 6, 2010, pp. 1315-1330.
http://dx.doi.org/10.1016/j.scitotenv.2009.10.055
[19] D. R. Helsel and R. M. Hirsch, “Statistical Methods in Water Resources,” Elsevier Science, 1992.
http://dx.doi.org/10.1016/S0166-1116(08)71099-9 [20] H. P. Jarvie, E. Lycett, C. Neal and A. Love, “Patterns in
Nutrient Concentrations and Biological Quality Indices across the Upper Thames River Basin, UK,” Science of
The Total Environment Vol. 282-283, 2002, pp. 263-294.
http://dx.doi.org/10.1016/S0048-9697(01)00914-7
[21] A. H. Johnson, D. R. Bouldin, E. A. Goyette and A. M. Hedges, “Phosphorus Loss by Stream Transport from a Rural Watershed: Quantities, Processes, and Sources,” Journal of Environmental Quality, Vol. 5, No. 2, 1976, pp. 148-157.