A Planned Scheduling for Economic Power
Sharing in a CHP-based Micro-Grid
Kanuri Venkatesh1, Barla Pavani2, Pudi Sekhar3
1,2,3
Department of Electrical and Electronics Engineering, VIIT, JNTUK University
Abstract: The Distributed energy resources (DER) capability can be determined by the planning of CHP-based microgrid, at system loads economically, self-sufficient without any utility’s involvement. DERs can be determined by optimal sizes, optimal locations. The loss minimization is obtained by the independent CHP-based DERs types, using Particle Swarm Optimization (PSO) method and loss sensitivity index (LSI). In a microgrid, DERs mainly depends on fuel cost and NOX emissions level. So,
the main focus is to evaluate the different optimal outputs and their capacity limits. Based on multi-objective optimization method, economical sharing of electrical tracking demand is done among different sizes of micro-turbines and diesel generators. Keywords: Micro-turbine, diesel generator, economic emissions load dispatch, particle swarm optimization, loss sensitivity index, harmonic search algorithm.
I. INTRODUCTION
In recent years, the capital cost of new governing generating plant, has been focused on generating station with rapid installation in fossil fuel price with increase in higher efficiency, and electricity market becomes highly aggressive. Today, micro-grid is an important role, on CHP-based DERs with traditional centralized electricity plant.
The new generating plants of supply economic emission load dispatch (EELD) problem required demand plus transmission losses with the minimized cost of production. Because of this, pollution should be minimized due to the public demand, for clean air policies. However, power quality and reliability (PQR) of supply to individual users, micro-grid is become an alternate source for the consumers with low cost of power industry, services and many other places [1] - [5]. Under these circumstances, the environmental of DERs the operation of micro-grid is not only carry out by the units, capability of reducing the fuel cost, but it also capability of satisfying NOX emissions level requirements. In a decentralized electricity generation, they some advantage on-site
production of heat and provide quality and reliable power to the consumers at economical cost and so, many benefits like, reduction of customer interruption cost (CIC), reduction of emission level, reduction of system loss and waste heat recovery only on CHP related benefit-cost analysis [5] - [7]. It involves maximization of benefit-to-cost ratio (BCR) and generation of electricity and heat can be classified into operation and capital investment cost, maintenance cost and fuel cost.
The present paper is to discuss on NOx emission level with penalty factor point of view that can convert a multi-objective function
into a single objective optimization problem. They are two CHP-based DERs that are micro-turbines (MT) and diesel generators (DG). MT has lower NOX emission level of low combustion temperature whereas DG has higher combustion temperature but
results in higher NOX emission level. In a distribution network or microgrid there are some recent techniques like soft computing,
genetic algorithms, evolutionary programming, DER-CAM, tabu search etc. It developed a unit commitment operation for the fuel consumption of heat and electricity demand for the penalty factor on heat generation and claimed to support the communication infrastructure.
tmain objective is on CHP-based microgrid is to reduce the fuel cost for an individual customer site. It was developed by Berkeley Laboratory, USA. It discussed on size selection and bus -location of DERs in a 14- bus radial microgrid. The both electric, thermal of economic emissions load dispatch using PSO method, by satisfying the all equality and inequality constraints both for multi-modal as well as uni-multi-modal systems. PSO algorithm is very accuracy and easy concept to implement the efficient and to control parameters, when compared with another algorithm and both results are obtained and implemented in the tabular form.
II. PROBLEMFORMULATIONOFEELD
The present paper is mainly on energy management planning for economic planned scheduling of EELD. So, the formulation of EELD has be,
A. Bus-Location of DERs
i L L i L P J P P * ]
[ 1 (1)
Where [ ] is an Jacobian sub-matrix of [ ]-1, i.e., containing all [ / ] in terms of is a function of both and
i i
N
i i
L P U
P b , 1
(2)
B. Size-Selection of DERs
Objective function of system electric loss minimization (PL) is given by
N i D iL PG P
P Min
1
(3)
Optmization is done on Power quality and reliability constraints is given below. 1) Bus-Voltage Limits:
max
min i i
i
U
U
U
2) Limits on Active and Reactive Power Generation on DERs:
max min max min i i i i i i QG QG QG PG PG PG
3)Line Flow Limit: The thermal limits should be below of line and takes internal congestion of microgrid.
max
ij
ij
S
S
4) Zero Slack Bus Injection: At the planning stage, DER capability should be the internal demand of microgrid and reduces the power drawn from utility to zero.
C. Economic Emissions Load Dispatch (EELD) – Both Electric and Thermal Cost function of EELD is given by
C W f1 (1 W) (Pf ) f2
Minimize (4)
Here, C is the total fuel cost and emission level. P blends emission cost ( ) with the normal cost of fuel ( ). W is the weighting factor and uniformly varies between [0, 1].
1) Power Balance:
0 1
L D N ii P P
PG (5)
The quadratic function of the power loss PL and their outputs through B-coefficients and its constant terms and as linear terms [8],
[20]. of Kron’s loss formula, is as to referred.
00 1 0 1 1 B PG B PG B PG P i N i i j ij N i N j i
L
(6)
Where , i, j =1,…..N , are known as loss-coefficients; and units are MW-1. It can be rearranged to form a symmetrical square
matrix of dimension (N N) and a Units of BOO equal to that of PL and it consists of a single element, and units of BOi are
dimensionless and elements of Boi form (1 N) matrix.
0
1 2
1 YPG Z
XPG (8) Where,
11
B
X (9)
1 2 1 01
2
1
B PG B Y N ii (10)
00 2 2 0 2 2 B PG PG B PG B PG P Z N i i i N i i j ij N i N j i
D
(11)
The real roots of (8) are obtained as
(12)
2) Constraint of DER Capability Limits: DER generates the power within the upper limit PGimax and lower limit PGimin, so
expressed as,
max
min i i
i PG PG
PG (13)
3) Inequality Constraint of Heat Balance: With the consideration of output heat (HR) of Mt, Dg is directly proportional to electric
output
R
H
Total heat output = i Ni
i
PG
1
(14)Heat balance inequality constraint as given by,
D i
N
i
iPG H
1
(15)heat-to-power ratio of the ith DER is the
i which is a proportional to constant and is determined by using heat rate is (16). It canbe considered as Unit-wise heat exchanger as,
ex ith i kWh KJ HeatRate
3600 ) / ( (16)D. To Find Out the Steps PFN for NOx
1) Cost of the Fuel: The each DER of the fuel cost can be determined at its maximum output in $/h is
N i i i i ii
b
PG
c
PG
a
f
1 2 max max max1 (17)
2)
NO
XEmissions: NOX emission of the ith DER releases and is determined at its maximum output in g/kWh as
N i i i i ii
PG
PG
f
1 2 max max max2
(18)Fuel cost coefficients (
a
i,b
i,andc
i) can be determined from fuel cost DER outputs whereas Emission coefficients (
i,
i,and
i)for NOX emission of the ith DER are determined by curve fitting technique and are expressed in NOX emission level DER outputs.
3) Pfn[i]: Pfn[i] of the ith DER is calculated as
2 max max 2 max max]
[
i i i i i i i i iPG
PG
PG
c
PG
b
a
i
Pfn
(19)a) Values of Pfn[i] is set to be arranged in an ascending order.
D
i
P
PG
max (20)c) At this stage, the last unit price penalty factor Pfn[i] is associated for the load demand.
d) Once the penalty factor Pfn is subjected to the minimized constraints given in (5), (13), and (15).
III.PSO-BASEDALGORITHMFOREELD
Particle Swarm Optimization is used for solving the Economic Emission Load Dispatch (EELD) problem.
Let Initialize a population of particles as, Pi = [(Pi1, Pi2, Pi3,…………PiN )] be the ith particle of the population and i=1,2,3,……NP. ‘ N’
is number of units of generation. The main idea is to minimize the operational fuel cost as discussed in (4). The corresponding PSO algorithm can be determined by the following steps:
A. The data of emission level coefficients of input system and fuel cost curve coefficients of generators, weighting factor “W”, limitations of power generation, coefficients of transmission loss and load demand.
B. Initialization of population within the d-dimensional search space of velocities and random values are determined. The magnitude of any particle should be maximum velocity Vmax is initialized. The fitness of each particle and assignment of the particle's position to P-best position and fitness to P-best fitness is evaluated. Observe the best particle among the P-best as G-best and store the G-G-best of fitness value of the particle.
C. The particle of the position and velocity has to be changed.
D. For each particle, evaluate the fitness value as per (4), if all decisions variable are within the ranges.
E. By comparing the fitness evaluation particles with its previous best. If the current iteration value is better than the previous P-best, then set the P-best value is equal to the current value and the P-best location is equal to the current location in the d-dimensional search space.
F. Compare the best current fitness evaluation with the population G-best. If the current value is better than the population G-best, then reset the G-best to the current best position and the fitness value to current fitness value.
G. Repeat the steps 2-6 until a stopping criterion, such as sufficiently good G-best fitness or a maximum number of iterations/function evaluations is met.
H. The best compromise solution is that the algorithm can be described the set of solutions are known as Pareto-optimal solutions. In these we have to use fuzzy logic for each objective function is set to Pareto-optimal solutions implemented a fuzzy membership function can be obtained as per eqn.
IV.IMPLEMENTATIONOFPARTICLESWARMOPTIMIZATIONFORECONOMICEMISSIONLOADDISPATCH (EELD)
The main objective of EELD can be obtained minimum cost of generation within the constraints and can be generated by each committed generator, of the amount of real power generation and the components of PSO implementation and can be discussed in detailed.
Particle Swarm Optimization is to solve the economic emissions load dispatch (EELD) problem.
A. Let = [( , , ….. )] be the vector designating the ith particle of the population and I = 1,2,3……..NP. The real
power outputs of the elements of and N generating units
B. The objective is to minimize the fuel cost coefficients of generators as mentioned in (1)
2
1 1
1 ( ) i I i i
N
i i i
N
i
i P a bP cP
F
f
($/hr) (21)
Where
Fi
(
Pi
)
is the generator function of the cost;a
i,
b
iandc
iare the coefficients of the th generator of the cost function; andi-th generator of i-the power output Pi.
C. The Emission Level Coefficients of Generators are,
)
/
.
(
)
(
21 1
2
F
P
P
P
Kg
hr
f
i i i iN
i i i
N
i
Xi
(22)
Where,
f
2is the system function of the total amount of gases released in (Kg./hr) or Ton/hr)
i,
i,
i are coefficients of emissionD. Real Power Balance Constraint 0 1
L D N ii P P
P (23)
E. The total transmission losses
P
Lcan be determined by using B- loss coefficients and power output unit is given as,00 1 0 1 1 B PG B PG B PG P i N i i j ij N i N j i
L
(24)
F. Generator Capacity Constraints
If generator's lower limits PGimin and upper limits PGimax,
max
min i i
i PG PG
PG (25)
G. Cost function of EELD of fitness function is given by,
C
W
f
1(
1
W
)
(
Pf
)
f
2
Minimize
(26)H. Pfn[i]: Pfn[i] of the ith DERs is calculated as,
2 max max 2 max max ] [ i i i i i i i i i PG PG PG c PG b a i Pfn
(27)
I. Initialize of G-best and P-best: The initial particles of the swarm of fitness values can be obtained by the particle of initial pbest value.
J. The best value among all the Pbest values is identified as G-Best.
K. If the fitness evaluation value of each individual particle is better than previous P-best, the current value is said to be P-best. If the P-best is better than G-best, then best P-best is said to be G-best and the corresponding value of fitness function can be saved by the particle.
L. By Comparing the best current fitness evaluation with the population G-best value. If the current iteration value is better than the population G-best, then reset the G-best position of the current value and the fitness value of the particle to current fitness value.
M. If the iteration of current is equal or greater than to the maximum iteration, then result should keep in an array and should stop, otherwise repeat the steps (2-7).
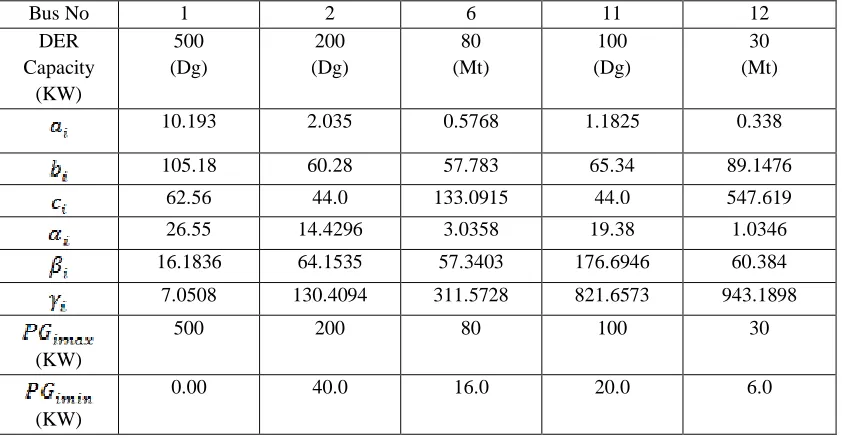
[image:6.612.97.518.512.731.2]V. RESULTSANDDISCUSSION TABLE I
DERS DATA-FUEL AND EMISSION COEFFICIENTS, OPERATING LIMITS, HEAT RATES
Bus No 1 2 6 11 12
DER Capacity (KW) 500 (Dg) 200 (Dg) 80 (Mt) 100 (Dg) 30 (Mt)
10.193 2.035 0.5768 1.1825 0.338
105.18 60.28 57.783 65.34 89.1476
62.56 44.0 133.0915 44.0 547.619 26.55 14.4296 3.0358 19.38 1.0346
16.1836 64.1535 57.3403 176.6946 60.384
7.0508 130.4094 311.5728 821.6573 943.1898
(KW)
500 200 80 100 30
(KW)
A. B-coefficients
Bij = [ 0.4355 -0.1694 0.1482 -0.2684 -0.0925
-0.1694 0.2366 -0.0247 -0.0061 -0.0689 0.1482 -0.0247 0.1636 -0.2391 -0.1046 -0.2684 -0.0061 -0.2391 0.6517 0.1987 -0.0925 -0.0689 -0.1046 0.1987 0.1864] B0i = [-0.0326 -0.0314 0.0057 -0.0018 0.0050]
B00 = [0.0014]
B. No. of Iterations = 1500
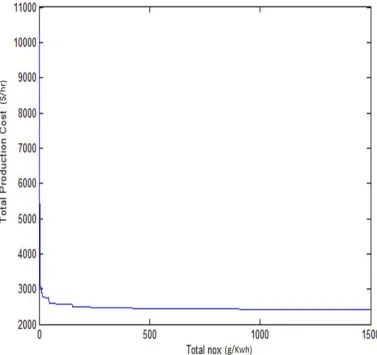
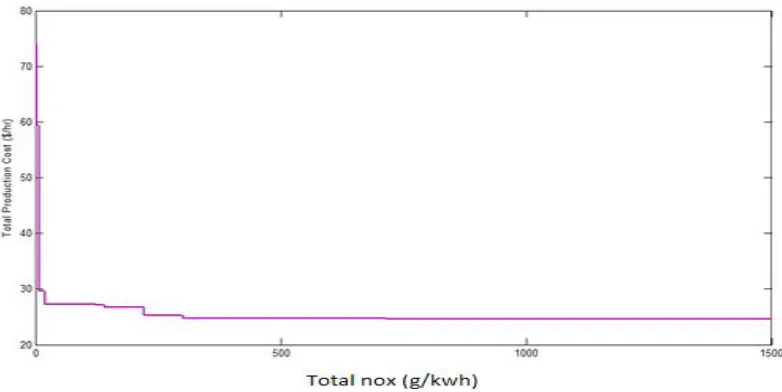
Case.1: To study the planning of CHP-based micro-grid of economic power sharing using PSO method for the load of 169KW of fuel cost is 24.2603$/hr and the total NOx is 48.6038g/kwh and for the load of 248KW of fuel cost is 52.140$/hr and total NOx is 96.8993g/kwh by using the eqns 21 & 22 using the MATLAB coding of R2012.
[image:7.612.113.490.348.703.2]1) Simulations Result for 169 KW for 5-Unit System :
Fig. 1 . Graph between Total NOx and Fuel Cost in $/hr for load of 169 KW with PSO Heat
Rate (KJ/KWh)
2) Simulations Result for 248 KW for 5-Unit System
Fig. 2 Graph between Total NOx and Fuel Cost in $/hr for load of 248 KW with PSO
C. Discussion
In this paper, the MATLAB coding of Particle Swarm Optimization method is to controlling the particles swarms and generate the best fitness value of personal best and global best solution. Initialize the particle of generating units of each individual particle and get the update best value of the current fitness value of gbest. If the iteration of current is equal or greater than to the maximum iteration, then results should be stop, otherwise repeat the steps.
VI.COMPARISONBETWEEN(PSO)AND(HSA)
By comparing the PSO and HSA algorithm results of both simulation techniques with each other and only difference is that HSA algorithm is faster than PSO algorithm and HSA algorithm is better than the PSO algorithm because by comparing these two techniques PSO algorithm is to reduce the fuel cost and nitrogen emission level by comparing with the HSA method.
Case 2: To study the comparison of HSA method for the load of 169KW of fuel cost is 25.246$/hr and the total NOx is 39.6655g/kwh and for the load of 248KW of fuel cost is 54.752$/hr and total NOx is 74.7885g/kwh by using the above eqns.
A. Simulations Result for 169 KW for 5-Unit System
[image:8.612.112.503.502.698.2]B. Simulations Result for 248 KW for 5-Unit System
Fig .4 Graph between Total NOx and Fuel Cost in $/hr for load of 248 KW with HSA
C. Discussion
[image:9.612.85.530.390.645.2]In this paper, a PSO and HSA method is implemented, simulated and results were discussed. The active and reactive power generation and bus voltages within capability limits, economically share an electrical tracking demand by comparing these two techniques is to minimize the operational fuel cost and nitrogen oxide emission level is to get the successful results by comparing these two techniques and results are achieved.
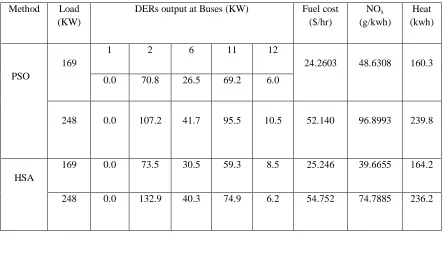
TABLE II
OPTIMAL SCHEDULING OF GENERATORS OF A FIVE-UNIT SYSTEM BY COMPARING PSO METHOD AND HSA METHOD
Method Load (KW)
DERs output at Buses (KW) Fuel cost ($/hr)
NOx
(g/kwh)
Heat (kwh)
PSO
169
1 2 6 11 12
24.2603 48.6308 160.3
0.0 70.8 26.5 69.2 6.0
248 0.0 107.2 41.7 95.5 10.5 52.140 96.8993 239.8
HSA
169 0.0 73.5 30.5 59.3 8.5 25.246 39.6655 164.2
248 0.0 132.9 40.3 74.9 6.2 54.752 74.7885 236.2
VII. CONCLUSION
REFERENCES
[1] T. Ackerman, L. Anderson, and L. Soder, “Distributed generation: A definition,” Elect. Power Syst. Res., vol. 57, no. 3, pp. 195–204, Apr. 2001.
[2] G. J. Miranda, “Be prepared! An overview of process industry options in the deregulated power era,” IEEE Ind. Appl. Mag., vol. 9, no. 2, pp. 12–20, Mar./Apr. 2003.
[3] R. H. Lasseter, “MicroGrids,” in Proc. IEEE Power Eng. Soc. Winter Meeting, Jan. 27–31, 2002, vol. 1, pp. 305–308.
[4] N. Hatziargyriou, H. Asano, R. Iravani, and C. Marnay, “Microgrids,” IEEE Power Energy Mag., vol. 5, no. 4, pp. 78–94, Jul.–Aug. 2007. [5] D. Kirschen and G. Strbac, “Why investments do not prevent blackouts,” Electricity J., vol. 17, no. 2, pp. 29–36, Mar. 2004.
[6] C. Marnay and O. Bailey, “The CERTS micro grid and the future of the macro grid,” CERTS, Aug. 2004.
[7] H. L. Willis and W. G. Scott, Distributed Power Generation Planning and Evaluation. New York: Marcel Dekker, 2000.
[8] A. Bhattacharya and P. K. Chattopadhyay, “Application of biogeography-based optimization for solving multi-objective economic emission load dispatch problems,” Elect. Power Compon. Syst., vol. 38, no. 3, pp. 340–365, 2010.
[9] J. Teng, Y. Liu, C. Chen, and C.-F. Chen, “Value-based distributed generator placements for service quality improvements,” Int. J. Elect. Power Energy Syst., vol. 29, no. 3, pp. 268–274, Mar. 2007.