Technology (IJRASET)
Strength Performance of High Strength Concrete
Using Slag Sand and Quarry Sand
Kalyan B.N1, Sridhar R2, Shivraj M. Kalhal3 1
M.Tech Final year student, Nagarjuna College Of Engineering And Technology,
2
Associate professor, department of civil, Nagarjuna College Of Engineering And Technology,
3
Principal Engineer-Lab, Civil-Aid Technoclinic Pvt.Ltd.
Abstract— Cement is the basic material required for any construction. It acts as a binding agent in concrete. It is the second most consumed product in the world and India is 2nd largest consumer of cement after china. But nowadays Cement industries produce about 10% of the world’s carbon dioxide which affects the environment and cause imbalance in the ecosystem. In India, the sudden boom in infrastructure has made Indians the largest consumers of materials required for the construction. Usage of these materials have created huge amounts of pollution, wastes etc In this present study slag sand and quarry sand are used as replacement for natural sand along side with microsilica and flyash as a partial replacement for cement, since the outcome of slag behavior is unknown with the materials used, hence slag sand ratio is replaced ranging from 10% uptil 60% with quarry sand along with 6% and 12% addition of microsilica to the weight of cement and flyash percentage is freeze to 20% for the complete investigation. The main objective was to find the optimum mix proportion that gives higher strength alongside economizing the consumption of materials to reduce cost. From the test results conducted in under strength criteria, it is clear that slag sand can be used for construction with different addition of admixtures that aid in achieving high strength concrete in mass construction.
Keywords— Compressive Strength, Split Tensile Strength, Flexure Test, Slag Sand, Quarry Sand
I. INTRODUCTION
Advent of industrial products like admixtures, plasticizers, retarders etc have eased the construction work, meanwhile aiding in depletion of natural resources and increase in pollution. Each ton of cement created generates roughly 800kg of carbon dioxide into the atmosphere. India produces cement in large quantities around 520million ton's every year. It leads to generation of 416 million tons of carbon dioxide every year. This issue has lead to research the use of byproducts as the replacement of basic materials in conventional concrete. This has helped Engineers to try and create sustainable concrete industry. In India, the availability of basic materials like Natural River sand and coarse aggregates are highly uneconomical based on its availability which intern leads in raising the cost of construction works. There was a myth at the beginning of the research that the industrial products and byproducts
were not good enough to be used in the high strength concrete mixes or concrete grades above M35 - M40. But nowadays due to the
advancements in the research and improvements in manufacturing techniques, the byproducts are now being researched for their usage in the high strength concretes with various combinations and trials to come up with an optimal concrete mix that is good in terms of both strength and durability and steps to improve them. Addition to this, overall economic cost is important and concrete is a great devoured material in the universe.70% of that volume is made of aggregates and subsequently over abuse of natural river sand is observed. Leading governments of numerous nations and states are banning sand mining due to lack of “Natural River Sand” (NRS) and the prices have sky rocketed (Rs.80, 000 to 1, 50,000 for every truck load) leading to augmentation in construction expenditure. But India being the world's most populated country the capitol income of the country plays an important role in construction as well hence usage or natural sand is not completely banned but is substantially reduced, which paves way for new re era in infrastructure.
II. LITERATUREREVIEW
Technology (IJRASET)
found that 50% was found to obtain optimum design strength with 5% micro silica but only strength test were conducted. addition to this Aditya dhagat and Manav Mittal. (2013) conducted research and they replaced partially micro silica with cement and fly ash. The basic idea of replacing this was to economize the overall cost of concrete used in construction by achieving suitable strength. Addition to this, the harmful effect caused due to utilization of concrete on environment was considerably reduced with 48%cement, 43% fly ash and 5% micro silica. This mixture gave considerably higher strength when tested for 7, 14 and 28 days compared to control mix. According to Prem Kumar ,Dr. Pradeep Kumar. (2015) they encased the use of blast furnace slag as a replacement for natural sand with 25% increment up to 100% for both M20 and M30 grades .With 1:4 cementitious proportion for mortar cubes and concluded that the percentage between 60-75% provided greater strength and beyond 75% the strength gradually dropped .therefore 60% was set as optimum replacement that can be adopted in construction. Similarly Mudasir Hussain Pandit et al.(2014): Used flyash, microsilica and recycled concrete aggregates, their idea was to completely replace cement with fly ash and microsilica with increments in microsilica .Addition of 5% uptil 15% and replacing coarse aggregate with concrete aggregate of 5% increment uptil 15% for an M25 grade concrete mix .It was observed that due to addition of fly ash there were permeability issues but increase in replacement of concrete aggregates minimized that issue but the percentage was freeze to 10% considering various safety factors. Chetan Khajuria and Rafat Siddique. (2014): In their research they used iron slag as partial replacement for natural river sand in concrete .This research concentrates mainly on strength parameters by replacing 10%,20% and 30% slag with natural river sand ( NR SAND) .After testing they concluded that addition of 10% slag there was increase in 26% strength after 7 day curing , 50% increase in strength after 28 day curing period and 43% increase in strength after 56 day curing period compared to control mix . But addition of 20% and 30% slag there was an aggumentation in strength up to 68%,91%, 71% and 125%,113%,87% after 7,28,56
days. P.S Kothari and Dr.R. Malathy (2014): Used steel slag as partial replacement for fine aggregates NRsand for M20 they
concentrated mainly on strength criteria , tests were conducted and fine aggregates were replaced by 10%,20%,30%,40% and 50% under 28 day curing OPC 43 grade cement was used with 20mm max size coarse aggregates were used in accordance. In their tests 30% slag replacement showed promising results in strength both moment of elasticity and moment of rupture tests were also conducted and similar trend followed. This research was carried out to approve slag sand usage in construction which benefited in areas like cost reduction, environmental pollution reduction, mass utilization, reduced wastage etc. Krishna Prasanna .et al.(2014) :In their study they utilized slag sand for high strength concrete mix as a suitable replacement for river sand . The
replacement ranged from 5% to 35% with 5% increments between mixes for M80 concrete .During their progress 30% replacement
provided promising results with respect to compressive test, split tensile test and flexure test parameters compared to other mixes.
III.MATERIALSUSED
A. Cement
Ordinary Portland Cement of 53 grade satisfying the conditions in IS:8112-1989[14] with specific gravity of 3.15
B. Fly ash
Fly ash is used as partial replacement at 20% to the weight of cementitious material in both cases with specific gravity of 2.82 satisfying the requirements as per IS:3812-1999[15]
C. Microsilica
Microsilica is used as a partial replacement at 6% for case I and 12% for case II to the weight of cementitious material and specific gravity was found to be 2.75
D. Fine aggregates
In this experimental study, usage of river sand is completely eliminated except for control mix blend performed initially for strength comparison only. slag sand is used as partial replacement to Quarry sand. passing through 4.75 micron IS sieve and retaining in 150 micron IS sieve. In this study sieve analysis was performed on slag sand and categorized as ZONE II. with specific gravity for slag sand and quarry sand being 2.56 and2.57.Satisfying the conditions in IS:383-1978[13]
E. Coarse aggregates
Technology (IJRASET)
F. Water
For this experiment study 0.28 W/C ratio was kept constant thought based on IS 10262 for mix design.
G. Chemical admixture
In this experiment superplasticizer AURAMIX 400 was used. AURAMIX 400 is a PCE-based admixture (polycarboxylic ether polymer) for low water cement ratio and suitable for self-compacting concrete. For this experiment at least 100mm slump was maintained based on trial and error for each combination.
IV.METHODOLOGYANDTESTING
[image:4.612.118.499.266.676.2]Casting and curing process of beams, cubes and cylinders areas usual. The surface preparation has to be made, The inside of the moulds are to be oiled thoroughly ,Finally the concrete was mixed using a pan mixer (SKILLET MIXER). Due to its advantages over traditional transit mixer in uniform mixing, moulds were casted and de-molded after 24 hrs and immersed in a curing tank. and testing was conducted for specimens for 7,14,28 and 56 days. following table shows the percentage taxonomy of concrete mix proportions used in this study
Table 1: Hierarchy of concrete blend percentage for 6% and 12% microsilica
SL NO MIX PROPORTIONS
HIERARCHY OPC MICRO SILICA
FLY ASH
QUARRY SAND
S- SAND
NR-SAND
Trail 1 0@0 74 0% 0% 0 0 100
Trail 2 6@0 74 6% 20% 100 0 0
Trail 3 6@10 74 6% 20% 90 10 0
Trail 4 6@20 74 6% 20% 80 20 0
Trail 5 6@30 74 6% 20% 70 30 0
Trail 6 6@40 74 6% 20% 60 40 0
Trail 7 6@50 74 6% 20% 50 50 0
Trail 8 6@60 74 6% 20% 40 60 0
Trail 9 12@0 68 12% 20% 100 0 0
Trail 10 12@10 68 12% 20% 90 10 0
Trail 11 12@20 68 12% 20% 80 20 0
Trail 12 12@30 68 12% 20% 70 30 0
Trail 13 12@40 68 12% 20% 60 40 0
Trail 14 12@50 68 12% 20% 50 50 0
Trail 15 12@60 68 12% 20% 40 60 0
V. EXPERIMENTALOBSERVATIONS
Technology (IJRASET)
combinationsTable 2: Compressive strength for 6%microsilica in N/mm2
M60 CONCRETE Compressive Strength In N/mm2
Cement+ Microsilica 6%+ Flyash+ Quarry sand + Slag sand+ Natural Sand (All in %)
7days 14 days 28days 56days
100+0+0+0+0+100 50 63 67 73
74+6+20+100+0+0 55 65 75 82
74+6+20+90+10+0 58 67 79 79
74+6+20+80+20+0 56 66 78 76
74+6+20+70+30+0 55 63 76 74
74+6+20+60+40+0 52 61 70 73
74+6+20+50+50+0 51 62 73 77
[image:5.612.71.543.268.688.2]74+6+20+40+60+0 53 63 74 78
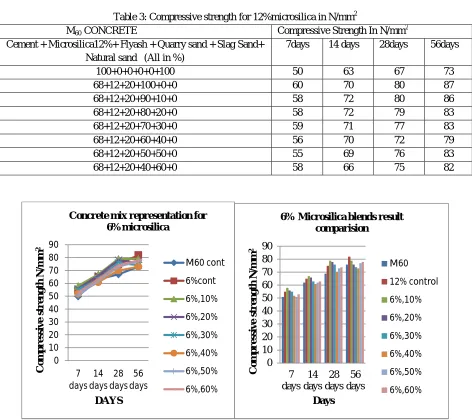
Table 3: Compressive strength for 12%microsilica in N/mm2
M60 CONCRETE Compressive Strength In N/mm2
Cement + Microsilica12%+ Flyash + Quarry sand + Slag Sand+ Natural sand (All in %)
7days 14 days 28days 56days
100+0+0+0+0+100 50 63 67 73
68+12+20+100+0+0 60 70 80 87
68+12+20+90+10+0 58 72 80 86
68+12+20+80+20+0 58 72 79 83
68+12+20+70+30+0 59 71 77 83
68+12+20+60+40+0 56 70 72 79
68+12+20+50+50+0 55 69 76 83
68+12+20+40+60+0 58 66 75 82
Fig 1: Representation for 6% blend mixes Fig 2: Comparison for 6% blend mixes
0 10 20 30 40 50 60 70 80 90 7 days 14 days 28 days 56 days C o m p r e ss iv e s tr e n gth N /m m 2 DAYS
Concrete mix representation for 6%microsilica M60 cont 6%cont 6%,10% 6%,20% 6%,30% 6%,40% 6%,50% 6%,60% 0 10 20 30 40 50 60 70 80 90 7 days 14 days 28 days 56 days C o m p r e ss iv e s tr e n gth N /m m 2 Days
Technology (IJRASET)
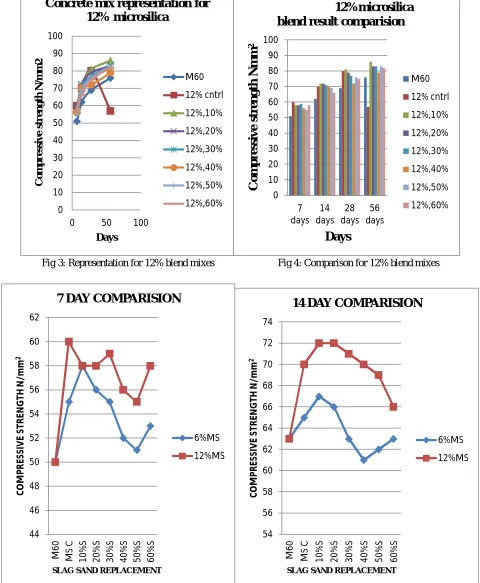
Fig 3: Representation for 12% blend mixes Fig 4: Comparison for 12% blend mixes
Fig 6: 7 day comparison for 6% and 12% microsilica Fig 7: 14 day comparison for 6% and 12% microsilica
0 10 20 30 40 50 60 70 80 90 100
0 50 100
C o m p r e ss iv e s tr e n gth N /m m 2 Days
Concrete mix representation for
12% microsilica
M60 12% cntrl 12%,10% 12%,20% 12%,30% 12%,40% 12%,50% 12%,60% 0 10 20 30 40 50 60 70 80 90 100 7 days 14 days 28 days 56 daysC
om
p
re
ss
ive
s
tr
en
gt
h
N
m
m
2Days
12%microsilica
blend result comparision
M60 12% cntrl 12%,10% 12%,20% 12%,30% 12%,40% 12%,50% 12%,60% 44 46 48 50 52 54 56 58 60 62 M 6 0 M S C 1 0 %S 2 0 %S 3 0 %S 4 0 %S 5 0 %S 6 0 %S C O M P R ES SI V E ST R EN G T H N /m m 2
SLAG SAND REPLACEMENT
7 DAY COMPARISION
6%MS 12%MS 54 56 58 60 62 64 66 68 70 72 74 M 6 0 M S C 1 0 %S 2 0 %S 3 0 %S 4 0 %S 5 0 %S 6 0 %S C O M P R ES SI V E ST R EN G TH N /m m 2
SLAG SAND REPLACEMENT
14 DAY COMPARISION
6%MS
[image:6.612.66.546.88.671.2]Technology (IJRASET)
Fig 8: 28day comparison for 6% and 12% microsilica Fig 10: 56 day comparison for 6% and 12% microsilica
Following Tables Shows The Experimental Observations Observed From Split tensile Test. Refer table 1 for blend mix combinations
Table4: Split Tensile Strength For 6%miccrosilica In N/mm2
M60 CONCRETE Split tensile Strength In N/mm2
Cement+ Microsilica6%+ Flyash+ Quarry sand + Slag Sand + Natural Sand (All in %)
28days
100+0+0+0+0+100 3.5
74+6+20+100+0+0 4.48
74+6+20+90+10+0 3.45
74+6+20+80+20+0 3.52
74+6+20+70+30+0 3.59
74+6+20+60+40+0 3.64
74+6+20+50+50+0 4.34
74+6+20+40+60+0 4.2
Table5: Split tensile strength for 12%miccrosilica in N/mm2
M60 CONCRETE Split tensile Strength In N/mm2
Cement+ Microsilica12%+Flyash Quarry sand+ Slag Sand+ Natural Sand (All in %)
28days
100+0+0+0+0+100 3.5
68+12+20+100+0+0 4.68
68+12+20+90+10+0 3.05
68+12+20+80+20+0 2.96
68+12+20+70+30+0 3.12
68+12+20+60+40+0 3.34
68+12+20+50+50+0 4.47
68+12+20+40+60+0 4.03
60 65 70 75 80 85 M 6 0 M S C 1 0 %S 2 0 %S 3 0 %S 4 0 %S 5 0 %S 6 0 %S C O M P R ES SI V E ST R EN G TH N /m m 2
SLAG SAND REPLACEMENT
28 DAY COMPARISION
6%MS 12%MS 65 70 75 80 85 90 M 6 0 M S C 1 0 %S 2 0 %S 3 0 %S 4 0 %S 5 0 %S 6 0 %S C O M P R ES SI V E ST R EN G TH N /m m 2
SLAG SAND REPLACEMENT
56 DAY COMPARISION
6%MS
Technology (IJRASET)
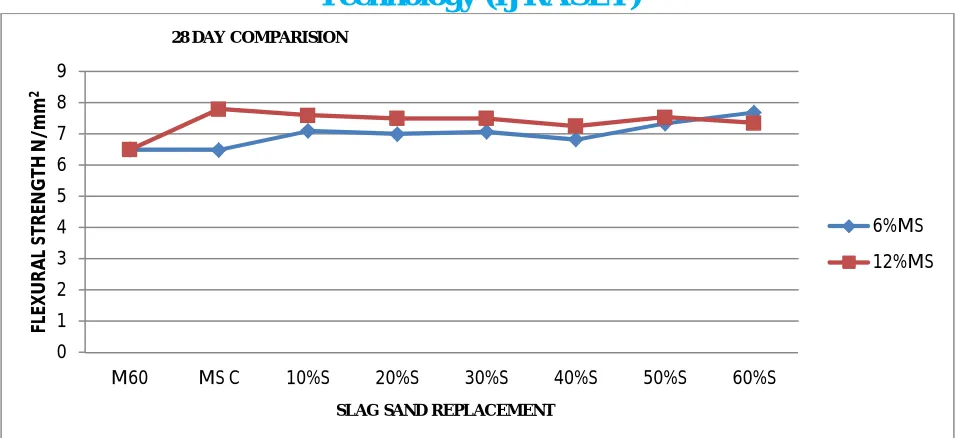
Fig 11: 28 day comparison for 6% and 12% microsilica addition
Following Tables Shows The Experimental Observations Observed From Flexure Test. Refer table 1 for blend mix combinations
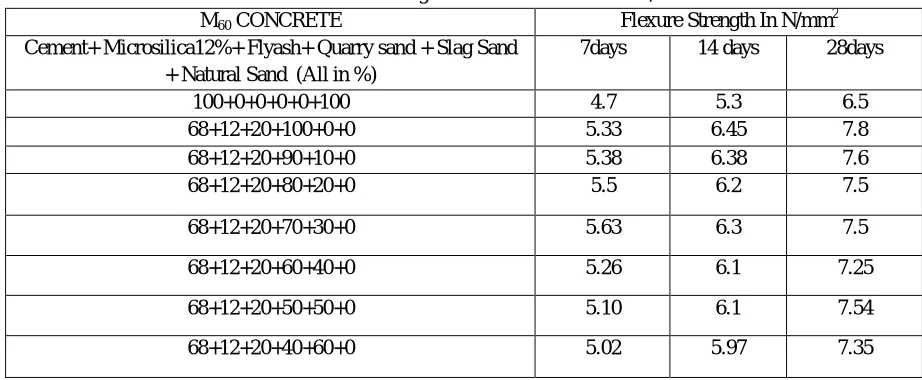
Table 6: Flexural strength for 6%microsilica in N/mm2
M60 CONCRETE Flexure Strength In N/mm2
Cement+ Microsilica6%+ Flyash+ Quarry sand + Slag Sand + Natural Sand (All in %)
7days 14 days 28days
100+0+0+0+0+100 4.7 5.3 6.5
74+6+20+100+0+0 5.1 5.8 6.49
74+6+20+90+10+0 5.6 6.1 7.1
74+6+20+80+20+0 5.4 6.3 7.0
74+6+20+70+30+0 5.4 6.0 7.07
74+6+20+60+40+0 4.96 5.95 6.82
74+6+20+50+50+0 4.8 6.2 7.34
74+6+20+40+60+0 5.15 6.4 7.69
Table7 : Flexural Strength For 12%Microsilica In N/Mm2
M60 CONCRETE Flexure Strength In N/mm2
Cement+ Microsilica12%+ Flyash+ Quarry sand + Slag Sand + Natural Sand (All in %)
7days 14 days 28days
100+0+0+0+0+100 4.7 5.3 6.5
68+12+20+100+0+0 5.33 6.45 7.8
68+12+20+90+10+0 5.38 6.38 7.6
68+12+20+80+20+0 5.5 6.2 7.5
68+12+20+70+30+0 5.63 6.3 7.5
68+12+20+60+40+0 5.26 6.1 7.25
68+12+20+50+50+0 5.10 6.1 7.54
68+12+20+40+60+0 5.02 5.97 7.35
0 1 2 3 4 5
M60 MS C 10%S 20%S 30%S 40%S 50%S 60%S
SP
LI
T
T
EN
SI
LE
S
TR
EN
G
T
H
N
/m
m
2
SLAG SAND REPLACEMENT
28 DAY COMPARISION
6%MS
[image:8.612.74.535.526.716.2]Technology (IJRASET)
Fig 12: Representation for 6% blend mixes Fig 13: Representation for 12% blend mixes
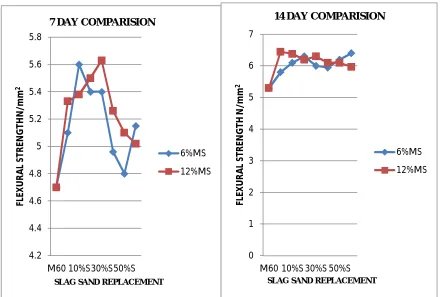
Fig 14: 7 day comparison for 6% and 12% microsilica Fig 15: 14 day comparison for 6% and 12% microsilica
0 1 2 3 4 5 6 7 8 9 7DAYS 14 DAYS 28 DAYS F R EX U R E S TR EN G TH n /M M 2 DAYS
Concrete mix representation for
6% microsilica blends
M 60 6% cntrl 6%,10% 6%,20% 6%,30% 6%,50% 6%,60% 0 1 2 3 4 5 6 7 8 9
7 DAYS 14
DAYS 28 DAYS
fl
ex
u
re
s
tr
en
gt
h
N
/m
m
2 DaysConcrete mix represtation for
12% microsilica blends
M 60 12% cntrl 12%,10% 12%,20% 12%,30% 12%,40% 12%,50% 12%,60% 4.2 4.4 4.6 4.8 5 5.2 5.4 5.6 5.8 M60 10%S30%S50%S FL EX U R A L ST R EN G TH N /m m 2
SLAG SAND REPLACEMENT
7 DAY COMPARISION
6%MS 12%MS 0 1 2 3 4 5 6 7
M60 10%S 30%S 50%S
FL EX U R A L ST R EN G T H N /m m 2
SLAG SAND REPLACEMENT
14 DAY COMPARISION
6%MS
[image:9.612.87.527.387.684.2]Technology (IJRASET)
Fig 16: 28 day comparison for 6% and 12% microsilica
VI.RESULTSANDDISCUSSIONS
A. From compression test representations it was observed that there was 15.18% strength augmentation for 6% microsilica and 10%
slag combination compared to control mix. From representations 12% microsilica with 10% slag combination gave slightly higher augmentation in strength of 17.28% compared to control mix and compared to 6% microsilica combinations.
B. Similarly from combined illustrations it is clear clears that there was a difference in strength variation of 2.1% between 6% and
12% microsilica combination with 10% slag replacement. Since slag sand was coarser compared to Quarry sand the bonding was efficient. But it was observed that there was a decrease in strength beyond 10% replacement but the percentage of decrease in strength was negligible.
C. Split tensile test was conducted on cylinder samples for 28 day for ultimate strength .The tensile strength was found to be
optimum at 50% slag sand replacement for both 6% and 12% microsilica combinations and from representations .It was observed that TRAIL MIX 7 blend showed 19.35% aggumentation in tensile strength compared to control mix and TRAIL MIX 14 blend showed 21.70% augmentation in strength compared to control mix, similarly from combined illustration 2.35% variation in strength was observed between 6% and 12% microsilica combinations.
D. Flexure test was conducted on beams for 7, 14 and 28 days samples for ultimate strength. It was observed from the figure 4.21
and 4.23 that 60% slag replacement for both 6%and 12% microsilica gave greater strength augmentation of 10.28% from and13.79% compared to M60 control mix. Similarly comparing both combinations according to figure 4.25, strength difference of 3.51% was observed..
VII. CONCLUSION
The following conclusions drawn based on the experimental work It is clear under strength parameters that slag sand can be used as partial replacement with Quarry sand and from compression test results. 10% slag sand replacement was found to give satisfactory results, meanwhile the flexure tests also gave out promising results under strength criteria at 50% slag sand replacement. But Quarry sand being highly economical to use in mass concreting. Based on cost analysis, Quarry sand was found to be Rs. 700-1200 /ton, which is highly uneconomical in mass concreting but partially replacing slag sand the total economic cost can be substantially reduced because based on cost analysis slag sand was found to be Rs. 200-600 /ton. Replacement of 40%-60% was found to be appropriate and even though it results in slight decrease in strength, which is negligible when different admixtures are added to improve the strength. In this investigation the concrete was designed for M60 grade of concrete. But the achieved strength was beyond satisfactory. Comparing the results from both blend combinations, 12% blend combinations marginally displayed superiority over 6% blend combinations but considering economic wise 6% blend combinations proved promising.
VIII. ACKNOWLEDGEMENT
First and foremost we would like to thank our Principal for guiding us in the right direction and helping us with his
0 1 2 3 4 5 6 7 8 9
M60 MS C 10%S 20%S 30%S 40%S 50%S 60%S
FL
EX
U
R
A
L
ST
R
EN
G
TH
N
/m
m
2
SLAG SAND REPLACEMENT 28 DAY COMPARISION
6%MS
Technology (IJRASET)
valuable suggestions. We are also grateful to the authors of various papers and journals cited in our research paper.
Lastly we would like to thank our friends, family and the Department of Civil Engineering for providing us with their support and help.
REFERENCES
[1] T.Shanmugapriya and R.N.Uma ," optimization of partial replacement of quarry sand by natural sand in high performance concrete with silica fume”,
International Journal of Engineering Sciences and Emerging Technologies, Vol 2, Issue 2 ,June 2012, pp: 73-80.
[2] N.Shaktieswaran, K.Ganesan, "Compressive strength of concrete with fly ash,copper slag,silica fume with fibers" International Journal Of Engineering And
Computer Science Volume 3 ,Issue 2 ,February 2014, pp: 3891-3896
[3] Puneeth G.T, Mamatha .A ,"Strength of concrete by Partial replacement of cement with microsilica and natural river sand with manufactured
sand" ,International Journal of Civil and Structural Engineering Research, Vol. 3, Issue 2, October 2015 - March 2016, pp: 52-57
[4] Prem Ranjan Kumar, Dr Pradeep Kumar T.B " Use of blast furnace slag as alternate to natural sand in mortar" ,International Journal of Innovative Research in
Science, Engineering and Technology Vol. 4, issue 2,Feb 2015, pp:2347-6710.
[5] Aditya dhagat , Manav Mittal," Effects of Microsilica And Fly Ash on strength of Concrete", International Journal of Scientific & Engineering Research,
Volume 4, Issue 8 ,Aug 2013
[6] Mudasir hussain pandit, Mrs. D.Renuka, permasehwari " High Density Concrete, Using Flyash, Microsilica and Recycled Aggregate ".Department of Civil
Engineering SRM University Chennai, India. (International Journal of Engineering Trends and Technology ,Vol 10, Issue 1, April 2014
[7] Kothari P.S, Malathy .R “utilization of steel slag in concrete as a partial replacement material for fine aggregates”, International Journal of Innovative Research
in Science, Engineering and Technology, vol. 3, issue 4, April 2014
[8] Chethan khajuria, Rafat siddique “use of iron slag as partial replacement of sand to concrete “International Journal Of Science, Engineering And Technology
Research, ISSN: 278-7798, Vol. 3, issue 6, June 2014
[9] AS Alnuaimi," Effects of copper slag as a replacement for fine aggregates on behaviour and ultimate strength of RC columns". The Journal of Engineering
Research 2012, Vol. 9, No. 2, pp: 90-102, March 2012
[10] Binaya Patnaik, Seshadri Sekhar.T, Srinivasa Rao “strength and durability properties of copper slag admixed concrete", International Journal of Research in
Engineering and Technology: 04 Special Issue: 01, NCRTCE-2014, Feb-2015
INDIAN STANDARDS CODE BOOKS
[1] AASHTO T 277 or ASTM C 1202 Rapid chloride permeability test
[2] IS: 3085 – 1965 Method Of Test For Permeability Of Cement Mortar And Concrete
[3] IS : 383-1978 Specification for coarse and fine aggregate from natural sources of concrete.
[4] IS: 8112-1989 43 grade Ordinary Portland Cement- Specifications.
[5] IS: 3812-1999 Specification for Fly ash to use as pozzolana and admixture
[6] IS : 10262-2009 Concrete mix proportioning-guidelines(First Revision)
[7] IS : 516 - 1959 Methods Of Tests On Strength Of Concrete