Estimation of Appropriate Forecasts using Neural
Network Learning of Previous Sales Data
Chandra KishanBissa1, Rahul Vyas2
1
Department of mechanical engineering, MBMEC, JNVU, Jodhpur, Rajasthan
2
Department of mechanical engineering, VIET, RTU, Jodhpur, Rajasthan
Abstract: A forecast is an estimate of the level of demand to be expected for the particular product or several products for some period of time in the future. It can be said that forecast is an educated guess; certainly is should contain as little error as is humanly possible. To make a forecast more meaningful, it should be in turns of units to be planned or scheduled, and it should cover a time period at least as long as the period of time required to make a decision and to put that decision into effect .The nature of product and its demand pattern affect the type of forecast to be made and the time period which must be covered or spanned; like demand may be constant, may have cyclic variations, long term upward trend etc.. Generally we find that forecast can be done by subjective opinion, market research, using certain index or can be computed using averages or some combination methods. Most of the forecaster assumes that use of statistical methods applied to the past data is a realistic way of forecasting future demands. New researchers use the bass model and other life cycle assessment models of the product to forecast the demand but these require a similar product life cycle to compute certain constants which again weaken the forecast. We think that the possibility of getting the almost exact forecast depends on the process (may be statistical or any) that are used to forecast, and these processes are selected by the forecaster; this means that these all forecasts basically dependant on the experiences of the forecaster and the knowledge regarding the trend of the market, and also the ability of the forecaster to predict the remaining life cycle of the product. This is the basic region that we get the values which, many times, are far from actual one. Considering the requirements of forecasts i.e. a huge knowledge about the product whose demand is to be forecasted and certainty of irrelevance or missing data, the author experiments on a new tradition of forecasting and uses an artificial neural network technology to forecast the future demand and represent some of them in this paper. This technology uses mathematical formulations to model nervous system operations and is used to learn pattern and relationships in data. There is verity of software available to model the neural network but among those the author fined more convenient software which is a add-ins of MS EXEL known as Neuro XL Predictor which is very simple to use as it is a part of Microsoft Excel spreadsheets.
Keywords: Forecast, Neural Network, Neuro XL predictor.
I. INTRODUCTION
Forecasting are the results in the description of the process through a number of equations that in principle, combine the current value of the series, with past observations, modelling errors, and exogenous variables. Over recent years, several nonlinear forecasting models have been proposed both in classical econometrics and in machine learning theory involving subjective estimate technique, traditional statistical method and intelligent forecasting. One of the most emerging technologies is artificial neural network (ANN) which is basically a machine learning process. The author find ANN as one of the best available technique for forecasting because of its flexibility and forceful pattern recognition capabilities which make them an attractive alternative when the structure of the data generating system is unknown.
II. LITRATUREREVIEW
few findings of any managerial importance as management asked for forecasting methods that were simple and easily automated, making some form of exponential smoothing the only reasonable choice for them.
Some researchers use the diffusion models like bass model [3, 20] and other life cycle assessment models of the product to forecast the demand. Although this is one of the best method but requires correct data of similar technology to find the constants involve in calculations.
All of these are the basis for the present forest models and their simulations; but since the last two decades, machine learning models have drawn attention and have established themselves as serious contenders to classical statistical models in the forecasting community [1] These models, also called black-box or data-driven models [11] are examples of nonparametric nonlinear models which use only historical data to learn the stochastic dependency between the past and the future. For instance, Werbos found that Artificial Neural Networks (ANNs) outperforms the classical statistical methods such as linear regression and Box–Jenkins approaches [18, 19] A similar study has been conducted by Lapedes and Farber (1987) who conclude that ANNs can be successfully used for modelling and forecasting nonlinear time series. Later, others models appeared such as decision trees, support vector machines and nearest neighbour regression [2, 7]
Moreover, the empirical accuracy of several machine learning models has been explored in a number of forecasting competitions under different data conditions (e.g. the NN3, NN5, and the annual ESTSP competitions [4, 10], creating interesting scientific debates in the area of data mining and forecasting [4, 6, 14]. Some researchers like xi-zhengzhang [20], influence on real time training of neural network for use in stock markets etc. Xi-zhengzhang had present Multi-Rule & Real-Time Training Neural Network (MRRTTNN) model; which focus on dynamic training and dynamic forecasting and incorporates three rules (rule of dealing with abnormity, rule of retraining and rule of adopting the average).
III.ARTIFICIALNEURALNETWORK A. Introduction
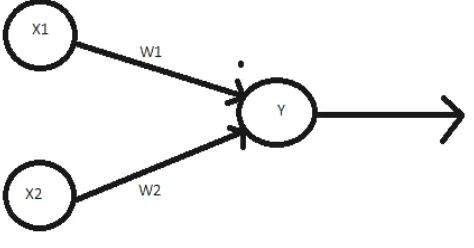
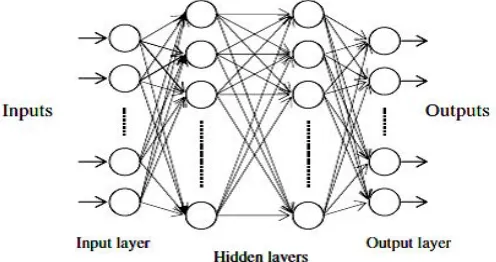
[image:3.612.212.449.504.628.2]An Artificial Neural Network (ANN) is an information-processing paradigm that is inspired by the way biological nervous systems, such as the brain, process information. ANN's are a type of artificial intelligence that attempts to imitate the way a human brain works. Rather than using a digital model, it works by creating connections between processing elements which are the computer equivalent of neurons. The organization and weights of the connections determine the output. In common with biological neural networks, ANNs can accommodate many inputs in parallel and encode the information in a distributed fashion. Typically the information that is stored in a neural net is shared by many of its processing units. This type of coding is in sharp contrast to traditional memory schemes, where a particular piece of information is stored in only one memory location. Figure 1 shows a simple artificial neural net with two put neurons (X1, X2) and one output neuron (Y). The interknitted weights are given by W1 and W2. In a single layer net (there is a single layer of weighted interconnections. Figure 2 shows a multi-layer ANN.
Figure 1:Simple Neural Net
Figure 2: Multi Layer Neural Net
B. Feed forward network
One of the important types of networks from those discussed in previous section used in scheduling applications is a multilayer perception, a feed-forward network including a set of neurons connected by weighted links. It consists of an input layer, one or more hidden layers and an output layer. Back-propagation, which was first introduced by Werbos [18], was later rediscovered independently by Parker [13] and Rumelhart et al. [15], and then modified in various manners by numerous researchers in order to overcome its deficiencies, is one of the most popular algorithms for training multilayer perceptions. In this type of network the every input vector laid on the network, an output vector is calculated and that can be read from the output neurons. There is no feedback. Hence only, a forward flow of information is present. Networks having this structure are called as feed forward networks. Feed forward networks often have one or more hidden layers of sigmoid neurons followed by an output layer of linear neurons. Multiple layers of neurons with nonlinear transfer functions allow the network to learn nonlinear and linear relationships between input and output vectors
C. The principle of BP neural network
Back propagation is a systematic method for training multi-layer artificial neural networks. BP neural network is reverse-propagation which based on the forward-layers and the study method of the least mean-square error. It has a mathematical foundation that is strong if not highly practical. It is a multi-layer forward network using extend gradient-descent based delta-learning rule, commonly known as back propagation (of errors) rule. Back propagation provides a computationally efficient method for changing the weights in a feed forward network, with differentiable activation function units, to learn a training set of input-output examples. Being a gradient descent method it minimizes the total squared error of the input-output computed by the net. The network is trained by supervised learning method. The weights of the network are randomly initialized before training starts. Then, a pair of patterns including the input patterns and the desired patterns is applied to the network. By propagating through the network layer by layer, a set of outputs is produced as the actual outputs of the network. At the output layer, the actual outputs are compared to the desired outputs, and an error signal is computed by subtracting the actual value from the desired value. This error signal is propagated backward through the network and the weight values are then adjusted by a magnitude proportional to the negative gradient of the error function, which is generally equal to the sum of squared errors. By this way, the difference between the actual and the desired outputs is minimized [8]. The BP network is a kind of multilayer feed forward network, and the transfer function within the network is usually a nonlinear function such as the sigmoid function. BP Neural Net is shown in Figure 3.
[image:4.612.185.433.585.716.2]NeuroXL Predictor
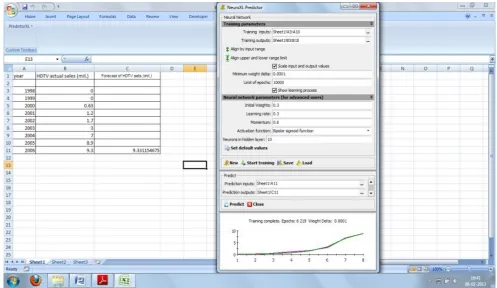
Inaccurate or misleading estimates can result in aggravation or total company chaos. Lost sales, inefficient allocation of resources, and bloated inventories are often a direct result of forecasts that failed to predict future conditions. Microsoft Excel provides a built-in tool for predictions, but the accuracy of its results is significantly reduced when non-lbuilt-inear relationships or missbuilt-ing data are present, which is often the case when analyzing historical business, investment, or sports data. There are lots of methods to simulate different models and predict the accurate forecast but one of the main reasons analysts have been slow to use advanced methods such as neural networks to improve forecasts is that such methods can be difficult to master.NeuroXL Predictor is a powerful, easy-to-use and affordable solution for advanced estimation and forecasting. It works on BP feed-forward network. Figure 4 shows the software window; with this window we just need to put the input data and output data from excel sheet and then it will create a new neuron which is ready to learn. After learning this is ready to predict. This is one of the easiest ways to find the forecasts. This software hardly costs $100.[12]
IV.FORECASTINGRESULTSFORHDTV
ValentinaDž [17] described the main influences and decision factors of the adoption of new telecommunications services/technologies and uses the Bass model in order to forecast the new technology adoption.
Table I
HDTV SALES PARAMETERS (p=0.002, q=0.66) [17]
Table II
HDTV SALES PARAMETERS (p=0.021, q=0.583) [17]
Year Forcasted
cumulative number of HDTV sets Y(t) Forecast of HDTV sets (mil.) S(t) HDTV actual sales Actual cumulati ve sales Number of househol ds in mil.
1998 0.20 0.20 - - 100
1999 0.53 0.33 - 0.87 100
2000 1.08 0.55 0.63 1.5 100
2001 1.98 0.90 1.2 2.7 100
2002 3.46 1.48 1.7 4.4 100
2003 5.86 2.40 3 7.4 100
2004 9.68 3.83 7 14.4 100
2005 15.64 5.95 8.3 23.3 100
2006 24.64 9.00 9.3 32.6 100
Year Forecasted
cumulative number of HDTV sets
Y(t) Forecast of HDTV sets (mil.) S(t) HDTV actual sales Actual cumulative sales Number of households in mil.
1998 0.252 0.252 - - 100
1999 0.42 0.67 - 0.87 100
2000 0.69 1.36 0.63 1.5 100
2001 1.13 2.49 1.2 2.7 100
2002 1.84 4.33 1.7 4.4 100
2003 2.96 7.29 3 7.4 100
2004 4.66 11.95 7 14.4 100
2005 7.12 19.07 8.3 23.3 100
Table III
HDTV SALES PARAMETERS (p=0.00252, q=0.656) [17]
They demonstrate the procedure of Bass diffusion parameters estimation in a case of HDTV service. To find the forecast they try to find the pattern of sales by finding the life assessment cycle using the data of similar product like cable TV. It could be noticed that the Bass model could be effectively used to forecast the sales of new service/technology accurately, if the diffusion parameters are well estimated and also by taking into account the purchase power of users. They generate different constants and determine the forecast for the next year using that information. All of the forecasts and actual sales are shown in Table 1, Table 2 and Table 3. We use those data of actual sales in each year to find the appropriate forecast for the year 2006. The figure shows a screen shot in which we can see that predicted value for the year 2006 is 9.3311 millions, using NeuroXL Predictor network using bipolar sigmoid function, whereas actual one is 9.3. Comparing to the forecasts given Table 1, Table 2 and Table 3, for the year 2006, this one is more appropriate one.
Figure 4: Snap shot, showing NeuroXL Predictor’s window in MS EXCEL with forecasting result.
Year Forecasted
cumulative number of HDTV sets
Y(t)
Forecast of HDTV sets
(mil.) S(t)
HDTV actual sales
Actual cumulative
sales
Number of household
s in mil.
1998 2.1 2.1 - - 100
1999 5.35 3.25 - - 100
2000 10.25 4.90 0.63 0.63 100
2001 17.5 7.25 1.2 1.83 100
2002 27.65 10.15 1.7 3.53 100
2003 40.83 13.18 3 6.53 100
2004 56.16 15.33 7 13.53 100
2005 71.43 15.27 8.9 22.43 100
[image:6.612.58.555.430.718.2]V. CONCLUSION
We got the most appropriate forecast using NeuroXL Predictor. Most of the forecasting models require lot of information and patterns of sales of similar product to predict. By harnessing the latest advances in artificial intelligence and neural network technology, it delivers accurate and fast predictions for your business, financial, or sports forecasting tasks. Designed as an add-on to Microsoft Excel, make it is easy to learn and use yet powerful enough for the most demanding professiadd-onal.
REFERENCES
[1] AHMED, N. K., ATIYA, A. F., EL GAYAR, N.,& EL-SHISHINY, H.(2010). “ AN EMPIRICAL COMPARISON OF MACHINE LEARNING MODELS FOR TIME SERIES FORECASTING”. ECONOMETRIC REVIEWS (TO APPEAR),29(5-6).
[2] ALPAYDIN, E.(2010).“ INTRODUCTION TO MACHINE LEARNING. ADAPTIVE COMPUTATION AND MACHINE LEARNING (2ND ED.,)”. THE MIT PRESS. ISBN: 978-0-262-01243-0.
[3] BASS F.,“A NEW PRODUCT GROWTH MODEL FOR CONSUMER DURABLES.” MANAGE SCI 1969;15:215–27.
[4] CRONE, S. F.(2009).“MINING THE PAST TO DETERMINE THE FUTURE: COMMENTS”. INTERNATIONAL JOURNAL OF FORECASTING,25(3),456–460. ISSN: 0169-2070.
[5] FILDES, R.,&KINGSMAN, B. G.(2010).“INCORPORATING DEMAND UNCERTAINTY AND FORECAST ERROR IN SUPPLY CHAIN PLANNING MODELS”. JOURNAL OF THE OPERATIONAL RESEARCH SOCIETY,62,483–500.
[6] HAND, D.(2008). “MINING THE PAST TO DETERMINE THE FUTURE: PROBLEMS AND POSSIBILITIES”. INTERNATIONAL JOURNAL OF FORECASTING. ISSN:01692070. [7] HASTIE, T., TIBSHIRANI, R.,& FRIEDMAN, J.(2009).“THE ELEMENTS OF STATISTICAL LEARNING: DATA MINING* INFERENCE AND PREDICTION (2ND ED.)”.
SPRINGER.
[8] HAYKIN, S.(1994).“NEURAL NETWORKS: A COMPREHENSIVE FOUNDATION”. NEW JERSEY: PRENTICE-HALL.
[9] ISLAM T, MEADE N. THE DIFFUSION OF SUCCESSIVE GENERATIONS OF A TECHNOLOGY: A MORE GENERAL MODEL. TECHNOL FORECASTING SOCIAL CHANGE 1997;56:49–60.[9]JAN G. DE GOOIJER, ROB J. HYNDMAN,“25 YEARS OF TIME SERIES FORECASTING”, INTERNATIONAL JOURNAL OF FORECASTING 22(2006)443– 473.
[10] LENDASSE, A.(ED.)(2007). ESTSP 2007: PROCEEDINGS. ISBN:978-951-22-8601-0. LENDASSE, A.,(ED.)(2008). ESTSP 2008: PROCEEDINGS, MULTIPRINTOY/ OTAMEDIA. ISBN:978-951-22-9544-9.
[11] MITCHEL, T. M.(1997).“MACHINE LEARNING”. NEW YORK: MCGRAW-HILL.
[12] HTTP://NEUROXL.COM/PRODUCTS/EXCEL-FORECASTING-SOFTWARE/NEUROXL-PREDICTOR.HTM.
[13] PARKER, D. B.(1985).“LEARNING LOGIC: CASTING THE CORTEX OF THE HUMAN BRAIN IN SILICON”. TECHNICAL REPORT, TR-47. CENTER FOR COMPUTATIONAL RESEARCH IN ECONOMICS AND MANAGEMENT SCIENCE, CAMBRIDGE, MA: MIT PRESS.
[14] PRICE, S.(2009).“MINING THE PAST TO DETERMINE THE FUTURE: COMMENTS”. INTERNATIONAL JOURNAL OF FORECASTING,25(3),452–455.
[15] RUMELHART, D. E., HINTON, G. E.,& WILLIAMS, R. J.(1986).“ LEARNING INTERNATIONAL REPRESENTATIONS BY ERROR PROPOGATION”. IN D. E. RUMELHART& J. L. MCCLELLAND (EDS.), PARALLEL DISTRIBUTED: EXPLORATIONS IN THE MICROSTRUCTURE OF COGNITION. CAMBRIDGE: MIT PRESS.
[16] SUNDARESHRAMNATH, STEVE ROCK, PHILIP SHANE,“THE FINANCIAL ANALYST FORECASTING LITERATURE: A TAXONOMY WITHSUGGESTIONS FOR FURTHER RESEARCH”, INTERNATIONAL JOURNAL OF FORECASTING 24(2008)34–75.
[17] VALENTINADŽ.RADOJIČIĆ1, GORAN Z.MARKOVIĆ2,“ NEW TECHNOLOGY FORECASTING USING THE BASS MODEL”, TELSIKS 2009, SERBIS NIS, OCTOMBER 7-9,2009.
[18] WERBOS, P.(1974).“BEYOND REGRESSION: NEW TOOLS FOR PREDICTION AND ANALYSIS IN THE BEHAVIORAL SCIENCES”. PHD THESIS, HARVARD UNIVERSITY, CAMBRIDGE, MA.
[19] WERBOS, P. J.(1988).“GENERALIZATION OF BACKPROPAGATION WITH APPLICATION TO A RECURRENT GAS MARKET MODEL. NEURAL NETWORKS”,1(4),339– 356. ISSN:0893-6080.