R E S E A R C H
Open Access
Characterizing heterogeneity in leukemic cells
using single-cell gene expression analysis
Assieh Saadatpour
1,2†, Guoji Guo
3,4,5,6,7†, Stuart H Orkin
3,4,5,6,8*and Guo-Cheng Yuan
1,2*Abstract
Background:A fundamental challenge for cancer therapy is that each tumor contains a highly heterogeneous cell
population whose structure and mechanistic underpinnings remain incompletely understood. Recent advances in single-cell gene expression profiling have created new possibilities to characterize this heterogeneity and to dissect the potential intra-cancer cellular hierarchy.
Results:Here, we apply single-cell analysis to systematically characterize the heterogeneity within leukemic cells
using the MLL-AF9 driven mouse model of acute myeloid leukemia. We start with fluorescence-activated cell sorting analysis with seven surface markers, and extend by using a multiplexing quantitative polymerase chain reaction approach to assay the transcriptional profile of a panel of 175 carefully selected genes in leukemic cells at the single-cell level. By employing a set of computational tools we find striking heterogeneity within leukemic cells. Mapping to the normal hematopoietic cellular hierarchy identifies two distinct subtypes of leukemic cells; one similar to granulocyte/monocyte progenitors and the other to macrophage and dendritic cells. Further functional experiments suggest that these subtypes differ in proliferation rates and clonal phenotypes. Finally, co-expression network analysis reveals similarities as well as organizational differences between leukemia and normal granulocyte/ monocyte progenitor networks.
Conclusions:Overall, our single-cell analysis pinpoints previously uncharacterized heterogeneity within leukemic
cells and provides new insights into the molecular signatures of acute myeloid leukemia.
Background
Characterization of cancer heterogeneity is of immense importance with significant clinical implications. To de-scribe this heterogeneity, a model of considerable current interest posits that tumors are hierarchically organized, and initiated by cancer stem cells, which are able to self-renew as well as to differentiate into all other lineages in the tumor [1].
One of the few cancer-types in which cancer stem cells have been intensively studied is acute myeloid leukemia (AML) [2-4]. AML is a clonal neoplastic disorder that is characterized by an increase in the number of myeloid cells in the bone marrow and an arrest in their matur-ation, frequently leading to hematopoietic insufficiency
[5]. Initial studies showed that only a rare subset of cells have the capacity to initiate the disease upon transplant-ation and, therefore, have the leukemia stem cell (LSC) property [2]. Further studies suggested that LSCs are located almost exclusively downstream of the normal progenitor compartment based on immunophenotype [6] and that they display a phenotype similar to granulo-cyte/monocyte progenitors (GMPs) [4]. However, it has also been shown that tumor-initiating activities can be found in immunophenotypically distinct compartments [7]. Therefore, it remains a challenge to dissect the cellu-lar hierarchy within leukemic cells. Simicellu-larly, the critical pathways for LSC functions also remain incompletely understood [8-10].
The hematopoietic system is one of the well-studied models for cellular differentiation for which the cellular hierarchy has been characterized [11,12]. The traditional model holds that the self-renewing hematopoietic stem cells (HSCs) are positioned at the apex of the hierarchy * Correspondence:[email protected];[email protected]
†Equal contributors
3
Division of Pediatric Hematology/Oncology, Boston Children’s Hospital, Boston, MA 02115, USA
1
Department of Biostatistics and Computational Biology, Dana-Farber Cancer Institute, Boston, MA 02215, USA
Full list of author information is available at the end of the article
and are capable of reconstituting the entire hematopoietic system, through sequential lineage differentiations to mul-tipotent progenitors (MPPs) [13-15], followed by differen-tiation into common lymphoid progenitors (CLPs) and common myeloid progenitors (CMPs) [16,17]. CMPs can further bifurcate to GMPs and megakaryocyte/erythroid progenitors (MEPs) [18]. However, alternative models for cellular hierarchy have also been proposed [19]. Single-cell analysis further suggests that the CMPs are highly hetero-geneous and contain one subgroup that may directly differentiate into megakaryocytes [20].
The recent development of microfluidic-based single-cell sorting technologies [21], high-throughput trans-criptomic profiling with a multiplexing quantitative PCR (qPCR) approach [20,22-25] or massively parallel se-quencing [26-33], and mass cytometry-based proteomic strategies [34-36] have greatly expanded the capacity for single-cell gene expression profiling, which was trad-itionally carried out by using fluorescence-activated cell sorting (FACS) with only a few markers, and provided a great opportunity to unearth cellular heterogeneity. These technologies have been used to investigate the develop-ment of the normal hematopoietic system, including mapping the cellular hierarchy [20,34], reconstructing transcriptional networks [20,25], and characterizing cel-lular heterogeneity in other cancers [23,37].
In this paper, we first utilize FACS analysis of seven surface markers and then apply our recently developed multiplexing qPCR approach to systematically inves-tigate the transcriptional profile of 175 genes in 71 leukemic cells in AML. We integrate these data with our previously published dataset on normal hematopoietic cells [20], and utilize an integrated set of computational tools to map the cellular hierarchy within leukemic cells, and to further elucidate the underlying transcriptional networks. Overall, our study provides novel insights into the cellular heterogeneity and organizing principles in AML.
Results
Comparing leukemic and normal hematopoietic cells at the single-cell level
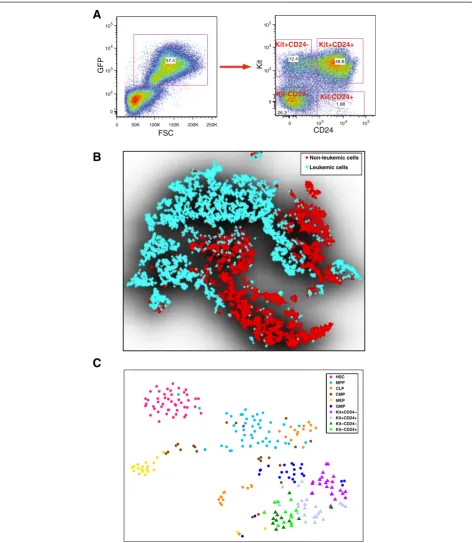
Previous studies suggest that the lineage hierarchy in the MLL-AF9 driven leukemia is complex [6,7,20]. Here, we aimed to combine FACS analysis and high-throughput single-cell qPCR analysis to interrogate the differences and similarities between leukemic and normal hemato-poiesis. We generated the MLL-AF9 mouse leukemia model using the previously described protocol [8]. We then stained MLL-AF9 primary leukemia bone marrow with antibodies against Flt3, lineage markers (Lin), Sca1, Kit, CD24, CD34, and CD16/CD32, and analyzed the samples by FACS (Figure 1A). These recipient bone mar-row cells contain both non-leukemic and leukemic cells.
Leukemic cell populations can be distinguished by their green fluorescent protein (GFP) expression, which origi-nates from the MLL-AF9 construct.
Traditional serial two-dimensional gating analysis of the FACS data may introduce bias in defining populations. It is desirable to analyze multiple channels together, inte-grating information from all seven markers. However, the high dimensionality of the data provides a challenge for visualization. The traditional principal component analysis is ineffective because it relies on a linear assumption, which is violated in single-cell gene expression data. To overcome this limitation, we employed a recently devel-oped nonlinear technique called t-distributed stochastic neighbor embedding (t-SNE) [38], which projects high-dimensional data into a low-high-dimensional space by con-verting the Euclidean distances between each pair of data points into heavy-tailed conditional probabilities that rep-resent similarities. The main advantage of t-SNE is that it preserves not only the global layout but also the local structure of the high-dimensional data (see Materials and methods for more details). Similar ideas have been used before to visualize mass cytometry data [39].
t-SNE analysis of the FACS data indicates that the non-leukemic cells are highly heterogeneous (Figure 1B; Additional file 1). Notably, the leukemic cells display much stronger heterogeneity compared with non-leukemic cells. In addition, there is strong overlap between leukemic and non-leukemic cells, suggesting that there remains a high degree of similarity between them, possibly due to incom-plete cell-fate transitions, and that these cells are difficult to separate based on immunophenotyping alone.
A
B
C
0 50K 100K 150K 200K 250K
FSC
0 102 103 104
105
57.4
0 103 104 105
0 103 104 105
12.4
48.8
1.88 26.3
GFP
CD24
Kit
Kit+CD24- Kit+CD24+
Kit-CD24+
Kit-CD24-Non-leukemic cells
Leukemic cells
CLP CMP
GMP HSC
MEP MPP
[image:3.595.63.536.88.632.2]Kit+CD24+
As an initial glimpse of the transcriptome landscape, we applied the t-SNE method to project the qPCR data onto a two-dimensional plane (Figure 1C). The color-coding was overlaid on the t-SNE map to help better visualize different cell types. The positions of the HSCs and normal progenitor cells are consistent with their lineage relationships. In particular, HSCs form a clearly defined cluster, whereas MPPs are positioned between HSCs and more specialized progenitors. Of note, the leukemic cells are positioned proximal to GMPs but dis-tal to HSCs.
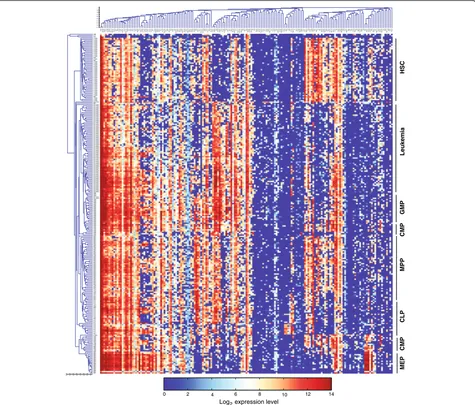
Unsupervised hierarchical clustering according to the single-cell gene expression profile correctly positioned the normal cells of common lineages next to each other
(Figure 2), indicating the high quality of the data. An interesting exception is that CMPs form two separate clusters, which are positioned next to GMPs and MEPs, respectively. Such heterogeneity among CMPs is consist-ent with our previous study, which further showed that these two subgroups are primed to different cell lin-eages [20]. In addition, the leukemic cells form a distinct cluster next to GMPs. The leukemic cells express a
number of GMP-specific genes, including CD48,CD52,
CD53, Sell, Cebpa, and Dtx4, but not the key HSC-specific genes such as Gata2, Hlf, and Mpl, suggesting that leukemic cells resemble a GMP-like cell state but are highly distinguishable from HSCs. Similar results were obtained by using a self-organizing map [40] (data
Actb
Cdc42GapdhCycs Ccnd3Mbd2Suz12Dnmt1Ezh2Ikzf1BaxCdk4Ldb1
Ctnnb1Brd3
Smarca4
Trp53Akt1MybPtenCdk2Max Casp8Tfrc
Cdkn3Ccnb2Ccnb1Ccna2Cdk1Ccne1Ccne2Rb1CcncPIk3R2Aebp2Bmi1MycFoxo3 Dnmt3bSos1Akt2
PIk3caTcf4LSD1Lyl1 Tnfrsf21Tgfb1Runx1Stat6Bcl2l11Casp9Stat1
Cdkn1bNfkb1Bcl2l1ETS2CD34Flt3 Satb1Esr1
Pecam1Dnmt3a Akt3Etv6Foxo1Bcl2
Ccnd1CD52CD53Sell CD48CebpaDtx4Fcgr3Fcgr2b
Irf8
Csf1rGfi1Sfpi1 Runx2Tnfrsf1a
Fli1
Notch1Tnfrsf1bCdkn2c Tcf3EporEed
Ep300Lin28aCdkn2d Id2Fas
CebpbCbx8Ccna1Tnfsf12Fosl1Prf1Cdk5Tgfb2Bcl11bTcf7Pax9Cbx2Tal1 Cdkn2aCcnb3Cdkn2bHey1Pax5Ebf1Irf4Il7RETS1
Cdkn1a
Ar
Dtx1Pax4 Zfp532Ifi205Pbx1Ifitm1Meis1Erg
Stat4Ly6aIfi203NdnMycnHlfMpl Gata2Gata3Zbtb20Ikzf2RoraCD63Muc13Dach1Lmo2Kit
Nfat5Stat3Zbtb38CD9Etv3 Slamf1SdprvWFKdr
Klf12Plag1TekMllt3 Tnfsf10Tgfb3Irf6Klf1Gata1Gfi1bCD55Nfia
Zfpm1Tob1
Cdkn1c
Zhx2CD41Zfp612 AhrBad
Bcl11aMll5APCHes5 0.1 0.2 0.3 0.4 0.5 0.6 0.7 0.8 0.9 1 MEP MEP MEP MEP MEP MEP MEP MEP MEP MEP MEP MEP MEP MEP MEP MEP MEP CMP CMP MEP MEP CMP CMP CMP MPP CMP CMP CMP CMP LTHSC CLP CLP CLP CLP CLP CLP CLP CLP CLP CLP CLP CLP MPP CLP CLP CLP CLP CLP CLP CLP MPP CMP CLP CLP CLP CLP MPP MPP MPP CLP CLP MPP CMP CLP CMP MPP MPP CMP MPP MPP MPP MPP MPP MPP MPP MPP MPP MPP MPP MPP MPP MPP MPP MPP MPP MPP MPP MPP MPP MPP CMP MPP MPP MPP MPP MPP CMP MPP MPP MPP MPP MPP MPP MPP MPP MPP CMP CMP GMP CMP CMP CMP CMP GMP GMP GMP GMP GMP CMP GMP GMP GMP GMP GMP GMP GMP GMP GMP GMP GMP GMP GMP CMP GMP Kit+CD24+ GMP GMP GMP Kit+CD24+ Kit+CD24+ Kit+CD24+ Kit+CD24+ Kit+CD24+ Kit+CD24+ Kit+CD24+ Kit+CD24+ Kit+CD24+ Kit+CD24+ Kit+CD24+ Kit+CD24+ Kit+CD24+ Kit+CD24+ Kit+CD24+ Kit+CD24+ Kit+CD24+ Kit+CD24+ Kit+CD24+ Kit+CD24+ Kit+CD24+ Kit+CD24+ MEP LTHSC LTHSC LTHSC MPP LTHSC LTHSC LTHSC LTHSC LTHSC LTHSC LTHSC LTHSC LTHSC LTHSC LTHSC LTHSC LTHSC LTHSC LTHSC LTHSC LTHSC LTHSC LTHSC LTHSC LTHSC LTHSC LTHSC LTHSC LTHSC LTHSC LTHSC MPP LTHSC MPP LTHSC LTHSC LTHSC LTHSC LTHSC LTHSC LTHSC LTHSC LTHSC LTHSC LTHSC LTHSC LTHSC LTHSC LTHSC CLP CLP GMP 0.1 0.2 0.3 0.4 0.5 0.6 0.7 0.8 HSC Leukemia GMP MPP CLP CMP MEP CMP
0 2 4 6 8 10 12 14
[image:4.595.62.537.278.683.2]Log expression level2
not shown). This is consistent with a model in which leukemic cells originated from GMPs [4].
Mapping cellular hierarchy identifies subtypes of leukemic cells
In order to map the cellular hierarchy in leukemic cells, we took advantage of a reference map recently identified in the normal hematopoietic system by using single-cell analysis [20]. This map was obtained by profiling the expression levels of commonly used cell surface markers (280 genes) in more than 1,000 cells followed by construction of a minimum spanning tree using the SPADE (spanning-tree progression analysis of density-normalized events) algorithm [34,41]. Each branch of the tree represents a group of cells with similar lineage relationships. In order to map each leukemic cell to the SPADE tree, we implemented a strategy using informa-tion only from the set of 33 genes (Addiinforma-tional file 3) profiled in both datasets. To test whether these 33 com-mon genes were sufficient for reproducing the cellular hierarchy, we first applied this strategy to re-analyze the original dataset in [20]. We calculated the mean expres-sion profile of these 33 genes for each node in the SPADE tree, and its Euclidian distance to each cell in the dataset. Then a cell was mapped to the node corre-sponding to the smallest distance. While the SPADE tree was originally constructed by using information from all 280 genes, we found that our mapping strategy preserves the essential lineage relationships. In total, 90% of the cells were projected to the proximity (≤2 steps) of their original position in the SPADE tree, and 63% of the cells were mapped exactly to the same node (Figure S2A in Additional file 4). For comparison, we randomly selected 100 gene lists, each containing 33 genes, and examined how well the lineage relationships are preserved. We found that, on average, 84% of the cells were mapped to the proximity (≤2 steps) of their original position in the SPADE tree (Figure S2B in Additional file 4), suggesting that the mapping accuracy can be largely preserved by the use of a relatively small number of genes.
We next applied this strategy to map our leukemic and control cells to the SPADE-derived cellular hier-archy (Figure 3A). Again, most normal cells are mapped to the expected branches, whereas the cells that are mapped to a different location might result from im-perfect clustering. Notably, the leukemic cells are further divided into two subgroups, each projected onto a se-parate branch of the SPADE tree. The first group (which we call Leukemia 1, containing 29 cells) is mapped to a branch corresponding to GMPs, whereas the second group (which we call Leukemia 2, containing 42 cells) is mapped to the branch corresponding to dendritic cells/ macrophages. In addition to the 33 common genes, using the expression profile of about 140 additional genes in our
dataset (Additional file 2) provides an opportunity to un-cover important differences between the leukemic cells and their closest normal lineages. We used the Wilcoxon-Mann-Whitney rank sum test [42], a robust and non-parametric method, to compare the gene expression levels between Leukemia 1 cells and GMPs. We used a stringent criterion (adjusted P-value <1E-5 and absolute log fold change≥2) for differential gene expression in order to en-hance specificity. We note that while we may miss certain genes that are differentially expressed between the two populations, the advantage of choosing a stringent cutoff is that we can then focus on the genes that truly differ be-tween the two cell types. Using this cutoff, we identified four differentially expressed genes, namelyMeis1,Cdkn2c,
Pecam1, andAebp2(Additional file 5, which also includes adjustedP-values for the rest of the genes). The most
dif-ferentially expressed gene is Meis1 (log fold change =
7.77), consistent with the previous finding thatMeis1is an essential and rate-limiting regulator of MLL-induced LSC potential [43]. The fact that Meis1is highly expressed in Leukemia 1 suggests that this subgroup of cells may be highly aggressive. Interestingly,Cdkn2c, a negative regula-tor of cell cycle, is also over-expressed in Leukemia 1 cells. We next compared the transcriptional profiles bet-ween the two subgroups of leukemic cells and identified 14 differentially expressed genes (adjustedP-value <1E-5
and absolute log fold change ≥2), all of which are
up-regulated in Leukemia 1 (Additional file 5). The mean expression levels for four such genes are overlaid on the SPADE tree in Figure 3B. Among the differentially ex-pressed genes, Kitis a well-characterized marker, which
is frequently mutated in AML.Etv6andRunx1are known
leukemic regulators [44-46], andSuz12andEzh2are core members of the Polycomb repressive complex 2 (PRC2), whose activities have been shown to be essential for MLL-AF9 driven leukemia [8]. In particular,Ezh2inhibition was recently found as a therapeutic strategy for Ezh2-mutant
cancers [47,48]. Furthermore, Brd3 is a member of the
bromodomain-containing protein family associated with wide-range activation of super-enhancers in cancer [49].
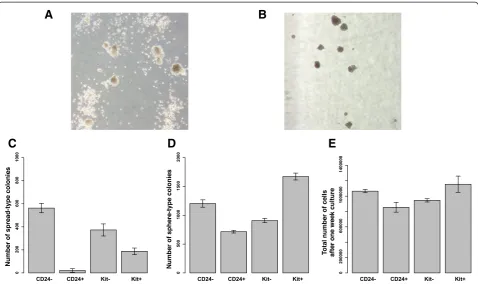
We then aimed to test whether these subtypes of leu-kemic cells have different functions. However, one chal-lenge was that only a few of the differentially expressed genes were surface markers, making it difficult to purify each populationa priori. Nonetheless, we recognized that
Kitwas the most differentially expressed gene between the two cell types (adjusted P-value = 7.91E-11; Additional file 5), and that 83% of the leukemic cells with Kit+CD24-immunophenotype were mapped to Leukemia 1 as op-posed to Leukemia 2 cells. Therefore, we FACS sorted
subpopulations in the primary leukemia using Kit and
CD24 markers as a proxy to the two leukemic cell
performedin vitro colony-forming assays to test prolif-eration rate and differentiation capability of these sorted cells. Our results indicate that differential expression of these markers correlates with different clonal activity (Figure 4). In particular, we observed that CD24- leukemic cells grew much faster and generated both adhesive sphere-type colonies and non-adhesive spread-sphere-type colonies. On the other hand, CD24+ leukemic cells generated signifi-cantly fewer colonies (predominantly adhesive sphere-type colonies). This is consistent with previous in vivo trans-plantation experiments, suggesting that CD24- leukemic granulocyte-monocyte progenitors (LGMPs) are more po-tent for inducing leukemia than CD24+ LGMPs [20]. Fur-thermore, Kit+ leukemic cells generated a greater number of sphere-type colonies than the Kit- leukemic cells. We
note that in Leukemia 1 cells, 72% of the population have a CD24- immunophenotype and 97% of the population have a Kit+ immunophenotype. Therefore, our experi-mental data provide further evidence that Leukemia 1 cells are more proliferative than Leukemia 2 cells.
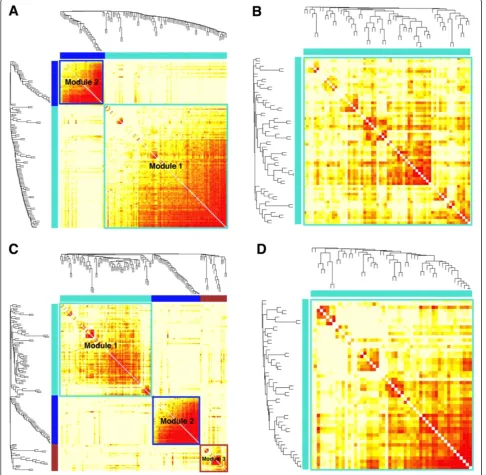
The leukemic cell subtypes are characterized by distinct co-expression networks
Genes do not function independently but rather interact in concert through a complex regulatory network. In order to systematically identify gene modules with coor-dinated activities in leukemic cells at the single-cell resolution, we employed weighted gene co-expression network analysis (WGCNA) [50,51]. By analyzing one sub-set of cells at a time, we constructed four co-expression
A
[image:6.595.59.537.89.480.2]B
networks, corresponding to GMPs, all leukemic cells, Leukemia 1 cells, and Leukemia 2 cells (Figure 5). Both all-leukemia and Leukemia 1 networks are further divided into multiple modules containing highly correlated (or anti-correlated) genes, whereas the GMP and Leukemia 2 net-works each contains a single module. The list of genes in each module is given in Additional file 6.
Consistent with our t-SNE and hierarchical clustering analyses, the GMP and all-leukemia networks share sig-nificant similarity. Of the 64 genes in the GMP module, 56 (88%) are contained in Module 1 of the all-leukemia network (Additional file 7). Surprisingly, three of the dif-ferentially expressed genes (Meis1, Cdkn2c, and Aebp2) are contained in this common module, suggesting that cell-fate differences largely reflect different states of a common regulatory circuitry. To see that this is not a contradiction, we note that differential expression and differential co-expression are two distinct modes of chan-ges. Differential expression reflects the change of activity of a gene in isolation whereas differential co-expression reflects the change of correlation between a pair of genes. As a simple example, if the expression level of transcrip-tion factorAis higher in condition 1 compared with
con-dition 2, and that gene B is a direct target of A whose
expression level is positively correlated withA, then both
AandBare differentially expressed between the two con-ditions, but they are not differentially co-expressed, since their relationship remains the same. Generally speaking, if a set of genes is co-regulated, then differential expression may occur without change of co-expression.
We also found important differences between the GMP and all-leukemia networks. Among the 39 genes that are uniquely contained in Module 1 of the all-leukemia net-work (Additional files 6 and 7) are a number of well-characterized oncogenes, such as Ar, Bmi1, ETS1, Kit,
Lin28a, as well as tumor repressor genes, such as Rb1. The all-leukemia network also contains an additional module, Module 2, which is likely to be regulated inde-pendently of Module 1. Module 2 has little overlap (2/35) with the GMP network (Additional file 7). Out of 35 genes in Module 2, 14 (Additional files 6 and 7) are associated with regulation (either positively or negatively) of cell pro-liferation, includingBcl11b,Flt3,Gata3,Cdkn1a,Cdkn2a,
Tek, Esr1, Pbx1, Cdkn2b, APC, Tcf7, Tgfb2, Tgfb3, and
Mycn. Among these genes, Pbx1 is especially important
because it has been shown to be a critical gene required in leukemia initiation [52,53].
We next compared the Leukemia 1 and Leukemia 2 networks to identify subtype-dependent differences. These two networks have strikingly different modular structures.
A
C
D
E
[image:7.595.59.538.88.372.2]B
The Leukemia 1 network contains three modules, al-though Module 3 is rather small and less organized; whereas the Leukemia 2 network contains only a single module. Of the 52 genes in the Leukemia 2 network, 31 (60%) are common with Module 1 of the Leukemia 1 net-work (Additional file 7). This common set contains 5 of the 14 genes that are differentially expressed between these two subtypes, further suggesting that differential
[image:8.595.56.543.92.567.2]gene activities are coordinately regulated through a com-mon circuitry. This conclusion does not depend on the exact P-value cutoff for differential expression, as we ar-rive at similar results by choosing the top 30 or 50 differ-entially expressed genes between the two leukemic cell subtypes (that is, a 2.1- or 3.6-fold increase in the number of differential genes, respectively). In these cases, we found a 2.4- or 3.6-fold increase in the number of differentially
Figure 5Network modules identified by weighted gene co-expression network analysis.Co-expression networks for:(A)all leukemic cells;
expressed genes that belong to the common module of the two subtypes. This approximately linear relationship suggests that our conclusion is unaffected by the number of genes in question. We note that only 5 of 40 genes in Module 2 of the Leukemia 1 network are shared in the Leukemia 2 network (Additional file 7). Comparison with the all-leukemia network suggests that Module 2 of the all-leukemia network is retained in Module 2 of the Leukemia 1 network, sharing 33 genes, but lost in the Leukemia 2 network (Additional file 7). Similar results were obtained by using an alternative approach called DiffCoEx [54], which systematically identifies differentially co-expressed modules between two conditions by group-ing genes accordgroup-ing to their shared, but subtle, differential correlation patterns (see Additional files 8, 9, and 10 for details). Taken together, these analyses suggest that there are significant network differences between the leukemic cell subtypes.
Discussion
Cancers are associated with distinct heterogeneity. Mo-lecular characterization and functional analysis of such heterogeneity are critical for understanding their origin and progression and treatment outcomes, which may then serve as an important guide for developing new therapeutic strategies. Here, we applied single-cell gene expression analysis to systematically characterize the cel-lular heterogeneity in AML using an MLL-AF9 driven mouse model. Our analysis identified significant vari-ation of gene expression profiles within the leukemic cells, which can be explained in part by the differences in their corresponding gene networks.
The t-SNE analysis and unsupervised hierarchical clus-tering suggest that the transcriptomic state of leukemic cells is close to GMPs and far away from HSCs, support-ing a model in which LSCs are not directly linked with HSCs [4]. We further investigated the cellular hierarchy by using a previously generated lineage tree of the nor-mal hematopoietic system as a guide [20]. We found that the mapping accuracy was quite high even with a relatively small number of markers (33 genes common between the genes in Additional file 2 and the dataset used in [20]), suggesting significant redundancy among the cell surface markers. The robustness of this strategy suggests that it may have potential applications in map-ping cellular hierarchy of other single-cell data in the hematopoietic system. Using this mapping strategy, we found two subtypes of leukemic cells with one (Leukemia 1) resembling GMPs and the other (Leukemia 2) resem-bling macrophage and dendritic cells. However, differen-ces still exist between Leukemia 1 cells and normal GMPs.
Importantly, Meis1, a rate-limiting factor for the
de-velopment of AF9-MLL induced AML [43], is highly expressed only in the leukemic cells. We also found
important differences between the two subtypes of leu-kemic cells, with Leukemia 1 cells overexpressing a num-ber of important leukemia regulators, including Etv6and
Runx1, providing support that these cells are more im-portant for tumor initiation. Notably, Leukemia 1 cells also over-express a number of chromatin regulators,
in-cluding Brd3and Polycomb complex membersEzh2 and
Suz12, all of which have been linked with leukemia and other cancers [8,47,48]. By using in vitro colony-forming assays we found that the Leukemia 1 population, which is enriched with a Kit+CD24- immunophenotype, has a higher proliferation rate and differentiation capability than
the Leukemia 2 population. However, we note that Kit
and CD24 markers alone are insufficient to completely
distinguish the two leukemic cell subtypes.
Network modeling is increasingly recognized as a powerful tool for understanding complex biological sys-tems, including the hematopoietic system [55,56]. Efforts are underway to apply network-modeling approaches for the computational elucidation and analysis of single-cell data [20,25,30]. Here, we employed a co-expression network-based method (WGCNA, [50,51]) to analyze single-cell gene expression data, using the identified cellular hierarchy as a guide. Our analysis identified a core module that is common between GMPs and leuke-mia networks, and suggested that much of the gene ex-pression level changes between these two cell types can be viewed as a switch of allowable states within a common network module. On the other hand, we also identified significant differences between the networks. For example,
Pbx1, which cooperates with Meis1 in leukemogenesis
[53], is regulated by a separate module. As such, our ana-lysis demonstrates that network modeling provides mech-anistic insights into organizing principles of leukemia.
LSCs are associated with poor prognosis and treatment failure. However, the exact molecular signature of LSCs remains incompletely characterized. While it has been im-plicated that LSCs have a GMP-like immunophenotype, the fact that there is significant variability of outcome in LGMP-transfected mouse [20] indicates that there exists significant heterogeneity among LGMPs. Such heterogen-eity was clearly recapitulated in our single-cell analysis. Our results suggest that only one subgroup of leukemic cells (Leukemia 1) is likely to be more aggressive, as vali-dated by our functional experiments. Interestingly, our analysis shows that the gene expression profile of leu-kemic cells is, in general, different from HSCs, supporting the idea that the 'stemness' of LSCs is distinct from that of normal stem cells [4].
analysis will be useful not only to refine the molecular signature of LSCs but also to identify critical pathways for leukemogenesis. Another important area of future re-search is to link the association between transcriptomic changes and genetic/epigenetic alterations. Such analysis will provide important mechanistic insights that cannot be obtained by gene expression analysis alone.
Conclusions
Taken together, our results demonstrate that combining single-cell gene expression profiling technology and com-putational analyses provides novel insights into hetero-geneity and cellular hierarchy in cancer. The refined characterization of the gene signature of LSCs may fa-cilitate the development of therapeutic strategies that may overcome drug resistance, thereby improving treat-ment outcomes.
Materials and methods
Ethics statement
All animals were housed in ARCH, the animal facility of Boston Children’s Hospital, under proposals approved by the Animal Care Committee of the hospital.
Generation of MLL-AF9 leukemic cells
Primary leukemia was generated as described before [8]. In brief, ecotropic retroviral vectors were generated by cotransfection of 293 T cells with packaging constructs. Lin-Sca1+Kit+(LSK) cells from mouse bone marrow were transduced with MLL-AF9-GFP and maintained in methylcellulose (Stem Cell Technologies, Vancouver, British Columbia, Canada) with supplemental cytokines for three days. Colonies were transplanted into suble-thally irradiated (600 rad) C57BL6 recipients at 5 × 10⁵ cells per mouse. Leukemic cells were collected from bone marrow of multiple sick recipients after four weeks and then pooled for analysis.
FACS sorting and single-cell collection
Bone marrow cells were isolated by crushing iliac crest bones, femurae and tibiae in phosphate-buffered saline containing 5% fetal calf serum and 2 mM EDTA. After red blood cell lysis, the remaining cells were stained with monoclonal antibodies, analyzed and sorted on the BD FACSAria II (BD Bioscience, San Jose, CA, USA). Indi-vidual cells were sorted directly into 96-well PCR plates loaded with PCR buffer under single-cell mode. All data were analyzed with FlowJo (Tree Star, Ashland, OR, USA).
One tube single-cell sequence specific pre-amplification
Individual primer sets were pooled to a final
concentra-tion of 0.1 μM for each primer. Individual cells were
sorted directly into 96-well PCR plates loaded with 5 μl
RT-PCR master mix (2.5 μl CellsDirect reaction mix
(Invitrogen, Carlsbad, CA, USA), 0.5 μl primer pool,
0.1 μl RT/Taq enzyme (Invitrogen), 1.9 μl nuclease-free water) in each well. Sorted plates were immediately frozen on dry ice. After brief centrifugation at 4°C, the plates were immediately placed on the PCR machine. Cell lyses and sequence-specific reverse transcription were per-formed at 50°C for 60 minutes. Then reverse transcriptase inactivation and Taq polymerase activation were achieved by heating to 95°C for 3 minutes. Subsequently, in the same tube, cDNA went through 20 cycles of sequence-specific amplification by denaturing at 95°C for 15 s, an-nealing and elongation at 60°C for 15 minutes.
High-throughput microfluidic real-time PCR
Pre-amplified products were diluted five-fold prior to analysis. Amplified single-cell samples were analyzed with Universal PCR Master Mix (Applied Biosystems, Foster City, CA, USA), EvaGreen Binding Dye (Biotium, Hayward, CA, USA) and individual qPCR primers using 96.96 Dynamic Arrays on a BioMark System (Fluidigm, South San Francisco, CA, USA). Three dynamic arrays loaded with different primer sets were used for each sample plate. Ct (threshold cycle) values were calculated using the BioMark Real-Time PCR Analysis software (Fluidigm).
In vitrocolony forming assay
We plated 5,000 cells from each population in 1.5 ml of Methocult M3234 (Stem Cell Technologies) supplemen-ted with IL3 (10 ng/ml), IL6 (5 ng/ml), IL7 (10 ng/ml) and stem cell factor (20 ng/ml). Methylcellulose cultures were incubated at 37°C in a humidified atmosphere with 5% CO2in air. Colonies were scored on day 7.
Computational analyses
Gene expression levels were estimated by subtracting the Ct values from the background level of 28, which ap-proximates log2gene expression levels. Ct values higher
than 28 were first transformed to 28 and are represented by zero (no expression) in the data.
Unsupervised hierarchical clustering was achieved using an average linkage method and a correlation-based dis-tance (Pearson correlation) in MATLAB. The t-SNE ana-lysis [38] was performed using the MATLAB toolbox for dimensionality reduction [57]. This method is a variation of the stochastic neighbor embedding (SNE) method [58], which minimizes a cost function based on conditional probabilities to describe the similarities between data points in the high-dimensional space. That is, the simi-larity of data point yj to yi is estimated by the condi-tional probability thatyiwould pickyjas its neighbor, if neighbors were selected in proportion to their proba-bility density under a Gaussian distribution centered at
version of the SNE cost function and a Student's t-distribution rather than a Gaussian to compute the simi-larity between two points, thereby making the optimiza-tion problem easier to solve. It also reduces the tendency to crowd points together in the center of the map and thus produces better visualizations [38]. For the FACS dataset, since it was computationally intractable to map all the data into a two-dimensional space (Figure 1B), we ran-domly sampled 5,000 non-leukemic and 5,000 leukemic cells.
SPADE analysis [41] for mapping cellular hierarchy was done in MATLAB and R. We used the 56 cell clus-ters that were identified by SPADE analysis of more than 1,000 cells in [20]. Each normal or leukemic cell in our dataset was then assigned to the cluster whose mean was closest to that cell based on the Euclidean distance.
A two-sided Wilcoxon-Mann-Whitney rank sum test, implemented in the coin package [59] in R, was employed to identify differentially expressed genes. P -values were adjusted using the Benjamini and Hoch-berg method [60] in R. The fold change of each gene in two cell populations was calculated as the
differ-ence of medians of the log2 expression levels for the
two groups.
Weighted gene co-expression network analysis was
done using the WGCNA package [50] in R. Anti-log2
transformation was applied to convert log2 expression
levels to a normal scale. To construct unsigned weighted networks, WGCNA makes use of a power adjacency func-tionaij= |cor(xi,xj)|βto define the connection strength be-tween any pairs of genesxiand xjand implements a soft power threshold (β) approach that aims at approximating a scale-free topology (that is, the frequency distribution,
p(k), of the network connectivity,k, follows a power law)
to the network [50,51]. For each network, we chose βin
such a way that the model fitting index R2, defined as the square of the correlation between log10 (p(k)) and
log10(k), is greater than 0.85. More specifically,β= 6, 4, 5,
and 4 for the GMP, all-leukemia, Leukemia 1 and Leu-kemia 2 networks, respectively. The module detection was achieved by using average linkage hierarchical clustering, which uses a dissimilarity measure based on the topo-logical overlap matrix (TOM) [50,51], and a dynamic tree-cut algorithm. Topological overlap considers each pair of genes in relation to all other genes in the network and, as such, genes that are connected to roughly the same group of genes in the network have a high topological overlap. The modules were then visualized using a TOM plot [50,51], which is a color-coded depiction of the values of the TOM-based dissimilarity matrix. We note that all the genes were considered in constructing each of the co-expression networks in our model, but only those genes that were assigned to a co-expressed module were shown in the final networks.
Additional files
Additional file 1: Figure S1.Distributions of different markers in the two subgroups of non-leukemic cells using FACS data. The red (blue) boxplots correspond to the non-leukemic cell subgroup given on the right (left) in Figure 1B.
Additional file 2: Table S1.Single-cell gene expression data in leukemic cells. All gene expression data are represented as log2 expression level above the system background (Ct = 28), which is approximately equal to 28 minus raw Ct (from each qPCR reaction). Ct values higher than 28 were transformed to 28, and are represented by zero (no expression) in the data. Each column corresponds to a specific gene and each row corresponds to a single leukemic cell.
Additional file 3: Table S2.List of the 33 genes used for SPADE analysis.
Additional file 4: Figure S2.Prediction accuracy of the SPADE tree mapping strategy. (A) Using the 33 common genes discussed in the main text. (B) Using the average of 100 randomly selected sets of 33 genes from the data. The error bars represent standard deviation. In both graphs, the y-axis represents the fraction of cells that is mapped to a cluster within a certain distance to the original cluster.
Additional file 5: Table S3.List of the identified differentially expressed genes. List of all the genes along with their adjustedP-values and log fold changes are given as well.
Additional file 6: Table S4.List of genes in each network module represented in Figure 5.
Additional file 7: Figure S3.Venn diagrams showing the overlap between the network modules given in Figure 5.
Additional file 8: Text S1.Details of the differential co-expression module analysis between Leukemia 1 and Leukemia 2 using DiffCoEx.
Additional file 9: Figure S4.Comparative correlation heat map showing differentially co-expressed modules between Leukemia 1 and Leukemia 2. The upper/lower diagonal of the matrix shows correlations between pairs of genes in Leukemia 1/Leukemia 2 populations. Each row and column corresponds to a gene. The modules are indicated by color bars next to the heat map.
Additional file 10: Table S5.List of genes in the differentially co-expressed modules represented in Additional file 9.
Abbreviations
AML:acute myeloid leukemia; CLP: common lymphoid progenitor; CMP: common myeloid progenitor; FACS: fluorescence-activated cell sorting; GFP: green fluorescent protein; GMP: granulocyte/monocyte progenitor; HSC: hematopoietic stem cell; IL: interleukin; LGMP: leukemic granulocyte-monocyte progenitor; LSC: leukemia stem cell; MEP: megakaryocyte/ erythroid progenitor; MPP: multipotent progenitor; PCR: polymerase chain reaction; qPCR: quantitative PCR; SNE: stochastic neighbor embedding; SPADE: spanning-tree progression analysis of density-normalized events; TOM: topological overlap matrix; t-SNE: t-distributed stochastic neighbor embedding; WGCNA: weighted gene co-expression network analysis.
Competing interests
The authors declare that they have no competing interests.
Authors’contributions
AS, GG, SHO, and G-CY conceived and designed the research, and drafted the manuscript; GG conducted the experiments. AS and G-CY analyzed the data. All authors read and approved the final manuscript.
Authors’information
Assieh Saadatpour and Guoji Guo are joint first authors.
Acknowledgements
Author details
1
Department of Biostatistics and Computational Biology, Dana-Farber Cancer Institute, Boston, MA 02215, USA.2Department of Biostatistics, Harvard
School of Public Health, Boston, MA 02115, USA.3Division of Pediatric Hematology/Oncology, Boston Children’s Hospital, Boston, MA 02115, USA.
4
Department of Pediatric Oncology, Dana-Farber Cancer Institute, Boston, MA 02215, USA.5Harvard Medical School, Boston, MA 02115, USA.6Harvard Stem
Cell Institute, Cambridge, MA 02138, USA.7Center of Stem Cell and Regenerative Medicine, Zhejiang University, School of Medicine, Hangzhou 310058, China.8Howard Hughes Medical Institute, Boston, MA 02115, USA.
Received: 26 July 2014 Accepted: 3 November 2014
References
1. Clevers H:The cancer stem cell: premises, promises and challenges.
Nat Med2011,17:313–319.
2. Bonnet D, Dick JE:Human acute myeloid leukemia is organized as a hierarchy that originates from a primitive hematopoietic cell.Nat Med
1997,3:730–737.
3. Hope KJ, Jin L, Dick JE:Acute myeloid leukemia originates from a hierarchy of leukemic stem cell classes that differ in self-renewal capacity.Nat Immunol2004,5:738–743.
4. Krivtsov AV, Twomey D, Feng Z, Stubbs MC, Wang Y, Faber J, Levine JE, Wang J, Hahn WC, Gilliland DG, Golub TR, Armstrong SA:Transformation from committed progenitor to leukaemia stem cell initiated by MLL-AF9.
Nature2006,442:818–822.
5. Lowenberg B, Downing JR, Burnett A:Acute myeloid leukemia.N Engl J Med1999,341:1051–1062.
6. Somervaille TC, Cleary ML:Identification and characterization of leukemia stem cells in murine MLL-AF9 acute myeloid leukemia.Cancer Cell2006,
10:257–268.
7. Gibbs KD Jr, Jager A, Crespo O, Goltsev Y, Trejo A, Richard CE, Nolan GP:
Decoupling of tumor-initiating activity from stable immunophenotype in HoxA9-Meis1-driven AML.Cell Stem Cell2012,10:210–217.
8. Neff T, Sinha AU, Kluk MJ, Zhu N, Khattab MH, Stein L, Xie H, Orkin SH, Armstrong SA:Polycomb repressive complex 2 is required for MLL-AF9 leukemia.Proc Natl Acad Sci U S A2012,109:5028–5033.
9. Trowbridge JJ, Sinha AU, Zhu N, Li M, Armstrong SA, Orkin SH:
Haploinsufficiency ofDnmt1impairs leukemia stem cell function through derepression of bivalent chromatin domains.Genes Dev2012,
26:344–349.
10. Wang Y, Krivtsov AV, Sinha AU, North TE, Goessling W, Feng Z, Zon LI, Armstrong SA:The Wnt/β-catenin pathway is required for the
development of leukemia stem cells in AML.Science2010,327:1650–1653. 11. Orkin SH, Zon LI:Hematopoiesis: an evolving paradigm for stem cell
biology.Cell2008,132:631–644.
12. Seita J, Weissman IL:Hematopoietic stem cell: self-renewal versus differentiation.Wiley Interdiscip Rev Syst Biol Med2010,2:640–653. 13. Morrison SJ, Weissman IL:The long-term repopulating subset of
hematopoietic stem cells is deterministic and isolatable by phenotype.
Immunity1994,1:661–673.
14. Morrison SJ, Wandycz AM, Hemmati HD, Wright DE, Weissman IL:
Identification of a lineage of multipotent hematopoietic progenitors.
Development1997,124:1929–1939.
15. Kiel MJ, Yilmaz OH, Iwashita T, Terhorst C, Morrison SJ:SLAM family receptors distinguish hematopoietic stem and progenitor cells and reveal endothelial niches for stem cells.Cell2005,121:1109–1121. 16. Kondo M, Weissman IL, Akashi K:Identification of clonogenic common
lymphoid progenitors in mouse bone marrow.Cell1997,91:661–672. 17. Akashi K, Traver D, Miyamoto T, Weissman IL:A clonogenic common
myeloid progenitor that gives rise to all myeloid lineages.Nature2000,
404:193–197.
18. Manz MG, Miyamoto T, Akashi K, Weissman IL:Prospective isolation of human clonogenic common myeloid progenitors.Proc Natl Acad Sci U S A2002,99:11872–11877.
19. Adolfsson J, Mansson R, Buza-Vidas N, Hultquist A, Liuba K, Jensen CT, Bryder D, Yang L, Borge OJ, Thoren LA, Anderson K, Sitnicka E, Sasaki Y, Sigvardsson M, Jacobsen SE:Identification of Flt3+lympho-myeloid stem cells lacking erythro-megakaryocytic potential a revised road map for adult blood lineage commitment.Cell2005,121:295–306.
20. Guo G, Luc S, Marco E, Lin TW, Peng C, Kerenyi MA, Beyaz S, Kim W, Xu J, Das PP, Neff T, Zou K, Yuan GC, Orkin SH:Mapping cellular hierarchy by single-cell analysis of the cell surface repertoire.Cell Stem Cell2013,13:492–505. 21. Thorsen T, Maerkl SJ, Quake SR:Microfluidic large-scale integration.
Science2002,298:580–584.
22. Buganim Y, Faddah DA, Cheng AW, Itskovich E, Markoulaki S, Ganz K, Klemm SL, van Oudenaarden A, Jaenisch R:Single-cell expression analyses during cellular reprogramming reveal an early stochastic and a late hierarchic phase.Cell2012,150:1209–1222.
23. Dalerba P, Kalisky T, Sahoo D, Rajendran PS, Rothenberg ME, Leyrat AA, Sim S, Okamoto J, Johnston DM, Qian D, Zabala M, Bueno J, Neff NF, Wang J, Shelton AA, Visser B, Hisamori S, Shimono Y, van de Wetering M, Clevers H, Clarke MF, Quake SR:Single-cell dissection of transcriptional
heterogeneity in human colon tumors.Nat Biotechnol2011,29:1120–1127. 24. Guo G, Huss M, Tong GQ, Wang C, Li Sun L, Clarke ND, Robson P:
Resolution of cell fate decisions revealed by single-cell gene expression analysis from zygote to blastocyst.Dev Cell2010,18:675–685.
25. Moignard V, Macaulay IC, Swiers G, Buettner F, Schutte J, Calero-Nieto FJ, Kinston S, Joshi A, Hannah R, Theis FJ, Jacobsen SE, de Bruijn MF, Gottgens B:Characterization of transcriptional networks in blood stem and progenitor cells using high-throughput single-cell gene expression analysis.Nat Cell Biol2013,15:363–372.
26. Jaitin DA, Kenigsberg E, Keren-Shaul H, Elefant N, Paul F, Zaretsky I, Mildner A, Cohen N, Jung S, Tanay A, Amit I:Massively parallel single-cell RNA-seq for marker-free decomposition of tissues into cell types.Science2014,343:776–779. 27. Ramskold D, Luo S, Wang YC, Li R, Deng Q, Faridani OR, Daniels GA,
Khrebtukova I, Loring JF, Laurent LC, Schroth GP, Sandberg R:Full-length mRNA-Seq from single-cell levels of RNA and individual circulating tumor cells.Nat Biotechnol2012,30:777–782.
28. Tang F, Barbacioru C, Bao S, Lee C, Nordman E, Wang X, Lao K, Surani MA:
Tracing the derivation of embryonic stem cells from the inner cell mass by single-cell RNA-Seq analysis.Cell Stem Cell2010,6:468–478. 29. Tang F, Barbacioru C, Wang Y, Nordman E, Lee C, Xu N, Wang X, Bodeau J,
Tuch BB, Siddiqui A, Lao K, Surani MA:mRNA-Seq whole-transcriptome analysis of a single cell.Nat Methods2009,6:377–382.
30. Xue Z, Huang K, Cai C, Cai L, Jiang CY, Feng Y, Liu Z, Zeng Q, Cheng L, Sun YE, Liu JY, Horvath S, Fan G:Genetic programs in human and mouse early embryos revealed by single-cell RNA sequencing.Nature2013,
500:593–597.
31. Deng Q, Ramskold D, Reinius B, Sandberg R:Single-cell RNA-seq reveals dynamic, random monoallelic gene expression in mammalian cells.
Science2014,343:193–196.
32. Shalek AK, Satija R, Adiconis X, Gertner RS, Gaublomme JT, Raychowdhury R, Schwartz S, Yosef N, Malboeuf C, Lu D, Trombetta JJ, Gennert D, Gnirke A, Goren A, Hacohen N, Levin JZ, Park H, Regev A:Single-cell transcriptomics reveals bimodality in expression and splicing in immune cells.Nature
2013,498:236–240.
33. Shalek AK, Satija R, Shuga J, Trombetta JJ, Gennert D, Lu D, Chen P, Gertner RS, Gaublomme JT, Yosef N, Schwartz S, Fowler B, Weaver S, Wang J, Wang X, Ding R, Raychowdhury R, Friedman N, Hacohen N, Park H, May AP, Regev A:Single-cell RNA-seq reveals dynamic paracrine control of cellular variation.Nature2014,510:363–369.
34. Bendall SC, Simonds EF, Qiu P, el AD A, Krutzik PO, Finck R, Bruggner RV, Melamed R, Trejo A, Ornatsky OI, Balderas RS, Plevritis SK, Sachs K, Pe'er D, Tanner SD, Nolan GP:Single-cell mass cytometry of differential immune and drug responses across a human hematopoietic continuum.Science
2011,332:687–696.
35. Behbehani GK, Bendall SC, Clutter MR, Fantl WJ, Nolan GP:Single-cell mass cytometry adapted to measurements of the cell cycle.Cytometry A2012,
81:552–566.
36. Bodenmiller B, Zunder ER, Finck R, Chen TJ, Savig ES, Bruggner RV, Simonds EF, Bendall SC, Sachs K, Krutzik PO, Nolan GP:Multiplexed mass cytometry profiling of cellular states perturbed by small-molecule regulators.
Nat Biotechnol2012,30:858–867.
37. Chen CL, Mahalingam D, Osmulski P, Jadhav RR, Wang CM, Leach RJ, Chang TC, Weitman SD, Kumar AP, Sun L, Gaczynska ME, Thompson IM, Huang TH:
Single-cell analysis of circulating tumor cells identifies cumulative expression patterns of EMT-related genes in metastatic prostate cancer.
Prostate2013,73:813–826.
39. el Amir AD, Davis KL, Tadmor MD, Simonds EF, Levine JH, Bendall SC, Shenfeld DK, Krishnaswamy S, Nolan GP, Pe'er D:viSNE enables
visualization of high dimensional single-cell data and reveals phenotypic heterogeneity of leukemia.Nat Biotechnol2013,31:545–552.
40. Fang H, Gough J:supraHex: an R/Bioconductor package for tabular omics data analysis using a supra-hexagonal map.Biochem Biophys Res Commun
2014,443:285–289.
41. Qiu P, Simonds EF, Bendall SC, Gibbs KD Jr, Bruggner RV, Linderman MD, Sachs K, Nolan GP, Plevritis SK:Extracting a cellular hierarchy from high-dimensional cytometry data with SPADE.Nat Biotechnol2011,
29:886–891.
42. Hollander M, Wolfe DA:Nonparametric Statistical Methods.2nd edition. New York: John Wiley & Sons; 1999.
43. Wong P, Iwasaki M, Somervaille TC, So CW, Cleary ML:Meis1is an essential and rate-limiting regulator of MLL leukemia stem cell potential.
Genes Dev2007,21:2762–2774.
44. Peeters P, Raynaud SD, Cools J, Wlodarska I, Grosgeorge J, Philip P, Monpoux F, Van Rompaey L, Baens M, Van den Berghe H, Marynen P:
Fusion ofTEL, the ETS-variant gene 6 (ETV6), to the receptor-associated kinaseJAK2as a result of t(9;12) in a lymphoid and t(9;15;12) in a myeloid leukemia.Blood1997,90:2535–2540.
45. Miyoshi H, Shimizu K, Kozu T, Maseki N, Kaneko Y, Ohki M:t(8;21) breakpoints on chromosome 21 in acute myeloid leukemia are clustered within a limited region of a single gene,AML1.Proc Natl Acad Sci U S A
1991,88:10431–10434.
46. Erickson P, Gao J, Chang KS, Look T, Whisenant E, Raimondi S, Lasher R, Trujillo J, Rowley J, Drabkin H:Identification of breakpoints in t(8;21) acute myelogenous leukemia and isolation of a fusion transcript,AML1/ETO, with similarity to Drosophila segmentation gene,runt.Blood1992,
80:1825–1831.
47. Kim W, Bird GH, Neff T, Guo G, Kerenyi MA, Walensky LD, Orkin SH:
Targeted disruption of the EZH2-EED complex inhibits EZH2-dependent cancer.Nat Chem Biol2013,9:643–650.
48. McCabe MT, Ott HM, Ganji G, Korenchuk S, Thompson C, Van Aller GS, Liu Y, Graves AP, Della Pietra A III, Diaz E, LaFrance LV, Mellinger M, Duquenne C, Tian X, Kruger RG, McHugh CF, Brandt M, Miller WH, Dhanak D, Verma SK, Tummino PJ, Creasy CL:EZH2 inhibition as a therapeutic strategy for lymphoma with EZH2-activating mutations.Nature2012,
492:108–112.
49. Loven J, Hoke HA, Lin CY, Lau A, Orlando DA, Vakoc CR, Bradner JE, Lee TI, Young RA:Selective inhibition of tumor oncogenes by disruption of super-enhancers.Cell2013,153:320–334.
50. Langfelder P, Horvath S:WGCNA: an R package for weighted correlation network analysis.BMC Bioinformatics2008,9:559.
51. Zhang B, Horvath S:A general framework for weighted gene co-expression network analysis.Stat Appl Genet Mol Biol2005,
4:Article17.
52. Sykes DB, Kamps MP:E2a/Pbx1 induces the rapid proliferation of stem cell factor-dependent murine pro-T cells that cause acute T-lymphoid or myeloid leukemias in mice.Mol Cell Biol2004,24:1256–1269.
53. Dardaei L, Longobardi E, Blasi F:Prep1 and Meis1 competition for Pbx1 binding regulates protein stability and tumorigenesis.Proc Natl Acad Sci U S A2014,111:E896–E905.
54. Tesson BM, Breitling R, Jansen RC:DiffCoEx: a simple and sensitive method to find differentially coexpressed gene modules.BMC Bioinformatics2010,11:497.
55. Schutte J, Moignard V, Gottgens B:Establishing the stem cell state: insights from regulatory network analysis of blood stem cell development.Wiley Interdiscip Rev Syst Biol Med2012,4:285–295. 56. Soneji S, Huang S, Loose M, Donaldson IJ, Patient R, Gottgens B, Enver T,
May G:Inference, validation, and dynamic modeling of transcription networks in multipotent hematopoietic cells.Ann N Y Acad Sci2007,
1106:30–40.
57. MATLAB Toolbox for Dimensionality Reduction.[http://homepage.tudelft. nl/19j49/Matlab_Toolbox_for_Dimensionality_Reduction.html]
58. Hinton GE, Roweis ST:Stochastic neighbor embedding.InNeural Information Processing Systems; Cambridge,MA,USA. Edited by Becker S, Thrun S, Obermayer K. The MIT Press; 2002:833–840.
59. Hothorn T, Hornik K, van de Wiel MA, Zeileis A:Implementing a class of permutation tests: the coin package.J Stat Software2008,
28:1–23.
60. Benjamini Y, Hochberg Y:Controlling the false discovery rate: a practical and powerful approach to multiple testing.J Roy Stat Soc B1995,
57:289–300.
doi:10.1186/s13059-014-0525-9
Cite this article as:Saadatpouret al.:Characterizing heterogeneity in leukemic cells using single-cell gene expression analysis.Genome Biology
201415:525.
Submit your next manuscript to BioMed Central and take full advantage of:
• Convenient online submission
• Thorough peer review
• No space constraints or color figure charges
• Immediate publication on acceptance
• Inclusion in PubMed, CAS, Scopus and Google Scholar
• Research which is freely available for redistribution
![Figure 3 Mapping cellular hierarchy using SPADE analysis. (A) The cellular hierarchy in the normal hematopoietic system is represented bythe SPADE tree (adapted from [20]), on which the leukemic and normal cells are mapped as described in the main text](https://thumb-us.123doks.com/thumbv2/123dok_us/8647762.866772/6.595.59.537.89.480/mapping-cellular-hierarchy-hierarchy-hematopoietic-represented-leukemic-described.webp)