Optimization of Cutting Parameters on Machining
Quality in Turning Operation Using
Magnetorhelogical (Mr) Fluid Filled Tool Post
Tharoon T1
1
Project Assistant, Department of Mechanical Engineering,Coimbatore Institute of Engineering and Technology, Coimbatore-641109, Tamilnadu, India.
Abstract: The objective of the paper is to improve the quality of machining and to produce by using optimization techniques such as Taguchi. The effects of cutting parameters were studied in turning process using magnetorhelogical (MR) fluid filled tool post. The surface roughness of the components is very important to increase the quality of machining. The direct and interactive effect of process factors on response within the range of examination can be studied with ease from the Taguchi analysis. Taguchi analysis is done for optimizing the process factors such as speed, feed, depth of cut and depth of cut. The trials have been as per taguchi’s L9 orthogonal array. “Smaller is best” S/N ratio typical is used to determine the means and Analysis of Variance (ANOVA) table is produced to control the numerical association of the factors. Response graphs are plotted to determine the desired level for each parameter. The feed is greatest influencing factor and its percentage of contribution is 74% on surface roughness. The current is contributed about 11% on surface roughness. The depth of cut is contributed about 14.4% on surface roughness respectively. The normal probability plot graph is obtained in the form of straight line so the errors are distributed normally.
Key words: Surface roughness, Magnetorhelogical fluid, Taguchi, Regression, ANOVA, Plots
I. INTRODUCTION
considered. Linear regression equation of cutting force has revealed that feed depth of cut and the interaction of feed and depth of cut significantly influenced the variance. In case of surface roughness the influencing factors were found to be feed and the interaction of speed and feed. As turning of mild steel using HSS is one among the major machining operations in manufacturing industry the revelation made in this research would significantly contribute to the cutting parameters optimization [10-14].
II. EXPERIMENTAL WORK
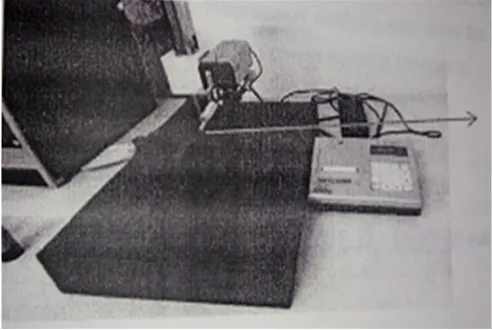
[image:3.612.188.434.315.480.2]Turning is very important machining process in which single pint cutting tool removes unwanted material from the surface of a rotating cylindrical work piece. The cutting tool is fed linearly in a direction parallel to the axis of rotation. Turning operation using magnetorhelogical (MR) fluid filled tool post is carried on a lathe that provides the power to turn the work piece at a given rotational speed and to feed to the cutting tool at specified rate and depth of cut. Therefore, three cutting parameters namely cutting speed, feed depth of cut and current need to be determined in a turning operation. The turning operations using magnetorhelogical (MR) fluid filled tool post are accomplished using a cutting tool, the high forces and temperature during machining create a harsh environment for the cutting tool. Therefore, tool life is important to evaluate cutting performance. The purpose of turning operation using magnetorhelogical (MR) fluid filled tool post is to produce low surface roughness of the parts. Surface roughness is an important factor to evaluate cutting performance. Measure the surface roughness by using surf coder SE 1200 instrument as shown in the figure 1 for a probe movement of 2.5 mm, surface roughness readings were recorded at three locations on the work piece and the average value was used for analysis.
Fig 1. Surface coder SE 1200
III. CUTTING PARAMETERS
Speed, feed, depth of cut and current are the parameters chosen for the experiment. The cutting parameters like speed, depth of cut and current were calculated based on insert chosen. Feed were chosen based on machine capabilities.
Table 1 Cutting parameters for turning
Factors Level 1 Level 2 Level 3
Speed (rpm) 360 580 800
Feed rate (mm/rev) 0.25 0.5 0.75
Depth of cut (mm) 0.3 0.6 0.
Current (A) 0 0.5 1
IV. DESIGN OF EXPERIMENTS
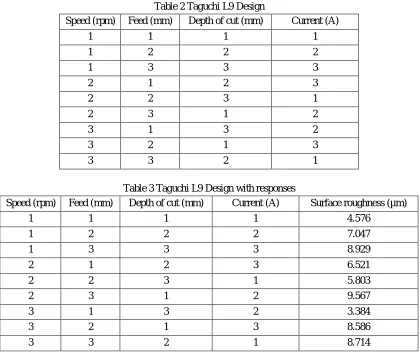
Table 2 Taguchi L9 Design
Speed (rpm) Feed (mm) Depth of cut (mm) Current (A)
1 1 1 1
1 2 2 2
1 3 3 3
2 1 2 3
2 2 3 1
2 3 1 2
3 1 3 2
3 2 1 3
3 3 2 1
[image:4.612.97.517.88.444.2]
Table 3 Taguchi L9 Design with responses
Speed (rpm) Feed (mm) Depth of cut (mm) Current (A) Surface roughness (µm)
1 1 1 1 4.576
1 2 2 2 7.047
1 3 3 3 8.929
2 1 2 3 6.521
2 2 3 1 5.803
2 3 1 2 9.567
3 1 3 2 3.384
3 2 1 3 8.586
3 3 2 1 8.714
V. RESULTS AND DISCUSSIONS A. Determination of the Regression model and Evaluation of Statistical
The Regression equation, ANOVA and graph is generated by using Minitab software. The regression equation is give the relationship among Speed, feed, depth of cut, current and surface roughness. The equation is given by,
[image:4.612.79.536.543.642.2]Surface roughness (Ra) = 2.62 + 0.022 Speed + 2.12 Feed Rate – 0.769 Depth of cut + 0.824 Current
Table 4 Regression Analysis
Predictor Coefficient SE Coefficient T P
Constant 2.617 1.1030 2.37 0.007
Speed 0.022 0.2701 0.08 0.939
Feed 2.1215 0.2701 7.85 0.001
Depth of cut -0.7688 0.2701 -2.85 0.047
Current 0.8238 0.2701 3.05 0.038
S = 0.359413 R-Sq = 98.31% R-Sq (adj) = 97.23%
B. Taguchi Analysis
[image:5.612.82.518.189.705.2]This method uses a special set of arrays called orthogonal arrays. These standard arrays instructs the way of accompanying the nominal number of experiments which could give the full information of all the factors that affect the performance parameter. The crux of the orthogonal arrays method lies in indicating the level combinations of the input design variables for each experiment. The experiments were directed and the Surface roughness values were restrained from which the following graphs were drawn by using Minitab software.
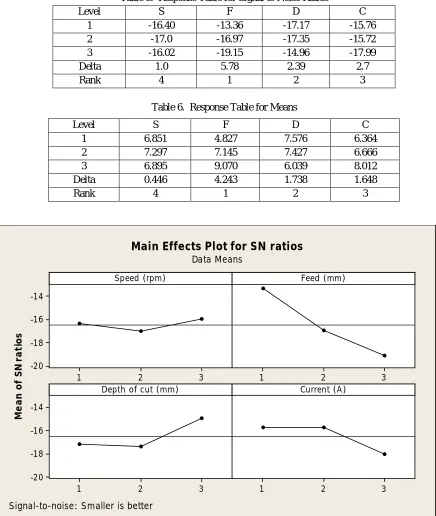
Table 5. Response Table for Signal to Noise Ratios
Level S F D C
1 -16.40 -13.36 -17.17 -15.76 2 -17.0 -16.97 -17.35 -15.72 3 -16.02 -19.15 -14.96 -17.99
Delta 1.0 5.78 2.39 2.7
Rank 4 1 2 3
Table 6. Response Table for Means
Fig 2: Signal to noise ratio graph
Level S F D C
1 6.851 4.827 7.576 6.364
2 7.297 7.145 7.427 6.666
3 6.895 9.070 6.039 8.012
Delta 0.446 4.243 1.738 1.648
Rank 4 1 2 3
3 2 1 -14 -16 -18 -20 3 2 1 3 2 1 -14 -16 -18 -20 3 2 1 Speed (rpm) M e a n o f S N r a ti o s Feed (mm)
Depth of cut (mm) Current (A)
Main Effects Plot for SN ratios
Data MeansFig 3 Mean Plot Graph
Taguchi analysis is finished as above we got signal to noise ratio graph and mean plot graph as shown in the figure 2 and 3. From which a major influencing factor is obtained such as feed rate. The second influencing factor is depth of cut, the third influencing factor is current and the fourth contribution factor is speed whose contribution is very less compared to other influencing factor.
C, Normal Probability plot Graph
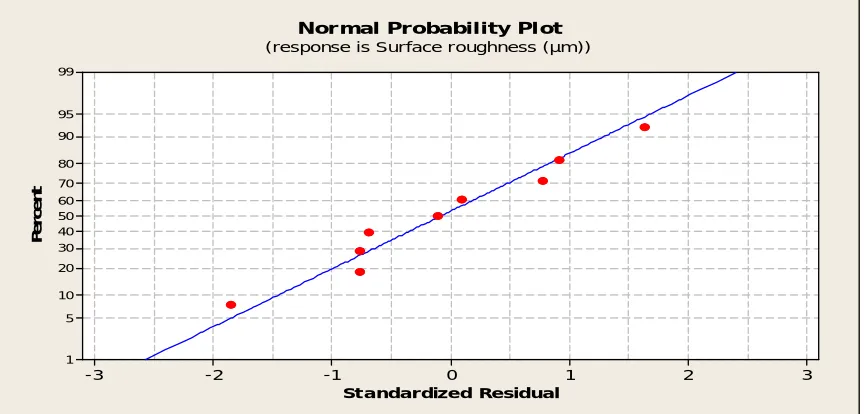
The normal probability plot graph is attained by using the regression equation and the trials values. It is a graphical exemplification for evaluating whether data set is normally disseminated or not. The graph should provide nearly in a line. So the errors are distributed normally.
Fig 4 Normal probability plot
3 2 1 0 -1 -2 -3 99 95 90 80 70 60 50 40 30 20 10 5 1 Standardized Residual P e rc e n t
Normal Probability Plot
(response is S urface roughness (µm))
3 2 1 9 8 7 6 5 3 2 1 3 2 1 9 8 7 6 5 3 2 1 Speed (rpm) M e a n o f M e a n s Feed (mm)
Depth of cut (mm) Current (A )
Main Effects Plot for Means
[image:6.612.66.498.501.708.2]D. ANOVA
Analysis of variance (Anova) is a gathering of statistical models used to investigate the differences among group means and their
accompanying procedures. ANOVA was performed by the Minitab Software which provide the operative values.
Table 7. ANOVA Table
Term DOF Seq. SS Adj. SS Adj. MS F P % of Contribution Feed 2 27.5667 27.5667 13.78 106.7 0.009 73.8 Depth of cut 2 5.3637 5.3637 2.6818 20.76 0.046 14.4 Current 2 4.1435 4.1435 2.0718 16.04 0.059 11.1 Error 2 0.2584 0.2584 0.1292 0.70
Total 8 37.3323 100
E. Confirmation Test
The L9 array are conducted which means 27 experiments are accompanied from which the percentage of error is calculated and tabulated (Table 8) at different conditions such as Speed, feed, depth of cut, current and surface roughness.
Table 8. Confirmation test results
S.No Speed Feed rate Depth of
cut Current
Experimental value
Predicted
value % of error
1. 300 0.25 0.3 0 4.122 4.002 2.9
2. 360 0.35 0.7 0.7 5.014 5.111 1.9
3. 1000 0.8 0.5 1 8.819 8.905 1.05
4. 400 0.75 0.4 0.5 8.851 8.799 0.67
VI. CONCLUSION
In this paper, Taguchi Orthogonal is used to obtain the delamination factor in turning operation using magnetorhelogical (MR) fluid filled tool post. The following conclusions are done by this experiment,
A. The response such as and surface roughness can be computed proficiently through the linear model settled in this experiment. The direct and interactive effect of process factors on response within the range of exploration can be considered with ease from the Taguchi and
B. The process parameters for completing the desired response can be obtained from the mathematical model. ANOVA table is used to determine the percentage of contribution for significant factors and interactions. The feed is greatest influencing factor and its percentage of contribution is 74% on surface roughness.
C. The current is contributed about 11% on surface roughness. The depth of cut is contributed about 14.4% on surface roughness respectively. The normal probability plot graph is obtained in the form of straight line so the errors are distributed normally.
D. In Regression analysis, the adjusted determination coefficient is very closer to the determination coefficient so evaluation of delamination factor is done by effectively and efficiently.
REFERENCES
[1] Ashour, “Magnetorheological Fluids: Materials, Characterization and Devices”. Journal of Intelligent Material Systems and Structures, 7(2), pp 123-130 (1996) [2] Janagarathinam. P, Tharoon. T, Senthilkumar. K. The Assessment of Delamination in the Drilling of EN8 Steel by using Taguchi Method. International Journal
of Engineering Research & Technology (IJERT), 5, 643-648 (2016)
[3] Tharoon T, Jeevarathinam A, Karthik V. Reduction of Sand Casting Defects by applying Taguchi analysis, SSRG International Journal of Mechanical Engineering – (ICET’17) - Special Issue, 48-52 (2017)
[4] Tharoon T, Praveen rajha M, Santhosh N, Ranjith S N, Chelliah A, Diminishing the Casting Defects by using Optimization Techniques. International Journal of Engineering Research & Technology (IJERT), 5, 136-140 (2017)
[5] Somkiat Tangjitsitcharoen. Prediction of Surface roughness on CNC Turning based on Monitoring of Cutting Force and Cutting Temperature. Advanced Materials Research Trans Tech publications, 690, 2540-2549 (2013)
[6] Han .S. Investigation of Surface Roughness during Turning Process based on Response surface Methodology. Advanced Materials Research Trans Tech publications, 13(5), 243-248 (2014)
[7] Kusuma. N. Investigation on the influence of cutting parameters on Machine tool Vibration & Surface finish using MEMS Accelerometer in high precision CNC milling machine. 5th International & 26th All India Manufacturing Technology, Design and Research Conference (AIMTDR) IIT Guwahati (2014)
[9] Basil. M Eldhose. Optimization of the cutting parameters of SS304 for CNC turning operation. International Journal of Innovative Research in Advanced Engineering (IJIRAE). 1, 49-53 (2014)
[10] Yang. W. H, Design of optimization cutting parameters for turning operations based on Taguchi method. Journal of Materials Processing Technology, 84, 122-129 (2011)
[11] Ersan Aslan. Design of optimization of cutting parameters when turning hardened AISI 4140 steel (63 HRC) with Al2O3 + TiCN mixed ceramic tool. Materials and Design, 34, 132-139 (2006)
[12] Nalbant. N. Application of Taguchi method in the optimization of cutting parameters for surface roughness in turning, Materials and Design, 34, 162-169 (2006) [13] Erginic. B. The use of the Taguchi approach to determine the influence of injection molding parameters on the properties of green parts. Journal of achievement
in Materials and Manufacturing Engineering 15, 55-67 (2006)