Technology (IJRASET)
©IJRASET: All Rights are Reserved
719
Optimization of Process Parameters of Green Sand
Casting in Small Scale Foundry
Hiren Khalasi1, Milan Patel2, Deep Parekh3, Naimesh Shethiya4
1
Student, M.E. , 2,3Asst. Prof., Department of Production Engineering, S.N.P.I.T. & R.C., Bardoli, Gujarat, India.
4
Casting Engineer, Susha Founders and Engineers, Surat, Gujarat, India.
Abstract--In this research work present the design of experiment based approach which is adopted to obtain an optimal setting of moisture content, grain particle size and temperature of pouring metal related parameters of green sand casting in SUSHA FOUNDERS AND ENGINEERS at G.I.D.C PANDESARA, SURAT. The casting parameters identified for green sand casting process are moisture content, green strength, mould hardness, permeability, sand particle size, pouring temperature ramming pressure, cooling time. For defect analysis, the possible causes are grouped into design, material and process parameters. The effect of suspected cause parameters on casting quality is ascertained through simulation. Based on the results and their interpretation, the optimal values of the parameters are determined to eliminate the defects.
I. INTRODUCTION
A. Sand Casting
Casting is one of the oldest manufacturing process dates back to 4000 B.C. when copper arrowheads where made. Casting produced by foundry as per customers’ specifications, their quality level otherwise the casting is term as defective. If casting is defective then it is rejected. Rejected parts contributed to the wastage and loss of value to the foundry. For improve the cast metal yield, we need to optimize the gating system design, optimize mould filling, avoid shrinkage defects, voids, hot tears etc. casting simulation tools to very helpful to achieve above objectives. With advent of modern computing facilities, application of commercial software’s, packages such as casting simulation tools, enable the foundry industries to accomplish successful casting design.
B. Need and Importance
Sand casting is the casting process that has the longest history. Sand casting still accounts for the largest tonnage of production of shaped castings. This is due to the fact that sand casting is economical and possesses the flexibility to produce castings of any material, and the weight of castings can range from tens of grams to hundreds of tons. Advanced high technology sand casting process, with improved sand quality and mould rigidity, enables this method to produce high precision cast products with better as cast surface finish that reduces the cost of after-cast touch up. This will enhance the capability of sand casting to produce ‘near net shape’ products and improve its competitiveness.
C. Basic Steps of Casting
The basics steps are as following:
Melting the metal.
Pouring it in to mould cavity which previously made as desired shape of component.
Allow the molten metal to cooling and solidify in mould.
Remove the solidified parts from mould, cleaning it and further go for secondary treatment if it needed.
Technology (IJRASET)
©IJRASET: All Rights are Reserved
720
Figure: 1.1 Sand Casting
D. Classification of Casting Process
Classification of casting process according to the moulds as given belows:
1) Conventional Sand Moulding Processes: Dry sand moulding Green sand moulding
Flask less moulding
2) Chemical Shell Moulding Processes: Shell moulding Sodium silicate moulding
No-bake moulding
3) Permanent Moulding Processes: Gravity Die Casting High And Low Die Casting
4) Special Casting Processes: Ceramic Shell Moulding Centrifugal Casting
Lost Wax
Evaporative Pattern Casting Vacuum Sealed Moulding
E. Green Sand Casting Procedure
Green sand casting procedure as given below:
First step making mould is placed in pattern on moulding the board Then drag is placed on the board
Sand is sprinkle over the board and non sticky layer is provided on pattern
By fingers, moulding sand is provided over the pattern and the drag is completely filled Then, ramming must be done properly
After the ramming, excess sand is removed by straight rod
Then , vent holes are made by vent rod to the full depth of fask for removed of gases during pouring and solidification process The finishing drag flask is turn over the board and then pattern removed
Technology (IJRASET)
©IJRASET: All Rights are Reserved
721
A sprue pin is located at required distanced from the pattern for making the passage, if riser pin required , it is located at required distanced.
the filling, rammimg and venting of cope same as drag
First sprue and riser pin removed and pour basin is scooped at top for pouring the molten metal
Then pattern is removed from drag and cope, sand in form of paste is applied all over the cavity and pattern Finally mould is assemble and ready for pouring
F. Advantages of Green Sand Casting
Flasks are ready for reuse in minimum time
Less distortion compare with dry sand casting because of no baking needed Dimensions accuracy is good
Least expensive
G. Disadvantages of Green Sand Casting
More intricate casting cannot produced
The dimensions accuracy is decrease with increase the weight of casting Some casting develops defects if moulds contain moisture
Sand control is difficult to compare with dry sand casting.
II. LITERATURE REVIEW
UdayA.Dabade et al[1]combination of design of experiment and casting simulation technique to analysis the sand and methodology defects in green sand casting. In first session, using Taguchi based orthogonal array use to purposed of experiment and analysis of variance (ANOVA) indicates in selected parameter and percentage of rejection. In second session shrinkage porosity analysis by using simulation technique using new gating system designed. Result indicates new gating system and feeder reduction in porosity about 15% and yield improvement 5%.
Figure: 2.1 a) Shrinkage porosity b) Shrinkage porosity with new gating design.
Lakshman singaram[2] for improving the process performance, yield and productivity, the Taguchi method is most powerful technique. Green sand casting process involved many parameters which affected the quality of final casting. Using Taguchi method leads to improved process parameter performance by optimization of green sand casting, also reduction in process variability and casting defects. Also ANN (Artificial neural network) model indicates the relation between process performance and quality characteristic.
Technology (IJRASET)
©IJRASET: All Rights are Reserved
722
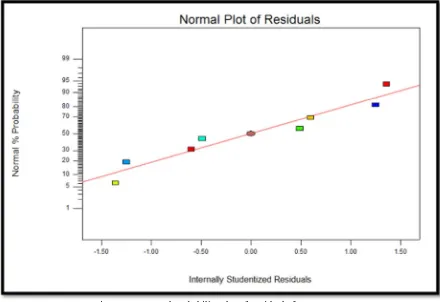
[image:5.612.83.523.101.403.2]content and pouring temperature are non-significant parameter.
Figure: 2.2 Normal Probability plot of Residuals for Percentage.
Rasik a. Upadhya et al[4] to optimized sand casting process parameter of the casting manufactured iron foundry by maximized the s/n ratio (signal to noise ratio). Also minimized the noise factors by Taguchi Method. Taken process parameters are moisture, sand particle size, green compression strength, mould hardness, permeability, pouting temperature, pouring time and pressure test. Result show the process parameters are affected on casting defects in iron foundry. Improvement in reduction in casting defects is to be 37.66 %.
Table 2.1 Optimum Condition and Performance.
FACTORS LEVEL
DESCRIPTION LEVEL CONTRIBUTION
1 Moisture % 3.5 1 0.987
2 GCS g/cm^2 900 1 1.574
3 Permeability 185 2 0.508
4 Pouring Temperature 1420 3 0.856
Total contribution from all factors current grand average of performance expected result at optimum condition improvement expected
3.924 -15.544 -11.619 37.66%
[image:5.612.83.528.519.709.2]Technology (IJRASET)
©IJRASET: All Rights are Reserved
723
material and doing experiment work and seen the defect of shrinkage porosity and when solidification completed , the last region of solidify hot spot are there. So using methoding and simulation technique, feeding aids help to us to gating the hot spot completely shifted in feeder. Simulation technique help the in improvement in yield and quality of casting componenet.
Figure: 2.3 Typical Solidification Process
Figure: 2.4 Casting Solidification Simulations
Figure: 2.5 Progressive Convergences of Hotspots Indicates Last Solidify Region.
III. PROBLEM DEFINITION AND REASERCH METHODOLOGY
A. Data Collection and Analysis
Primary data includes the rejection rates of casting for the past few years and its major problem and causes which are obtained from rejection report of foundry. Secondary data are obtained from journals, literatures and websites.
B. Historical Data of Foundry
Technology (IJRASET)
©IJRASET: All Rights are Reserved
724
TABLE: 3.1 DEFECTIVE FACTOR CHECK SHEET OF HOUSING PRODUCT
SR NO. REJECTION DEFECT REJECTED
QUANTITY
1 Mis-run 12
2 Inclusion 17
3 Distortion 10
4 Shrinkage porosity 39
5 Other defects 9
Total quantity: 580 annually
Rejection parts: 87
Percentage (%) rejection: 15%
IV. EXPERIMENTAL WORK
Experiments were performed in a medium scale ferrous foundry producing ductile iron cast components. The proposed method of casting defects analysis involves two techniques, therefore according their requirements; different castings with different defects were identified by rejection analysis.
A. DoE Method for Casting Defects Analysis
[image:7.612.105.508.385.503.2]Process parameters of green sand casting that influences the identified defects in casting pipe turbocharger with their levels are shown in table.
Table 4.1 Factors And Their Levels.
[image:7.612.103.511.577.720.2]Out of four selected process parameters, one parameter is at two levels and other three are at three different levels.therfore using full factorial method for ptimization. Each experiment was performed thrice and average % of rejection in each experiment was considered as the response variable.
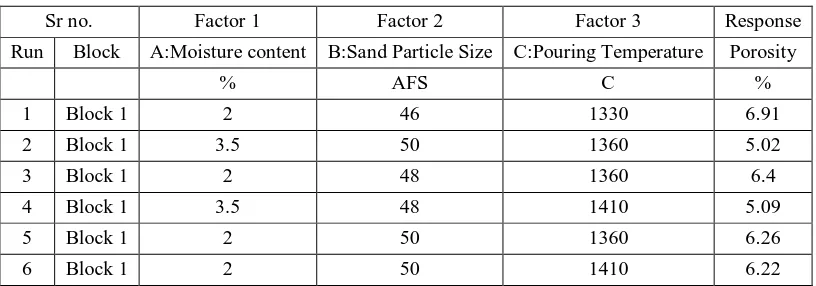
Table 4.2: Data obtained from measurement.
Sr no. Factor 1 Factor 2 Factor 3 Response
Run Block A:Moisture content B:Sand Particle Size C:Pouring Temperature Porosity
% AFS C %
1 Block 1 2 46 1330 6.91
2 Block 1 3.5 50 1360 5.02
3 Block 1 2 48 1360 6.4
4 Block 1 3.5 48 1410 5.09
5 Block 1 2 50 1360 6.26
6 Block 1 2 50 1410 6.22
FACTORES
DESIGNATION FACTORS LEVEL 1 LEVEL 2 LEVEL 3
A Moisture Content
(%) 2 3.5 5
B Sand Particle Size
(AFS GFN) 46 48 50
C Pouring Temperature
Technology (IJRASET)
©IJRASET: All Rights are Reserved
725
7 Block 1 2 48 1410 6.39
8 Block 1 3.5 46 1330 5.21
9 Block 1 5 46 1330 4.6
10 Block 1 5 50 1330 4.09
11 Block 1 5 48 1360 4.2
12 Block 1 5 50 1410 4.08
13 Block 1 5 46 1360 4.59
14 Block 1 3.5 48 1360 5.1
15 Block 1 2 46 1410 6.89
16 Block 1 2 48 1330 6.41
17 Block 1 5 46 1410 4.55
18 Block 1 5 48 1330 4.22
19 Block 1 2 50 1330 6.29
20 Block 1 5 48 1410 4.21
21 Block 1 2 46 1360 6.9
22 Block 1 3.5 46 1360 5.21
23 Block 1 3.5 48 1330 5.12
24 Block 1 5 50 1360 4.08
25 Block 1 3.5 46 1410 5.2
26 Block 1 3.5 50 1410 5.02
27 Block 1 3.5 50 1330 5.03
B. Analysis of Experimental Results
Analysis of experimental results was performed using Minitab 16 software and ANOVA and AOM plots obtained are given in Table and Figure 3 respectively. ANOVA in Table indicates that moisture content, grain particle size and pouring temparature parameters significantly influence the % rejection at 95% confidence level.
Source DOF Sum of square
(SS)
Mean of
square (MS) F P
A:Moisture
content 2 22.8517 11.4258 1162.56 0.000
B:Sand
Particle Size 2 0.9404 0.4702 47.84 0.000
C:Pouring
Temperature 2 0.0029 0.0015 0.15 0.862
Error 20 0.1966 0.0098
Total 26 23.9916
Technology (IJRASET)
©IJRASET: All Rights are Reserved
726
5 3.5 2 6.5 6.0 5.5 5.0 4.5 50 48 46 1410 1360 1330 6.5 6.0 5.5 5.0 4.5 A:Moisture content M e a n
B:Sand Part icle Size
C:Pouring Temperat ure
[image:9.612.136.507.80.333.2]Main Effects Plot for Porosity Data Means
Figure 4.1: Main effects plot for porosity.
Figure 7.1 clearly suggests a dominant influence, in a quantitative sense, pouring temperature is Constance and, moisture content and sand particle size are more sensitive.
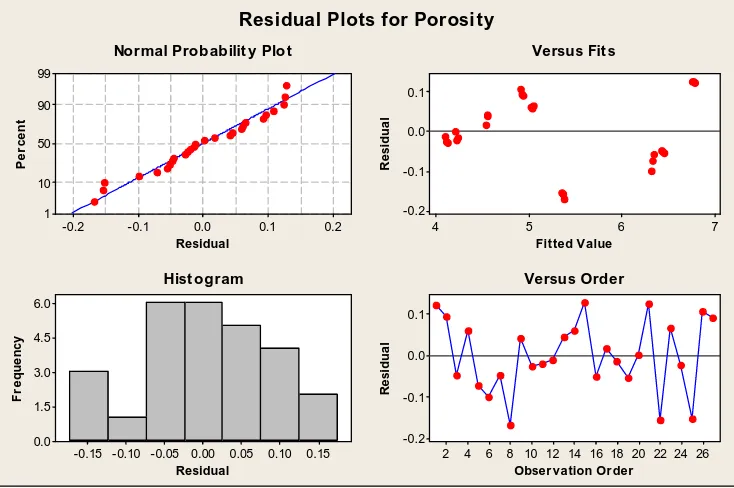
0.2 0.1 0.0 -0.1 -0.2 99 90 50 10 1 Residual P e r c e n t 7 6 5 4 0.1 0.0 -0.1 -0.2 Fitted Value R e s id u a l 0.15 0.10 0.05 0.00 -0.05 -0.10 -0.15 6.0 4.5 3.0 1.5 0.0 Residual F r e q u e n c y 26 24 22 20 18 16 14 12 10 8 6 4 2 0.1 0.0 -0.1 -0.2 Observation Order R e s id u a l
Normal Probability Plot Versus Fits
Histogram Versus Order
[image:9.612.137.504.374.618.2]Residual Plots for Porosity
Figure 4.2 Residual plots for porosity
Technology (IJRASET)
©IJRASET: All Rights are Reserved
727
assumption of constant variance. The plot should be a random scatter. Fig4.2, revealed that they have no obvious pattern and unusual structure. This implies that there is no reason to suspect any violation of the independence or constant variance assumption.
4.2 Optimization results.
The result of ANOVA represented in response diagrams shown in Figure 7.1 suggest that the optimal combination of process parameters, which gives the optimum value of the Moisture content (A) A2, sand particle size (B) B2, pouring temperature(C) C2.
III. CONCLUSION
In this paper, a study has been carried out to investigate the effect of sand casting parameters on casting defects during casting of FG400. An attempt has also been made to optimize the casting parameters to obtain minimum defects using response surface methodology. The experimental study has led to the following conclusions.
The full factorial method of ANOVA technique is an effective tool for investigating the influence of various machining parameters on surface roughness.
The results clearly illustrate that defects decreased with increasing the grain particle size.
The casting defects is significantly minimized (5.1%) when the moisture content 3.5 %, grain particle size 48 AFS GNF and pouring temperature at 1360 degree centigrade
REFERENCES
[1] Uday A. Dabade, Rahul C. Bhedasgaonkar, “Casting defects analysis using design of experiment and computer aided simulation technique”, Forty-sixth CIRP Conference on Manufacturing System 2013.
[2] Lakshman shingram,“ improve quality of sand casting using TAGUCHI method and ANN method” International Journal On Design And Manufacturing System, Vol.4, No.1, January 2010.
[3] Manu khare, “optimization of sand casting parameters using factorial design” International Journal Of Scientific Research, Vol.3, Issue:1, January 2014., ISSN NO. 2277-8179.
[4] Rashik Upadhya, “optimization of sand casting process parameters using taguchi method in foundry” International Journal of Engineering Research & Technology (IJERT), ISSN No. 2278-0181., Vol.1, September-2012.