International Journal of Emerging Technology and Advanced Engineering
Website: www.ijetae.com (ISSN 2250-2459, ISO 9001:2008 Certified Journal, Volume 8, Issue 12, December 2018)
115
A Study on Performance Improvement of Low Pressure
Injection Type Ejector Using CFD Simulation
Byung-Hyun Shon
1, Jae-Hong Park
21
Department of Environmental Engineering, Hanseo University, Seosan, South Korea
2Keumkang C.N.T Co., Ltd, Seoul, South Korea
Abstract - Ejector is a kind of pump that is a mechanical device that sucks in the second fluid and transfers it by using the pressure energy of high pressure fluid. In this paper, we investigated the effect of nozzle shape on the performance of ejector using CFD analysis based on finite volume method. The optimal conditions for the best sucking of the suction fluid influencing the performance of ejector were investigated by varying the nozzle diameter in the mixing chamber, the nozzle neck length, and the distance from the nozzle tip to the diffuser inlet where the fluid exits to the outside. As a result of the study, the performance of the ejector was found to be affected by the diameter and shape of the nozzle. As the diameter of the nozzle inside the mixing chamber decreases, the mixing ratio increases and the mixing ratio decreases as the nozzle diameter increases. On the other hand, the influence of the nozzle neck length, the nozzle tip, and the distance to the diffuser inlet was found to be insignificant. As the final shape of the ejector was increased, the target flow rate increased proportionally and no backflow phenomenon was found. Also, as the diameter increases, the required pressure also decreases proportionally, and it is considered that the performance as ejector for low pressure transfer can be satisfied.
Keywords—gas-liquid ejector, nozzle, CFD, diffuser, low pressure
I. INTRODUCTION
In general, an ejector is a mechanical device that sucks and transports a secondary fluid (suction fluid) using the pressure energy of a high-pressure primary fluid, and is widely applied to many industrial fields today [1]. The ejector is composed of a nozzle, a mixing chamber, and a diffuser. Ejector is advantageous in that it does not require a separate drive unit and has a low installation cost. Also, since there is no mechanical movement part, it can be used semi-permanently with relatively little trouble. The ejector is divided into steam-vapor, liquid-liquid, liquid-gas, and liquid-vapor ejectors along with the driving fluid and the suction fluid. Steam-steam ejectors are mainly used for mixing, absorption and dehydration in various industrial fields.
Liquid-gas ejectors are used in places requiring high vacuum such as corrosive gas transfer, poison gas transfer, and removal of radioactive gas, and are also used for sterilization treatment (chlorination and ozone treatment) through chemical treatment.
Up until now, there have been many studies on the flow characteristics and performance improvement of the ejector. Fluegel [2] proposed a basic analytical direction using the Bernoulli equation for liquid-liquid ejectors and vapor-steam ejectors. Sun and Eames [3] have discussed the theory of the mixing of the suction fluid and the driving fluid in the steam-vapor ejector, and Witte [4] theorized the overall design of the liquid-gas ejector.
In this study, to improve the performance of gas-liquid ejector, it is an overall analysis of the gas-liquid ejector flow characteristics through CFD analysis based on the finite volume method. In addition, the shape of the nozzle, which can greatly affect the performance of the ejector, is changed to provide the shape in which the suction fluid is best sucked. The purpose of this study is to propose a method to improve the performance of existing gas-liquid ejector by measuring the nozzle diameter and shape, nozzle neck length, nozzle tip, and diffuser inlet distance in the mixing chamber and measuring the suction amount of suction fluid.
II. NUMERICAL ANALYSIS AND EXPERIMENT
A. Basic Equation
When the flow of fluid is assumed to be steady state and incompressible flow, general transport equation for physical quantity can be expressed as shown in equation (1) [5].
div(VΦi - ΓΦi gradΦi) = SΦi (1)
Where, V is velocity vector and ΓΦi is diffusion
coefficient.
SΦi represents all source terms including unsteady state
International Journal of Emerging Technology and Advanced Engineering
Website: www.ijetae.com (ISSN 2250-2459, ISO 9001:2008 Certified Journal, Volume 8, Issue 12, December 2018)
116
-ρβgθ = -ρβg(T - T0) (2)
When equation (2) is added to equation (1), following equation (3) is obtained.
div(VΦi-ΓΦi gradΦi) = SΦi+Sbuoyancy (3)
B. Turbulence Model
The flow of turbulence is very irregular and shows abnormal three-dimensional behavior, therefore turbulence model is introduced. In the turbulence model, turbulence movement is largely expressed in two properties: First, velocity scale to represent intensity of turbulence and second, length scale to represent size of turbulence. Among turbulence models, the k-ε model proposed by Launder and Spalding in 1974 [6], which is a modification of Navier-Stokes equation (4), is best model to express turbulence. Standard k-ε turbulence model expresses turbulence viscosity in turbulence kinetic energy and dissipation rate of turbulence.
𝜇𝑡 =𝐶𝜇𝜌𝑘2
𝜖 (4)
Equations for turbulence kinetic energy (k) are as follows.
tk
k k k k
k
u k P
x x x
(5)
Equation for dissipation rate of turbulence is as shown in equation (6) where Pis turbulence generation term as in equation (7).
1 2 2t k
k k k k
u C P C
x x x k k
(6)
' ' i i k i
i k t
k k i k
u u u u
P u u
x x x x
(7)
The turbulence model can be used only in the complete turbulence region, and the wall function is used near the wall. The model constants used in this turbulence model are shown in Equation (8).
1 1.44, 2 1.92, 0.09, k 1.3
C C C
(8)
C. Condition for Numerical Analysis
A commercial software FLUENT was used and the turbulence equation is discretized by finite volume method.
All numerical analysis was performed using upwind differencing scheme. In which, artificial diffusion, that is, numerical diffusion was introduced for the convection term, which provides a stable solution. Then, Semi-Implicit Method Pressure-Linked Equations algorithm combining continuity equation and momentum equation was used to find pressure field [5, 7]. Also, under relaxation method was used to improve the convergence. As the basic equation required for numerical analysis is non-linear, convergence of solution by repetition is necessary. During the repetitive calculations, residual (R) was checked to evaluate the convergence of dependent variables, and when the residual reached below 10-3, it was assumed to be converged [5].
max|φn+1 - φn| ≤ 10-3 (9)
D. Analytical Model and Boundary Conditions
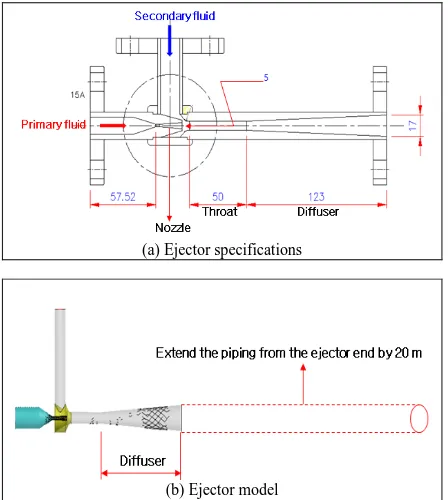
An ejector is driven by exchanging the momentum of the primary fluid with the higher energy and the secondary fluid with the lower energy state [1]. When the high-pressure primary fluid flows into the mixing chamber through the nozzle, the pressure energy is converted into velocity energy, and the driving pressure expands to the pressure inside the ejector mixing chamber to form a high-speed jet [1]. As the jet expands, a negative pressure is generated and this negative pressure is kept below the pressure of the secondary fluid, so that the secondary fluid can be sucked. When the high-pressure primary fluid is ejected at the nozzle inlet at a high speed, the secondary fluid is mixed with the primary fluid in the mixing chamber and then injected into the throat, and the energy is exchanged. Since the flow in the throat is high, it is decelerated in the diffuser to recover the pressure energy, and the mixed fluid is discharged.
The purpose of this research ejector is to smoothly transfer liquid chemical (30 L/min) from the chemical tank to the external piping using air as the primary fluid (pressure 4,000 mmH2O, flow rate 0.03018 m
3
/min). For this purpose, the internal flow and pressure distribution of the ejector were investigated and modeling was conducted to examine the design adequacy. The basic design of this study is shown in Fig. 1, the inner diameter of the nozzle is 5 mm, the throat is 50 mm, and the length of the diffuser is 123 mm.
International Journal of Emerging Technology and Advanced Engineering
Website: www.ijetae.com (ISSN 2250-2459, ISO 9001:2008 Certified Journal, Volume 8, Issue 12, December 2018)
117
The CFD model grid was composed of 110,000 nodes using Tetrahderal & prizm [1]. By using the 'Relevance' function, the grids were applied more densely, and the 'Curvature' function was used to concentrate grids in the vicinity of the nozzle outlet and in the suction fluid tank, making the grids more dense in areas with a high surface curvature. On the other hand, 'Inflation' function was used to consider boundary layer flow.
(a) Ejector specifications
[image:3.612.337.548.170.511.2](b) Ejector model
Fig. 1. Liquid-gas ejector specifications and model.
III. RESULTS AND DISCUSSIONS
A. Pressure and velocity distribution for the basic design
Fig.2 shows the pressure distribution simulation results for the basic design. As shown in the figure, the pressure generated when the airflow passes through the ejector and passes through the 20 m duct is about 2,000 mmH2O. It can
be confirmed that the differential pressure is generated in the range of 4,000 mmH2O, which is the margin pressure
on the present system.
However, most positive pressure is applied to the chemical supply line, which may lead to backflow of chemicals from the chemical tank.
(a) Pressure distribution from outlet of the nozzle to end of the extend pipe
(b) Pressure distribution from primary fluid to chemical tank
Fig. 2. Pressure distribution of the basic design.
[image:3.612.57.281.232.482.2]International Journal of Emerging Technology and Advanced Engineering
Website: www.ijetae.com (ISSN 2250-2459, ISO 9001:2008 Certified Journal, Volume 8, Issue 12, December 2018)
118
(a) Pressure distribution from primary fluid to chemical tank [image:4.612.64.277.130.415.2](b) Velocity distribution around nozzle and mixing chamber
Fig. 3. Velocity distribution of the basic design.
B. Simulation of 5 types of nozzles to prevent backflow
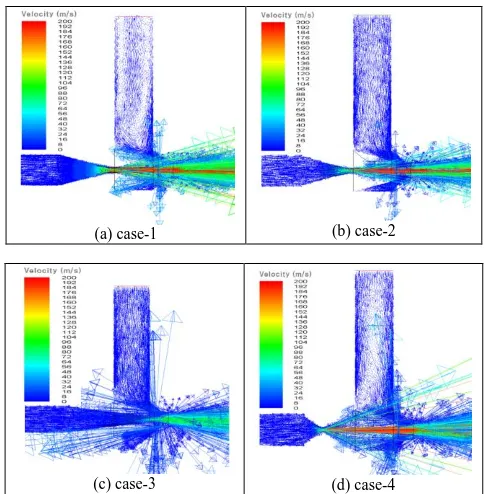
[image:4.612.327.561.132.316.2]As can be seen from the pressure and airflow distributions in the basic design of Fig. 1 and Fig. 2, the initial design is not suitable due to backflow of suction fluid due to boundary layer separation. The flow phenomenon was compared by dividing the ejector nozzle section into five different shapes. Other experimental conditions were the same as those of the basic design. As can be seen in Fig. 4, the diameter of the nozzle was set to 3 mm only for case-1, and the rest was set to 2 mm. In addition, the shape of the nozzle was made by combining the cone and the tube. The cone-to-tube ratio for each nozzle was 2:2 for case-1 and case-2, 4:0 for case-3, 0.5:3.5 for case-4, and 3:1 for case-5.
Fig. 4. 5 types of nozzles.
Fig. 5 shows the velocity distribution for five different types of nozzles. In case-1, case-4, and case-5, the backflow was still present as a chemical supply line, and the pressure distribution was analyzed for 2 and case-3 only.
(a) case-1 (b) case-2
[image:4.612.322.566.381.628.2]International Journal of Emerging Technology and Advanced Engineering
Website: www.ijetae.com (ISSN 2250-2459, ISO 9001:2008 Certified Journal, Volume 8, Issue 12, December 2018)
[image:5.612.320.562.110.262.2]119
(e) case-5Fig. 5. Velocity distribution of 5 types of nozzles
Fig. 6 shows the pressure distributions of case-2 and case-3. In case-2, the pressure was 4.562 mmH2O from the
ejector inlet to the outlet of the rear duct (20 m).This suggests that the required flow rate may not reach 0.0318 m3/min when 4,000 mmH2O blower is used. In the case-3,
the pressure from the ejector inlet to the exit of the rear duct (20 m mounting duct) was 6,839 mmH2O. This is
because it is difficult to control the flow rate because the desired 4,000 mmH2O blower cannot be used due to
excessive differential pressure. Therefore, it is necessary to redesign the structure to reduce the differential pressure by referring to the shapes of case-2 and case-3.
[image:5.612.46.293.110.254.2](a) case-1 (b) case-2
Fig. 6. Pressure distribution
C. Verification of final design
Based on the results of the analysis for two times, the flow and pressure distribution for the redesigned ejector for the prevention of the backflow phenomenon and the minimization of the differential pressure were examined. The specifications are shown in Fig. 7.
Fig. 7. Ejector specifications of the final design.
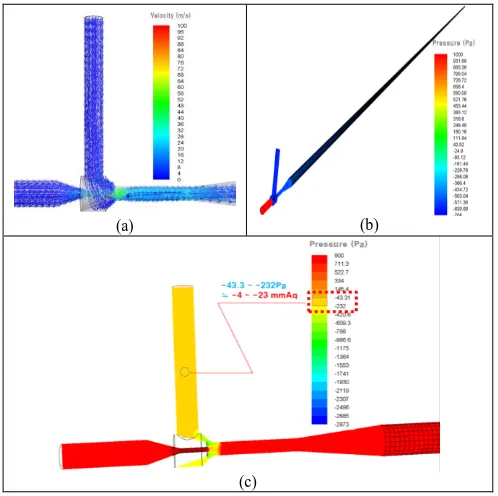
Fig. 8 shows the velocity and pressure distributions of the final design. As shown in Fig. 9(a), there is no reverse flow to the chemical supply line, and as shown in Fig. 9(b), the pressure generated by the airflow passing through the ejector and passing through the 20 m duct was about 994 mmH2O. As can be seen in Fig. 9(c), it was confirmed that
there was no reverse flow due to negative pressure in the chemical supply line. As a result, if the ejector is manufactured in the final design, the differential pressure can be minimized without backflow, and the target fluid can be smoothly transferred.
(a) (b)
[image:5.612.320.569.410.658.2](c)
[image:5.612.44.294.412.545.2]International Journal of Emerging Technology and Advanced Engineering
Website: www.ijetae.com (ISSN 2250-2459, ISO 9001:2008 Certified Journal, Volume 8, Issue 12, December 2018)
120
In the final design of the ejector, it was confirmed whether the backflow of the secondary fluid and the target flow were smoothly transferred when the specification was increased (changing the nozzle diameter).
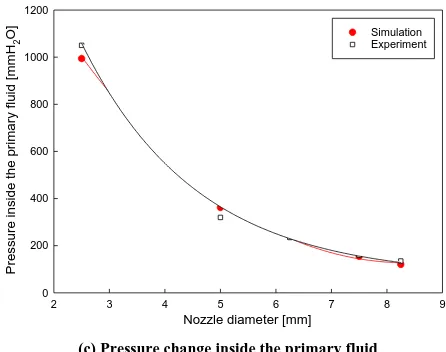
In order to verify that the final design was actually operated well, six different ejectors were prepared and several experiments were performed. Fig. 9 compares the experimental results with the simulation results for the case where the ejector nozzles are enlarged. As can be seen in the Fig. 9(a)-(c), the simulation results and the experimental results agree very well. In conclusion, it can be seen that the target flow rate increases proportionally with the increase of the size of the final shape of the ejector. Also, as the diameter increases, the required pressure also decreases proportionally, and it is considered that the performance as ejector for low pressure transfer can be satisfied.
Nozzle diameter [mm]
2 3 4 5 6 7 8 9
Flow r at e [m 3/m in] 0.03 0.06 0.09 0.12 Simulation Experiment
(a) Flow rate change according to nozzle diameter
Nozzle diameter [mm]
2 3 4 5 6 7 8 9
P ress ure inside the chem ic al tank [ pa] -250 -200 -150 -100 -50 0 Simulation Experiment
(b) Pressure change in the chemical tank.
Nozzle diameter [mm]
2 3 4 5 6 7 8 9
P ress ure inside the pri m ary f luid [m m H2 O] 0 200 400 600 800 1000 1200 Simulation Experiment
[image:6.612.330.553.136.312.2](c) Pressure change inside the primary fluid
Fig. 9. Velocity and pressure change according to nozzle diameter.
VI. CONCLUSION
CFD simulations were performed while varying the shape parameters of the nozzle, which could affect liquid - gas ejector performance. The conclusion is as follows.
1. The performance of the ejector was significantly affected by the size and shape of the nozzle. The optimal nozzle diameter for obtaining the target flow rate of the secondary fluid to be obtained in this study was 2.5 mm.
2. The influence of the nozzle neck length, the nozzle tip and the distance to the diffuser inlet was found to be insignificant.
3. As the final shape of the ejector was increased, the target flow rate increased proportionally and no backflow phenomenon was found. Also, as the diameter increases, the required pressure also decreases proportionally
4. The diameter of the nozzle that can be used to obtain the desired flow rate of the ejector proposed in this study without backflow of the secondary fluid is 2.5-8.25 mm.
Acknowledgement
International Journal of Emerging Technology and Advanced Engineering
Website: www.ijetae.com (ISSN 2250-2459, ISO 9001:2008 Certified Journal, Volume 8, Issue 12, December 2018)
121
Nomenclatures
V: velocity vector ΓΦi : diffusion coefficient
SΦi : All source terms including unsteady state terms and
pressure gradient(not included the buoyancy terms) k : Turbulence kinetic energy
ε : dissipation rate
P : turbulence generating terms R : residual
Gb : buoyancy terms
μt : turbulence viscosity
C1, C2, σk : experimental constants
ρ : density
Φi : a dependent variables
g : acceleration of gravity
u, v, w : velocity components at x, y, z direction
REFERENCES
[1] Won-Hyeop Sin, Min-Woo Kim, and Young-Chul Park, Study on Performance Evaluation of Mixing Section of Ejector Using CFD Simulation, Journal of the Korea Academic-Industrial cooperation Society, Vol. 15, No. 5, pp. 2610-2616, 2014.
[2] Fluegel, G., Berechnung von Stahlapparaten, VDI Forschungsheft 395 Ausgabe B Band 10, 1939.
[3] Sun, D. W. AND Eames, I. E., Recent Developments in the Design Theories and Applications of Ejectors-a review, Journal of the Institute Energy, Vol. 68, pp. 665-676, June, 1995.
[4] Witte, J. H., Efficiency and Design of Liquid \Gas Ejector, British Chemical Engineering, Vol. 10, No. 9, pp. 602-607, 1995.
[5] Hyun-Guk Myung, Computational Fluid Dynamics for Engineering, Han Mi publishing company, pp. 124-138, 1997.
[6] Patankar SV, Numerical Heat Transfer and Fluid Flow, Hemisphere Publishing Corp., 1980.