International Journal of Emerging Technology and Advanced Engineering
Website: www.ijetae.com (ISSN 2250-2459, ISO 9001:2008 Certified Journal, Volume 7, Issue 11, November 2017)
78
Microwave Sintered Pr
3+
and Y
3+
Co-Doped Ceria Ceramics as
Solid Electrolytes for IT-SOFCs
Ch. Madhusudan
1, Kasarapu Venkataramana
2, C. Vishnuvardhan Reddy
31,2,3Department of Physics, Osmania University, Hyderabad-500007, India
Abstract— Nanopowdered Y and Pr co-doped solid solutions Ce0.8Y0.2-xPrxO2–δ [CYP0 (x=0.00), CYP5 (x=0.05),
CYP10 (x=0.10)] were synthesized by sol-gel auto-combustion method. Dense pellets were prepared by sintering at 13000C by using microwave radiation. The relative densities of all the samples were noticed above 95%. The morphological structure and electrical properties were investigated for
application as electrolyte materials for intermediate
temperature solid oxide fuel cells. XRD measurements ascertained the sample formation with a single-phase cubic fluorite structure. SEM micrographs showed spherical faceted near- uniform grains with distinct grain boundaries and of negligible porosity. Total ionic conductivity values and activation energies were measured depending on the Pr content. These measurements gave rise to the firm conclusion that, the co-doped ceria has a potential to be utilized as the electrolyte for intermediate temperature solid oxide fuel cell applications.
Keywords— co-doped ceria, X-Ray Diffraction, Scanning Electron Microscopy, Microwave Sintering, Electrochemical Impedance Spectroscopy, Total Ionic Conductivity.
I. INTRODUCTION
Rising energy costs and the growing demand continue to urge the people advance in new technology designed to cater to the needs of energy efficiency across the globe. One such technology is Fuel cell. In the existing varied fuel cell technologies, Solid Oxide Fuel Cells (SOFC) has the ability to convert the chemical energy into electrical energy with certain attractive features including high conversion efficiency, fuel flexibility and portability. They have significantly lower emissions of COx, NOX and SOx compared to conventional power generation devices [1] [2].
State-of-the-art SOFC electrolyte Yttria Stabilized Zirconia (YSZ), requires higher operating temperatures (>1000°C) to exhibit high ionic conductivity. The high operating temperature is the major limiting factor to using SOFCs and their commercialization. Solid electrolyte, as the major component in SOFC devices, determines the operating temperature and related systems [18]. Over the past several years efforts are geared towards lowering the operating temperature of SOFCs to the intermediate temperature range (500-800C).
Rare earth (RE) doped ceria is one of the candidates for the electrolyte of intermediate temperature solid oxide fuel cell (ITSOFC) because of its ability to store and release oxygen ion vacancies due to its easily accessible oxidation states from Ce3 Ce4 and hence has high ionic conductivities at lower temperatures compared to that of YSZ [3]. The doping with lower valent RE cations into ceria creates a number of anion vacancies namely oxygen vacancies for charge compensation. Enhanced Conductivity results via oxygen diffusion through the oxygen vacancies introduced. In addition, doping of RE ions in ceria lattice leads to many industrial & technical applications such as catalysis, luminescent materials, [4] sensors and magnetic applications [5].
Single doping of ceria with RE ions is a way to create vacancy defects (oxygen vacancies) for improved optical, electrical and catalytic properties. An enhancement of these properties have been observed following the co-doping of ceria to produce materials such as Ce1-x-ySmxSryO2 [5], Ce
1-xSmx-yMgyO2−δ [6], Ce1-x(Gd0.5Pr0.5)O2 [7], Ce0.8Sm0.12Pr0.08O2−δ [8], Ce1-x(Pr1/3Sm1/3Gd1/3)xO2−δ [9].
Densification of the electrolyte material at lower sintering temperature/time still remains as one of the major technical challenges which can save energy and reduce the fabrication costs of SOFCs. Of late, microwave sintering (MS) of ceramics, has emerged as an alternative approach for densification of ceramics and has become a most sought-after process due to its rapid heating, enhanced densification rate yielding in uniform, finer microstructure with much higher densities at lower temperature/time when compared to conventional sintering. [10] [19].
In a previous work, S.K. Tadokoro et. al synthesized Ce0.85Y0.13Pr0.02O2–δ sample by both co-precipitation and mixing of powder techniques, sintered at 14500C for 4h with conventional sintering approach. They reported structural and electrical properties of the prepared sample [11].
International Journal of Emerging Technology and Advanced Engineering
Website: www.ijetae.com (ISSN 2250-2459, ISO 9001:2008 Certified Journal, Volume 7, Issue 11, November 2017)
79
We used the energy efficient frittage -- the microwave sintering (at 13000C for 30min) which has several advantages over that of the conventional sintering and developed a co-doped solid ceria electrolyte, which may be a potential electrolyte for intermediate temperature solid oxide fuel cells (IT-SOFCs).
II. EXPERIMENTAL
2.1. Powder and Pellets Preparation:
The Y3+ and Pr3+ co-doped ceria Ce0.8Y0.2-xPrxO2–δ (x = 0.00, 0.05, 0.10) electrolyte materials were synthesized via sol-gel auto-combustion synthesis. Stoichiometric proportions of ammonium ceric nitrate, yttrium nitrate hex hydrate, Praseodymium nitrate hex hydrate, citric acid and ethylene glycol were weighed and were dissolved in deionized water under magnetic stirring. Citric acid (as a chelating agent) and ethylene glycol (as a gel formation agent) were added to the resultant solution, with metal to citric acid ratio as 1:1.5 and citric acid to ethylene glycol ratio as 1:1.2. The pH of the solution was adjusted near around 7 (pH=7) by adding aqueous Ammonia. The final homogeneous solution was heated to nearly 90°C to evaporate the water and excess residues and to form a viscous gel like substance. The obtained gel was further heated to 150°C for reaching the combustion point, yielding solid particles. These particles were ground thoroughly in the agate mortar. The powder thus ground was calcined for 2 h at 800°C to eliminate unwanted carbonaceous materials and also to get crystallized formation of samples. The calcined powders were further ground and were compressed with a pellet die at a pressure of 5 MPa to fabricate pellets (10 mm in diameter and 2 mm in thickness), and subsequently sintered at 1300°C for 30 minutes using a programmable microwave furnace.
2.2. Characterization:
The crystalline nature and phase purity of the synthesized samples were characterized by powder X-ray diffraction using Philips Xpert PRO ALPHA1 Panalytical diffractometer with cu Kα1 monochromatic radiation (λ= 0.15406 nm) in phase-wise analysis. Data were collected by step scanning over a 2θ range from 20 to 80° with a step size of 0.02° at the scanning rate of 2° min–1. The microstructure of sintered samples was executed by scanning electron microscope (SEM) using ZEISS EVO 18 special edition. To enable SEM characterization, the prepared pellets were sputtered with Au coating.
Impedance measurements of all the samples were taken using the Wayne Kerr impedance analyzer 6500B with temperature ranging from 250°C to 500°C. Netzsch DIL 402 PC dilatometer was used to investigate the thermal expansion studies in the temperature ranging from room temperature to 800°C at a heating rate of 3° min–1.
III. RESULTS AND DISCUSSION
3.1 X-Ray Powder Diffraction analysis (XPRD)
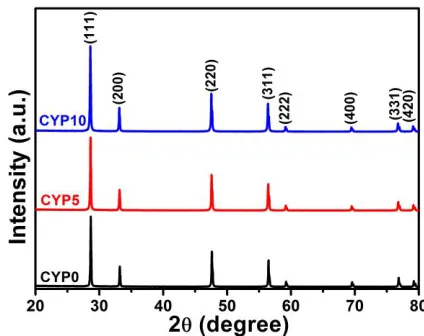
Fig.1 (a) illustrates the X-Ray Powder Diffraction patterns of all the Ce0.8Y0.2–xPrxO2–δ powder samples recorded at room temperature. The diffraction peaks are indexed to (111), (200), (220), (311), (222), (400), (331) and (420). For all the samples, only cubic fluorite phase
with Fm m3 space group was detected. The diffraction peaks in each XPRD pattern coincided well with the standard data of CeO2 [JCPDS PDF no: 34–0394].
Fig. 1(a). XRD patterns of sintered CYP system
It can also be observed from the XPRD patterns that the main diffraction peaks shift towards smaller 2θ with the increase in the dopant concentration, as can be seen in Fig. 1(b) with the shifting of (111) diffraction peaks to the left or smaller 2θ. This shift is indicative of change of lattice parameter, which confirms that the dopants are dissolved into the Ce sites, and the subsequent creation of oxygen vacancies [14]. It can be seen from Table 1 that the lattice parameter increases linearly with dopant concentration in agreement with Vegard‘s law as ionic radius of Pr3+
[image:2.612.336.548.349.517.2]International Journal of Emerging Technology and Advanced Engineering
Website: www.ijetae.com (ISSN 2250-2459, ISO 9001:2008 Certified Journal, Volume 7, Issue 11, November 2017)
80 Fig. 1(b). Peak shift in XRD patterns of CYP system
Table I showsvarious Crystallographic parameters such as crystal structure, unit cell volume and relative density of the obtained samples. The relative densities of the obtained samples were calculated as the ratio between bulk density and theoretical density.
(%) 100
rel
th D D
D
---(1)
The bulk density (D) of the pellets was measured using the Archimedes principle using xylene as the liquid and theoretical density (Dth) was calculated from the XRD data. The relative densities of all the samples were found to be above 95%. This indicates the low porosity in the co-doped ceria samples.
TABLE I
CRYSTALLOGRAPHIC PARAMETERS OF CYP SYSTEM
Sample Id
Crystal structure
Lattice constant
(a)
Volume of unit cell (V)
Relative Density (%) CYP0 Cubic 5.4010 157.55 95.4
CYP5 Cubic 5.4046 157.87 95.7
CYP10 Cubic 5.4082 158.18 96.8
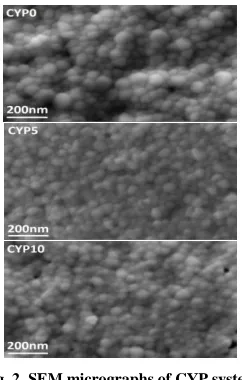
3.2. Micro Structure(SEM analysis)
Fig. 2 depicts the SEM micrographs of the synthesized samples of ceria co-doped with Y3+ and Pr3+ microwave sintered at 13000C for 30minutes. The co-doped ceria samples Ce0.8Y0.2–xPrxO2–δ show very dense structure in accordance with the relative density of the sintered pellets.
[image:3.612.67.270.128.300.2]Microwave Sintering at 1300°C yielded in a near uniform sub-micrometer grain size with negligible porosity. The spherically shaped smaller particle size sample is very much desired to obtain dense ceramics. [6] [10].
Fig. 2. SEM micrographs of CYP system
3.3. Electrochemical Impedance Spectroscopy (EIS) results
Fig. 3 shows the AC impedance spectra of the obtained co-doped ceria samples at 250°C. The impedance analysis of all the specimens was performed in the temperature ranging from 250°C to 500°C with the frequency range of 50Hz and 5MHz. Impedance data collected for the obtained samples are graphed as Nyquist plots. A Nyquist plot is graphed with real part of the impedance (Z/) on X-axis and negative imaginary part of impedance (–Z//) on Y-axis. Nyquist plot of an electrolyte material is usually consisted of three successive semicircular arcs; High frequency semi-circle corresponds to grain resistance (Rg), intermediate frequency semi-circle corresponds to grain boundary resistance (Rgb) and low frequency incomplete arc corresponds to electrode resistance (Re) [7]. The complex impedance plots of all the compositions were fitted by Z-View software. It can be observed that the radius of the semicircle decreases with the increase in the composition.
[image:3.612.384.505.189.379.2]International Journal of Emerging Technology and Advanced Engineering
Website: www.ijetae.com (ISSN 2250-2459, ISO 9001:2008 Certified Journal, Volume 7, Issue 11, November 2017)
[image:4.612.337.545.114.295.2]81 Fig. 3. Complex impedance plots of CYP system at 250°C
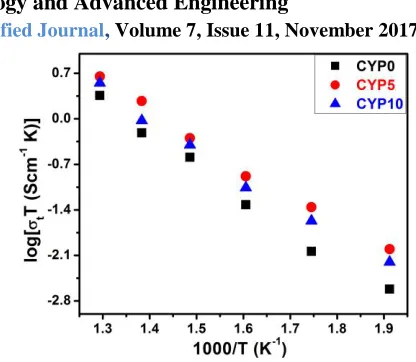
3.4. Total Ionic Conductivity (TIC)
Fig. 4 is the typical Arrhenius plot of the dependence of Total conductivity with temperature. The total ionic-conductivity ‗σt‘ is calculated as
t t
t R A
--- (2)
Where ‗t‘ is the specimen thickness, ‗A‘ is cross sectional area of the specimen. ‗Rt‘is the total resistance of the specimen. Rt includes the grain resistance (Rg) and grain boundary resistance (Rgb) from the complex impedance plot.
These temperature dependent conductivity plots may be linearized by plotting the logarithmic relation between log (σT) and 1000/T [12].The activation energy for conduction of all samples was calculated from the conductivity plots by using Arrhenius relation
0exp( )
E T
kT
---(3)
Where, ‗E‘ is the activation energy for conduction (ion migration), ‗T‘ indicates the absolute temperature, ‗k‘ is the
Boltzmann constant and ‗σ0‘ is the pre–exponential factor.
Fig. 4. Total ionic-conductivity plots of CYP system
The substitution of cerium cations by lesser valent Y3+ and Pr3+ cations improves total conductivity due to formation of oxygen vacancies. The presence of mobile oxygen vacancies (defects) causes the interaction between the dopant cations and results in smaller calculated activation energies [12]. The increase in the concentration of mobile ions (oxygen vacancies) leads to the enhanced ionic conductivity of the co-doped ceria. [7] [12]. It is clear from Fig. 4 that the total ionic conductivity of each sample increases with the rise of temperature as thermal excitation can boost the kinetic energy of carriers and force oxygen ions to pass through the oxygen vacancies with higher speed, which ultimately lead to the augmentation of conductivity.
Table II shows the average grain sizes calculated from SEM data and the conduction activation energies obtained by slope fitting of Arrhenius plots. It is observed that the co-doped sample CYP5 possess high conductivity with least activation energy. The decrease in lattice binding energy results increase in the number of oxygen vacancies. The number of oxygen vacancies is directly related to the conductivity of the material. [13]
TABLE III
MICRO STRUCTURAL AND ELECTRICAL PARAMETERS OF CYP SYSTEM
Sample Id
Grain Size (nm)
Total
Ionic-Conductivity (S/cm)
Activation Energy (eV)
CYP0 280 0.0030 0.97
CYP5 238 0.0058 0.86
[image:4.612.51.290.129.327.2]International Journal of Emerging Technology and Advanced Engineering
Website: www.ijetae.com (ISSN 2250-2459, ISO 9001:2008 Certified Journal, Volume 7, Issue 11, November 2017)
82
The enhanced ionic conductivity of co-doped ceria due to Y and Pr co-doping can be attributed to; (i) maximized non interfering oxygen vacancies due to doping of lesser valent cations into Ce lattice [14] (ii) the average ionic radii of co-doped cations Pr3+ (1.126 Å) and Y3+ (1.019 Å) is close to that of Ce4+ (0.970 Å) [8] [14] [16] (iii) smaller activation energy [13] and (iv) Increment in the grain-boundary and total conductivities with decreasing grain size for sintered densities of 95% or greater [8].
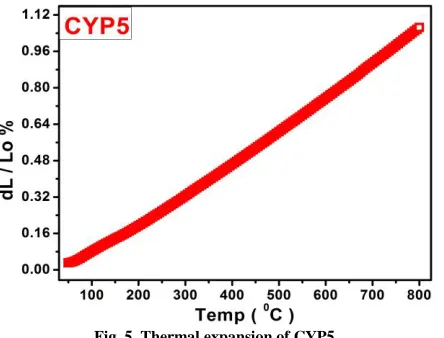
3.5. Thermal Expansion Studies:
Fig. 5 exhibits thermal expansion curve (using a dilatometer from room temperature to 800 ºC) of the composite CYP5, which is observed to be having least activation energy and highest ionic conductivity. In order to be an efficient electrolyte, electrolyte must have a matching thermal expansion coefficient with the electrode materials (anode & cathode). Mismatching of thermal expansion coefficient might result in undesirable stress during the operation of SOFC and may develop micro cracks in ceramic structure [17].
The linear thermal expansion (dL/Lo) was calculated in the temperature range of 30°C - 800°C. The thermal expansion coefficient (TEC) was calculated as
/ o
dL L TEC
dT
---(4)
Where dL L Lois the change in length;
o
dT T T is the temperature change; L0 is the length at initial temperature T0 and L is the length at terminal temperature T of the experiment. The TEC of CYP5 is found to increase linearly with temperature and TEC value is compatible with the thermal expansion coefficients of electrode materials [15].
[image:5.612.61.283.545.714.2]Fig. 5. Thermal expansion of CYP5
IV. CONCLUSIONS
The Y and Pr co-doped ceria Ce0.8Y0.2–xPrxO2–δ electrolyte materials were successfully synthesized by sol-gel auto-combustion method. The energy efficient microwave sintering resulted in high relative densities (>95%) of the obtained pellets. XRD patterns of all the samples ascertained the formation of single phase cubic fluorite structure. The morphology was analyzed by SEM. The calculated linear thermal expansion coefficient was in good agreement with the commonly used electrode materials for IT-SOFCs.
The results presented in this article show the significant enhancement in the ionic conductivity of the electrolyte which can improve fuel cell performance at intermediate temperatures. The ionic conductivity of the best composition of co-doped composite electrolyte was
3
5.8 10 S/cm at 5000C. The enhanced conductivity is likely to be attributed to the effect of co-doping. This research may lead to lower the operating temperature of SOFC. The results using these materials can strongly support the development of the low temperature SOFC for commercialization with an ultra-low fabrication cost and reliable performance.
Acknowledgement
One of the authors, Ch Madusudhan, extends his heartfelt thanks the University Grants Commission (UGC), New Delhi, India for its assistance under the scheme of UGC-Faculty Development program (12th plan).
REFERENCES
[1] Arie Hardian, Gyeong Man Choi, Veinardi Suendo and Ismunandar. 2014. ―Structure and Ionic conductivity of Co-doped Ceria SOFC electrolytes‖. Journal of the Australian Ceramic Society. 99-109. [2] Yifeng Zheng, Liqiang Wu, Haitao Gu, Ling Gao, Han Chen, Lukun
Guo. 2009. ―The effect of Sr on the properties of Y-doped ceria electrolyte for ITSOFCs‖. Journal of Alloys and Compounds. 586-589.
[3] Steffen Grieshammer, Masanobu Nakayama and Manfred Martin. 2016. ―Association of defects in doped nonstoichiometric ceria from first principles‖. Phys. Chem. Chem. Phys. 3804—3811.
[4] Mahdiyeh Jamshidijam, Pandiyarajan Tangaraj, Ali Akbari-Fakhrabadi, Miguel Angel Nino Galeano, Jonathan Usuba, Mangalaraja Ramalinga Viswanathan. 2017. ―Influence of rare earth (RE=Nd, Y, Pr, Er) doping on the microstructural and optical properties of ceria nanostructures‖. Ceramics International. [5] Ekaphan Swatsitang, Sumalin Phoka, Sitchai Hunpratub, Santi
Maensiri. 2016. ―Modification of Ce valence states by Sm/Sr co-doping of CeO2 nanoparticles for improved magneto-electrochemical
International Journal of Emerging Technology and Advanced Engineering
Website: www.ijetae.com (ISSN 2250-2459, ISO 9001:2008 Certified Journal, Volume 7, Issue 11, November 2017)
83
[6] Syed Ismail Ahmed, Tasneem Mohammed, Amal Bahafi, Madireddy Buchi Suresh. 2017. ―Effect of Mg doping and sintering temperature on structural and morphological properties of samarium-doped ceria for IT-SOFC electrolyte‖ Applied Nano Science. 243-252.
[7] S. Ramesh, K.C. James Raju. 2012 ―Preparation and characterization of Ce1−x(Gd0.5Pr0.5)xO2 electrolyte for IT-SOFCs‖. International
Journal of Hydrogen Energy. 10311-10317.
[8] Hailin Bi, Xiaomei Liu*, Lili Zhu, Jialing Sun, Shenglong Yu, Huamin Yu, Li Pei. ―Effect of MgO addition and grain size on the electrical properties of Ce0.9Gd0.1O1.95 electrolyte for IT-SOFCs‖.
2017. International journal of hydrogen energy. 1-10
[9] Kasarapu Venkataramana, Chittimadula Madhuri, Y. Suresh Reddy, G. Bhikshamaiah, C. Vishnuvardhan Reddy. 2017. ―Structural, electrical and thermal expansion studies of tri-doped ceria electrolyte materials for IT-SOFCs‖. Journal of Alloys and Compounds. 97-107.
[10] V.A. Sadykov, N.F. Eremeev, V.A. Bolotov, Yu.Yu. Tanashev, Yu.E. Fedorova, D.G. Amanbayeva, A.S. Bobin, E.M. Sadovskaya, V.S. Muzykantov, V.V. Pelipenko, A.I. Lukashevich, T.A. Krieger, A.V. Ishchenko, A.L. Smirnova. 2016. ―The effect of microwave sintering on stability and oxygen mobility of praseodymium nickelates-cobaltites and their nanocomposites‖. 1-6.
[11] S.K. Tadokoro, E.N.S. Muccilo. 2006. ―Effect of solute dispersion on microstructure and electrical conductivity of Ce0.85Y0.13Pr0.02O2–δ
solid electrolyte. Journal of Power Sources. 1-7.
[12] P.Ravi Chandran, T.V.Arjunan. Investigation on Mg and Sc co-doped Ceria electrolyte for IT-SOFC. International Journal of Engineering and Technology. 2014;6(3):1432-1440.
[13] Asia Rafiquea, Rizwan Raza, Nadeem Akram, Kaleem Ullah, Amjad Ali, Muneeb Irshad,Khurram Siraj, M.Ajmal Khan, Bin Zhu,Richard Dawson. 2015. ―Significance enhancement in the conductivity of core shell nanocomposite electrolyte‖. RSC Adavances. 1-3. [14] Dae-Joon Kim. 1989. ―Lattice Parameters, Ionic Conductivities, and
Solubility limits in Fluorite-Structure M02 Oxide [M = Hf4+,Zr4+,
Ce4+,Th4+,U4+) Solid Solutions‖. J. Am. Ceram. Soc. 1415-21. [15] TIAN Changan, JI Bifa, XIE Jinsong, BAO Weitao, LIU Ke,
CHENG Jihai, YIN Qiyi. 2014. ―Preparation and characterization of Ce0.8La0.2–xYxO1.9 as electrolyte for solid oxide fuel cells‖. Journal of
Rare Earths.1162-1169.
[16] J.F.Q. Rey, E.N.S. Muccillo. 2004. ―Lattice parameters of yttria-doped ceria solid electrolytes‖. Journal of the European Ceramic Society. 1287–1290.
[17] S. Ramesh, V. PrashanthKumar, P. Kistaiah, C. Vishnuvardhan Reddy. 2010. ―Preparation, characterization and thermo electrical properties of co-doped Ce0.8 − xSm0.2CaxO2 − δ materials‖. Solid State
Ionics. 86-91.
[18] Yanyan Liu, Liangdong Fan, Yixiao Cai, Wei Zhang, Baoyuan Wang,and Bin Zhu. 2017. ―Superionic Conductivity of Sm3+, Pr3+, and Nd3+ Triple-Doped Ceria through Bulk and Surface Two-Step Doping Approach‖. ACS Appl. Mater. Interfaces. 23614−23623. [19] Kasarapu Venkataramana, K. Ravindranath, Chittimadula Madhuri,