PROTOCOL FOR FINE-WIRE AND SURFACE EMG
DATA COLLECTION AS PART OF CLINICAL GAIT
ASSESSMENT
School of Health Sciences
University of Salford, Salford, UK
2016
Pornsuree Onmanee
Submitted in Partial Fulfilment of the Requirements of the Degree of
i
List of tables ... viii
List of figures ... ix
Acknowledgements ... xii
Declaration ... xiii
Abbreviations ... xiv
Conference proceeding ... xv
Abstract ... xvi
Chapter 1 Overview and scope of the thesis... 1
1.1 Electromyography (EMG) in clinical gait analysis ... 1
1.1.1 Role of EMG in the management of neuromuscular disorders ... 1
1.1.2 History of EMG within clinical gait analysis ... 2
1.1.3 Current status of EMG within clinical gait analysis ... 4
1.2 Rationale of the thesis... 9
1.2.1 Chapter 3 Systematic review: Normative EMG profiles of lower limb muscles during gait. ... 9
1.2.2 Chapter 5 Normalisation of EMG during normal gait ... 9
1.2.3 Chapter 6 Application of fine-wire sensors for EMG measurement of tibialis posterior in clinical gait analysis ... 10
1.2.4 Chapter 7 Incorporating EMG data with kinematic and kinetic data to understand walking in healthy adults ... 10
1.2.5 Chapter 8 Demonstration of EMG measurements of the tibialis posterior in clinical gait analysis... 11
ii
1.3 Potential significance of this research ... 12
Chapter 2 Background ... 14
2.1 Motor unit action potential ... 14
2.1.1Generation of muscle fibre action potential ... 14
2.1.2 Propagation ... 17
2.1.3 Motor unit action potential ... 17
2.2 EMG acquisition ... 18
2.2.1 Sensors ... 19
2.2.2 Electrode placement ... 22
2.2.3 EMG signal processing and analysis ... 24
2.2.4 Normalisation ... 25
Chapter 3 Systematic review: Normative EMG profiles of lower limb muscles during gait ... 27
3.1 Research questions ... 29
3.2 Search method ... 29
3.3 Selection criteria ... 30
3.3.1 Participants ... 30
3.3.2 Study design ... 30
3.3.3 Outcome measure ... 31
3.4 Quality of measurement and study ... 31
3.5 Identification of included studies and data extraction. ... 34
3.6 Data analysis ... 34
3.7 Results ... 36
iii
3.7.2 EMG profiles and variability ... 38
3.8 Discussion ... 48
3.8.1 Study characteristics ... 48
3.8.2 Synthesised grand EMG profiles and standard deviations ... 49
3.8.3 Identify issues for further investigations ... 57
3.9 Limitations ... 59
3.10 Conclusion and recommendations ... 60
Chapter 4 Experimental procedure ... 62
4.1 Participants ... 63
4.2 Procedure ... 64
4.2.1 Recruitment ... 64
4.2.2 Electromyographic collection ... 65
4.2.3 Kinematic, kinetic and power analysis ... 71
4.3 Data processing... 73
4.3.1 EMG data ... 73
4.3.2 Kinematics, kinetics and power ... 74
Chapter 5 Normalisation of EMG during gait ... 76
5.1 Background ... 76
5.1.1 What is normalisation? ... 76
5.1.2 Evaluating the quality of normalisation ... 78
5.1.3 EMG normalisation methods in the literature ... 81
5.1.4 Selecting the appropriate normalisation ... 84
5.1.5 Research question ... 88
iv
5.2.1 Normalisation: Calculation of reference amplitudes ... 89
5.2.2 Walking EMG data ... 91
5.2.3 Assessment of variability ... 92
5.3 Result ... 93
5.3.1 Effects of normalisation on within session: between-subject variability ... 93
5.3.2 Effects of normalisations on within subject: between-session variability ... 97
5.4. Discussion ... 99
5.4.1 Within session: between-subject variability ... 99
5.4.2 Within subject: between-session variability ... 102
5.4.4 Limitations ... 105
5.5 Conclusion and clinical recommendations ... 105
Chapter 6 Application of fine-wire sensors for EMG measurement of tibialis posterior in clinical gait analysis ... 107
6.1 Background ... 108
Sensors ... 108
a) Surface sensors ... 108
b) Inserted/indwelling sensors ... 109
6.2 Research questions ... 114
6.3 Method ... 114
6.3.1 Participants ... 114
6.3.2 Data analysis ... 115
6.4 Results ... 119
6.4.1 Comparison of EMG between proximal and distal fine-wire sensors ... 119
v
6.4.3 Comparison of the EMG profiles between surface and fine-wire EMG ... 122
6.5 Discussion ... 128
6.5.1 Comparison of EMG between proximal and distal fine-wire sensors ... 128
6.5.2 Number of gait cycles ... 129
6.5.3 Comparison of the EMG profiles between surface and fine-wire EMG ... 130
6.5.4 Limitations ... 135
6.6 Conclusion ... 135
Chapter 7 Incorporating EMG data with kinematic and kinetic data to understand walking in healthy adults ... 137
7. 1 Background ... 137
7.1.1 Effect of different speeds ... 138
7.1.2 Effect of age... 139
7.2 Research questions ... 142
7.3 Method ... 142
7.3.1 Participants ... 142
7.3.2 Protocol ... 142
7.3.3 Data analysis ... 143
7.4 Results ... 144
7.4.1 Speed dependence of the lower leg muscles ... 144
7.4.2 Comparison of EMG data from older and younger adults ... 156
7.5 Discussion ... 159
7.5.1 Speed dependence of the lower leg muscles ... 159
7.5.2 Comparison of EMG data from older and younger adults ... 164
vi
7.6 Conclusion ... 167
Chapter 8 Demonstration of EMG measurements using fine-wire and surface sensors in lower limb muscles for clinical gait analysis ... 169
8.1. Background ... 169
8.1.1 EMG acquisition protocol ... 169
8.1.2 Stroke ... 170
8.1.3 Neuromuscular activation changes after stroke ... 172
8.1.4 Kinematic, kinetic and power changes to gait after stroke ... 172
8.2 Research questions ... 175
8.3 Method ... 175
8.3.1 Participants ... 175
8.3.2 Protocol ... 176
8.3.3 Data analysis ... 177
8.4 Results ... 177
8.4.1 Case 1: Healthy older adults ... 177
8.4.1 Case 2: STK01 ... 180
8.4.3 Case 3: STK02 ... 185
8.4.4 Case 4: STK03 ... 189
8.5 Discussion ... 193
8.5.1 Identification of EMG pathological changes ... 193
8.5.2 EMG reports and other gait data... 194
8.5.3 Limitation ... 198
8.5.4 Future studies ... 199
vii
Chapter 9 Synthesis, clinical implications and conclusions ... 200
9.1 Synthesis of findings ... 200
9.2 Clinical implications ... 205
9.3 Limitations ... 207
9.4 Future studies ... 208
9.5 Final conclusion ... 209
Appendix 1 Search strategies for systematic review ... 210
Appendix 2 Example of pooling graphs ... 211
Appendix 3 Power spectrum of the tibialis posterior ... 213
viii
List of tables
Table 3.1 Reporting quality scores ... 32
Table 3.2 Key study characteristics ... 33
Table 3.3 Analysis table for reported muscle Group 1 ... 40
Table 3.4 Summary table for muscles and average standard deviation of the grand EMG profiles in group 1 (ascending order of average standard deviation) ... 41
Table 3.5 Analysis table for reported muscle Group 2 and 3 ... 41
Table 4.1 Electrode placements for the tibialis anterior ... 66
Table 4.2 Electrode placements for the medial gastrocnemius ... 66
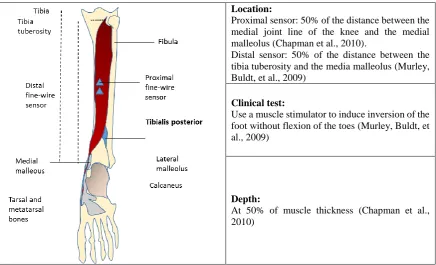
Table 4.3 Electrode placements for the tibialis posterior ... 67
Table 6.1 Performance of surface and fine-wire sensors on muscles acting on the ankle during gait ... 113
Table 6.2 Comparison of EMG profiles from proximal and distal fine-wire sensors ... 120
Table 6.3 Between-subject standard deviation ... 121
Table 6.4 Comparison of fine-wire and surface sensors ... 122
Table 6.5 Standard error of measurement of the EMG profiles across the gait cycle ... 123
Table 6.6 Speeds ... 124
ix
List of figures
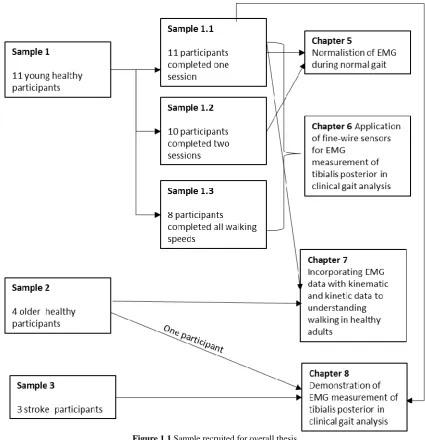
Figure 1.1 Sample recruited for overall thesis ... 12
Figure 2.1 Motor unit (Konrad, 2006) ... 15
Figure 2.2 The action potential (Konrad, 2006) ... 16
Figure 2.3 Depolarisation/repolarisation within excitable membrane (Konrad, 2006) ... 17
Figure 2.4 Surface sensors a) Passive sensor, b) active sensors (Delsys Inc., 2015) ... 19
Figure 2.5 Paired-hook wire sensor ... 22
Figure 3.1 Diagram of paper identification ... 37
Figure 3.2 EMG profiles reported by multiple studies with standard deviation (Group1) . 43 Figure 3.3 Group 1 Grand EMG profiles ... 44
Figure 3.4 Group 2 Grand EMG profiles ... 45
Figure 3.5 Group 3 Grand EMG profiles ... 47
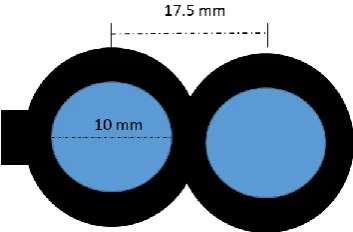
Figure 4.1 Dimensions of dual-surface electrode ... 68
Figure 4.2 Examples of ultrasound images used to guide electrode placement ... 70
Figure 4.3 participant with electrode and sensors ... 71
Figure 4.4 Participant with EMG sensors and markers ... 72
Figure 5.1 Position for inversion ... 90
Figure 5.2 Position for dorsiflexion and plantarflexion ... 90
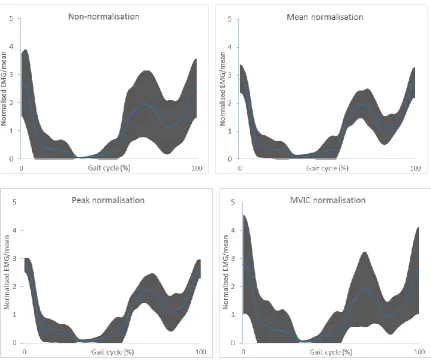
Figure 5.3 Grand ensemble averages of fine-wire EMG of tibialis anterior (TA) from session 1 with different normalisations scaling to their means ... 94
Figure 5.4 (a) SD/Mean across the gait cycle and (b) Mean of SD/mean from fine-wire (FW) EMG of tibialis anterior (TA) session 1 ... 95
Figure 5.5 Mean of SD/mean in session 1 ... 95
Figure 5.6 Between-subject CV in session 1 ... 96
x
Figure 5.8 Between-subject CMC in session 1 ... 96
Figure 5.9 Mean of SEM/mean across the gait cycle from different normalisations ... 97
Figure 5.10 Between-session CV ... 98
Figure 5.11 Between-session VR ... 98
Figure 5.12 Between-session CMC ... 98
Figure 6.1 a dual-surface electrode... 109
Figure 6.2 Paired hook wires electrode ... 110
Figure 6.3 Scatter plots of the proximal and distal fine-wire EMG ... 120
Figure 6.4 Scatter plots of fine-wire and surface EMG. ... 123
Figure 6.5 Standard error of measurement across the gait cycle ... 124
Figure 6.6 Grand average of EMG profiles across 5 speeds from eight subjects... 125
Figure 6.7 Grand ensemble average of EMG profiles with SD across five speeds from eight subjects ... 126
Figure 6.8 Median correlation coefficient (r-value) between fine-wire and surface EMG of the tibialis anterior ... 127
Figure 6.9 Median correlation coefficient (r-value) between fine-wire and surface EMG of the medial gastrocnemius ... 127
Figure 7.1 Grand EMG ensemble average of the tibialis posterior derived from a single gait cycle for each participant across five speeds (Murley et al., 2014) ... 139
Figure 7.2 A normative dataset from 11 healthy participants at self-selected speed ... 146
Figure 7.3 Grand ensemble average of the EMG profiles across five speeds ... 148
Figure 7.4 Grand ensemble average of the EMG at five speeds ... 149
Figure 7.5 Averaged standard deviation across the gait cycle at different speeds ... 150
Figure 7.6 Grand ensemble average of ankle kinematics with standard deviation ... 152
xi
Figure 7.8 Grand ensemble average of ankle kinetics with standard deviation ... 154
Figure 7.9 Grand ensemble average of the ankle kinetics at five speeds ... 155
Figure 7.10 Averaged standard deviation of the kinematic profiles across the gait cycle at different speeds ... 155
Figure 7.11 Average standard deviation of the kinetic profiles across the gait cycle at different speeds ... 156
Figure 7.12 Comparison between the averaged data of the four older participants against the younger normative dataset ... 158
Figure 8.1 Healthy01 walking barefoot compared to the definitive normative database .. 179
Figure 8.2 STK01 walking barefoot ... 183
Figure 8.3 STK01 walking with AFO ... 184
Figure 8.4 STK02 walking barefoot ... 187
Figure 8.5 STK02 walking with AFO ... 188
Figure 8.6 STK03 walking barefoot ... 191
xii
Acknowledgements
First and formost, I would like to thank my supervisors Professor Richard Baker, Professor Richard Jones and Dr. Kristen Hollands for their patience, excellent supports and guidance. I appreciate all their contributions and ideas to make my PhD experience productive. It has been an honour to be one of their students. I am thankful for the great example Richard Baker has been as a successful researcher and professor. The enthusiasm and joy Kris has for her research was motivational and I am thankful for all opportunity she gave me. I would like to thank all my examiners through PhD journey for their valuable comments.
I greatly appreciate Department of Medical Service, Ministry of Public health in Thailand for opportunity to pursue higher education, all staff in the orthotic research and locomotor assessment unit at The Robert Jones& Agnes Hunt Orthopaedic Hospital for the fine-wire training, Ruth Barn and her radiologists (in Glasgow Caledonian University) who gave me a lot of information regarding research in this field. My thanks also go toward all volunteers in my studies, particularly participants from Brain and Spinal Injury Centre, Salford for their time and patience. I would also like to extend my appreciation to all lecturers and technical staff in the university. They are always helpful and supportive. I would like to thank all my friends- Ursula and Ornella, Pantip and other PhD students for great PhD experiences . My thanks are also to John Ramsden for good advice.Finally, allow me to express my great appreciation to my parents (Suriya and Pornpen), my aunt (Bunga) and my brother (Pongtawan), who love and believe in me no matter what I do. I extend my grateful thanks to Kitti Kuvijitsuwan, who is always by my side and takes care of me, and his family (Somchai and Kanokpon) for supporting and giving me advice. Without support from those here mentioned, and many people whose names may not be listed here, the completion of this work would not be possible. Thank you all so much.
xiii
Declaration
xiv
Abbreviations
CGA Clinical gait analysis
CMC Coefficient of multiple correlation CV Coefficient of variance
EMG Electromyography
ICC Intraclass correlation coefficient
SEM Standard error of measurement
xv
Conference proceeding
Onmanee, P., Baker, R. J., Jones, R. K., & Hollands, K. (2015). Comparison of the EMG profiles detected by multiple fine wire electrodes during gait of the selected lower limb muscles. Gait and Posture, 42, Supplement 3, S9-S10. doi: 10.1016/j.gaitpost.2015.03.029 In: 1st Clinical Movement Analysis World Conference, 29th September – 4th October, Rome,
xvi
Abstract
Background: Electromyography (EMG) is a measure of neural activation to muscles and as such can give a window into neuromuscular dysfunction in patients. Although it was the primary focus of early clinical gait analysis (CGA), it has become progressively less common since the widespread adoption of optoelectronic measuring systems capturing three dimensional kinematics and kinetics. This is surprising since EMG has considerable potential to explain gait deviations observed in the kinematic and kinetic data.
Apart from the extra time required for collecting data there are a number of barriers to the use of EMG in modern CGA. The most obvious is that EMG data has traditionally been collected, analysed and, most importantly, presented using quite different techniques which prevents a streamlined integration of EMG with the kinematic and kinetic data. Secondly, although the general characteristics of normative EMG patterns in the larger muscles are reasonably well understood, there is considerably less consensus on those which are smaller but still clinically important. Finally several of the most clinically important muscles, such as the tibialis posterior (TP), can only be accessed using fine-wire techniques and there is no consensus on how such data should be presented clinically.
Objectives: This research aims to define rigorous data capture, analysis and presentation protocols for incorporation of both fine-wire and surface EMG measurements into CGA. The secondary aim is to provide definitive normative EMG profiles in the selected lower limb muscles across the gait cycle in healthy adults as reference for CGA purposes. Finally, a case series aim to explore whether the methods of collection, analysis and data presentation established in this work could be used to detect patterns of muscle dysfunction underlying kinematic impairments in the gait of stroke participants.
xvii
wide range of variability in lower limb EMG profiles, a lack of studies in deep muscles which potentially play important roles in gait such as TP, no standardisation of fine-wire EMG acquisition and processing (compared to the surface EMG) and various methods of EMG normalisation. These variety of collection and analysis techniques resulted in large variability, in the current literature base, of EMG profiles between different studies. The majority of EMG studies currently available in the literature focus on larger superficial muscles. Studies on TP were scarce in spite of its important role in foot posture and gait. One reason for the lack of information on deep lower limb muscles may be that these can only be assessed using fine-wire sensors, for which there are no guidelines for standardised collection procedures amenable for use in CGA.
xviii
collected using normalisation with respect to the peak over six gait cycles from TP, TA and MG alongside kinematics and kinetics at five different speeds from eight young participants. Finally a case series of EMG collections with participants with stroke were used to explore the proof-of-concept of how standardised EMG methods could be implemented in clinical gait analysis and the potential benefits of using EMG to support identification of reasons for gait deviations in CGA. A normative database collected using these established methods was effective to identify pathological features and changes of muscle activity in three participants with post-stroke when using ankle-foot orthosis (AFO). However, the sensitivity of the database to detect changes under AFO condition depended on the severity of the impairment.
1
Chapter 1
Overview and scope of the thesis
1.1 Electromyography (EMG) in clinical gait analysis
1.1.1 Role of EMG in the management of neuromuscular disorders
a) Importance of neuromuscular disorders
Neuromuscular disorder is a broad term describing a range of conditions that affect the function of muscles as a direct or indirect consequence of pathology affecting the central or peripheral nervous system. Most of these disorders result in the individual affected having difficulties in moving around which vary in age of onset, severity, and speed of progression. Common neuromuscular disorders include stroke, cerebral palsy (CP) and Parkinson’s diseases. The estimated prevalence rate of the 24 most common neuromuscular disorders was 160 per 100,000 population from literature reported in 2015 (Deenen, Horlings, Verschuuren, Verbeek, & Van Engelen, 2015). In the UK, there were over 70,000 diagnosed cases from a population of over 60,000,000 (Pohlschmidt & Meadowcroft, 2010). Overall in the UK, the stroke incidence is about 152,000 a year (Townsend et al., 2012). The major causes are ischaemic which accounted for the majority (85%) and haemorrhagic (15%) (Feigin et al., 2013).
b) Importance of clinical gait analysis in managing neuromuscular disorders
2
inform clinical decision making (particularly choice of procedures during complex orthopaedic surgery) and postoperatively to quantify its effects (Gage, Perry, Hicks, Koop, & Wernt, 1987; Gueth, Abbink, & Reuken, 1985; Hoffer, Barakat, & Koffman, 1985). The careful use of gait analysis has led to improvements in surgical techniques (Gage, 1993) and other treatments such as ankle-foot orthosis (Tyson & Kent, 2013).
c) Importance of EMG with clinical gait analysis
Electromyography (EMG) can be regarded as an essential tool in gait analysis, which primarily focusses on lower limb extremities for patients with motor disorders (Kleissen et al., 1998). It is regarded as the only direct method to identify the pattern of muscle dysfunction in an individual (Perry, 1992). The technique can be used for monitoring in clinical follow-up and evaluation of the treatment.
1.1.2 History of EMG within clinical gait analysis
a) Early studies of gait analysis and muscle function
3
Jules Etienne Marey is regarded as the first modern gait analyst to apply Newton’s laws to the human body (Baker, 2007). With his student, Gaston Carlet, he measured the vertical component of the ground reaction using pressure transducers in 1872 which led, with another student, to the development of a pneumatic force plate (Marey, 1883). Marey also experimented with chronophotography using a range of different types of markers to obtain exquisite images for clinical interpretation (Baker, 2007). Marey was also the first researcher to record the electrical activity during a voluntary muscle contraction and introduced the term ‘electromyography’in 1890 (Clarys, 1994).
Willhelm Braune and Otto Fischer conducted three-dimensional gait analysis using four cameras and a continuous exposure, with the participant walking in the dark with flashing Geissler tubes strapped to the body (Braune & Fischer, 1987). The forces acting on each segment were calculated. This is the foundational work for modern gait analysis.
b) Post-war pioneer of clinical gait analysis
After the second world war, a group established at Berkeley carried out comprehensive biomechanical gait analysis to facilitate design of prostheses by using bone pins to accurately measure the movements in transverse plane and minimize skin movement artefacts (Eberhart et al., 1947). Perhaps surprisingly, given their use of bone pins, they considered that EMG was too invasive to use. They emphasized that the improvement in mobility treatments including surgery, physiotherapy, and prostheses relied heavily on the understanding of normal locomotion.
4
Lieberman, 1981). However, the available technology was limited and resulted in labour intensive and time consuming data processing.
Jacqueline Perry and David Sutherland added other gait data to aid interpretation. Perry introduced both observational and instrumented methods for measuring temporal-spatial data (Perry, 1992). While Sutherland continued developing the three dimensional data on five joint angles using three cameras (Sutherland & Hagy, 1972). Later Jurg Bauman synchronized EMG data with the images taken from movie files (Baumann & Baumgartner, 1974). As a result of advanced camera technology, clear images of the foot taken from a transparent foot plate resulted in useful reference data on foot movement during gait.
c) Rise of 3-D kinematics and kinetics
With the arrival of computerized data processing, the time taken to process data was dramatically reduced and routine assessment of multiple data stream became possible. Sensors with direct interface to the computer were developed to monitor movement of body segments, exemple of such as sensors including the electrogoniometer and accelerometers (Karpovich, Herden, & Asa, 1959; Lamoureux, 1971; Morris, 1973).
In 1967 Furnée presented a study of arm movement using a video camera based opto-electronic system (Furnée, 1967) and a little later Dinn, Winter, and Trenholm (1970) independently developed a similar video based technology. Such systems were used extensively by Winter, Greenlaw, and Hobson (1972), and Jarrett, Andrews, and Paul (1976) and laid the foundation for current technology which allows synchronisation and calculations of kinematics, kinetics, EMG, and energy consumption in real time.
1.1.3 Current status of EMG within clinical gait analysis
5
laboratories. EMG data may be presented in the form of raw, rectified or linear envelope signals or as being on or off with respect to some arbitrary threshold. By contrast there is a much more standardised approach to the presentation and reporting of kinematic and kinetic data. This difference may reflect the relative importance currently attributed to data from different sources. Kinematic and kinetic data are now generally regarded as the core measurements and thus standardized presentation and reporting techniques have evolved. EMG, by contrast, is regarded as of secondary importance and been subject to less standardisation. This has established a vicious circle as, without standardized methods of reporting, it becomes more difficult for a consensus to develop as to how EMG data should be interpreted which may further lead to a degradation in its perceived importance relative to other data sources.
A key aspect of interpretation of data during clinical gait analysis is the comparison of data from multiple sources. Consistent formatting of kinematic and kinetic data allows ready comparison of what is happening at different joints, in different planes and between joint angles, moments, powers and components of the ground reaction. Standardised methods of presenting data from a number of trials and summary data (either as a representative or average trace) allow a consideration of the variability in movement patterns alongside that of the representative trace. Recent suggestion that gait graphs should be marked-up with symbols (Baker, 2013) also makes biomechanical interpretation much more transparent but is only practical if presentation of gait graphs is in a similar format to that currently regarded as standard for kinematics and kinetics. There is thus a strong argument for developing methods of capturing, processing and presenting EMG data in a format that is directly comparable to the current standards for kinematic and kinetic data.
6
normative data but they have employed a range of techniques for data acquisition and processing including normalisation techniques and analysis often with inadequate justification for selection (Agostini et al., 2010; Kadaba et al., 1989; Lyons, Perry, Gronley, Barnes, & Antonelli, 1983; Schwartz, Rozumalski, & Trost, 2008; Sutherland, 1984, 2001; Wootten, Kadaba, & Cochran, 1990; Yang & Winter, 1985). In particular, EMG normalisation is a critical technique to allow comparison between subjects and sessions. Several techniques have been proposed but there is no consensus on which should be used clinically (Burden, 2010). Differences between acquisition and processing techniques affect the EMG profiles making the use of available reported data as clinical reference complicated. This also causes difficulty in clinical interpretation and comparisons between different laboratories. And whilst it is standard practice for laboratories to collate their own normative reference databases for kinematics and kinetics this is much less common for EMG data.
Though several guidelines on EMG have been published (Hermens & Merletti, 1999; Merletti, 1999), there are many substantial issues to be resolved before the standardised procedures and normative data can be established. For example, many patients who are diagnosed with rheumatoid arthritis or neurological disorders walk with impaired speeds. This suggests that provision of the normal EMG profiles over a range of speeds will be beneficial (Den Otter, Geurts, Mulder, & Duysens, 2004). Furthermore, the majority of research is done on superficial muscles because they can be accessed non-invasively with surface electrodes. Deeper muscles such as the tibialis posterior (TP) are often clinically important as well but there is very little data published describing normative patterns of EMG.
7
presenting the data in a format compatible with the kinetic and kinematic data used in clinical gait analysis. A secondary aim is to provide a definitive normative EMG dataset in selected lower limb muscles. This along with three dimensional kinematic and kinetic data across the gait cycle in healthy adults as reference for CGA. EMG of the deep muscle tibialis posterior is also focused upon as it may be impaired in patients with neuromuscular disorders and contribute to gait deviations to aid treatment plan.
The key research questions are: Chapter 3
i) Is there a consensus on profiles of lower limb muscle EMG during healthy walking and on protocols for capturing and processing EMG signals during gait?
a. Does the level of between-subject variability across studies decrease according to the quality of reporting/quality?
b. Is there a consensus on EMG profiles of lower limb muscle during gait and what is the between-subject variability of them?
c. What are required from further investigations? Chapter 5
ii) In healthy participants, what effect does the normalisation method have on the between-subjects and between-sessions repeatability of linear envelope EMG signals collected with fine-wire or surface sensors?
iii) In light of this and other differences between the normalisation schemes, which is the most appropriate for future clinical use?
Chapter 6
8
v) How many more gait cycles of fine-wire EMG are required to give the same confidence that the mean is representative compared with surface EMG?
vi) How do EMG signals from surface and fine-wire sensors compare between sessions (repeatability) and across a range of different walking speeds?
Chapter 7
vii) How EMG data from both surface and fine-wire can be integrated more effectively within the conventional methods of clinical gait analysis in healthy adults.
viii) How does walking speed affect the activity of the muscles of the lower leg and associated kinematics and kinetics?
ix) Is there any evidence that the neuromuscular changes associated with ageing are manifested in the EMG of the lower leg muscles during walking?
Chapter 8
x) Does the adoption of such methods for data collection, processing and presentation of EMG data enhance the clinical interpretation of gait analysis data?
xi) Is the variability around normative reference EMG collected using our suggested protocols sufficiently low to detect differences in the EMG profiles of the tibialis posterior, tibialis anterior and medial gastrocnemius due to neuromuscular pathology (stroke)?
9
-Can EMG profiles show the difference between walking with and without AFO for participants with post-stroke?
1.2 Rationale of the thesis
1.2.1 Chapter 3 Systematic review: Normative EMG profiles of lower limb muscles during
gait.
This chapter shows the grand EMG profiles of the lower limb muscles synthesised from a number of studies and determined the available EMG collecting, processing and analysis techniques. The systematic review was conducted using focused search terms on several databases to ensure capture of all relevant data. Customised data extraction and quality evaluation tools based on available relevant guidelines of EMG and research methods (e.g. Hermens and Merletti (1999); Merletti (1999); Von Elm et al. (2008) ) were used to ensure the best possible evidence was retrieved. In this review, the importance of EMG measurement guidelines is emphasized in order to obtain consistent EMG data. This review identified a number of issues in EMG measurements: lack of reported activity in deep muscles (despite the importance in gait), several normalisation techniques used and technical issues of fine-wire EMG. These formed the basis for further investigations in this PhD work.
1.2.2 Chapter 5 Normalisation of EMG during normal gait
10
sessions/days (Burden, 2010) in order to elicit variability in the underlying muscle responses. Common techniques were compared: peak, mean and maximal voluntary isometric contraction (using a dynamometer), which in theory provides clinical meaningful data. This led to a recommendation of the most appropriate normalisation technique to be used in the standardised protocol, then applied in subsequent chapters.
1.2.3 Chapter 6 Application of fine-wire sensors for EMG measurement of tibialis
posterior in clinical gait analysis
This chapter addresses some of the challenges regarding the application of fine-wire sensors in the measurement of the EMG of the tibialis posterior. This has important clinical implications since the muscle potentially makes an important contribution to gait deviations in participants with neuromuscular deficits, yet little is known about the activation of this muscle during gait. The similarity and variability (between sites of the same muscles, between subjects and between sessions and when walking at different speeds) between fine-wire and surface EMG were compared to determine protocols of collecting and processing of the wire EMG in CGA. This is the first study to investigate the sensitivity of fine-wire in tibialis posterior and the comparisons between two types of sensors on tibialis anterior and medial gastrocnemius.
1.2.4 Chapter 7 Incorporating EMG data with kinematic and kinetic data to understand
walking in healthy adults
11
recruited in normative reference. In order to identify the changes due to purely to different walking speeds or older age from those due to pathology, the dataset consisting of EMG, kinematic and kinetic data were presented with SD across the gait cycle and compared for the first time. The results will serve as a guide to provide a local normative database for CGA.
1.2.5 Chapter 8 Demonstration of EMG measurements of the tibialis posterior in clinical
gait analysis
This case series demonstrates the protocol for collecting and processing fine-wire and surface EMG with other gait data using an impairment focused approach. The comparison is of gait datasets between (1) stroke patients and healthy adults walking at matched-speed and (2) stroke patients walking with and without an AFO. The comparisons will explore if EMG data can help explain kinematic and kinetic gait deviations and provide proof-of-concept for the use of EMG in standard CGA practice.
1.2.6 Source of data for different chapters
12
Figure 1.1 Sample recruited for overall thesis
1.3 Potential significance of this research
13
A key achievement of this work will be the development of protocols for fine-wire EMG collection during dynamic task-gait. Whilst developed specifically for tibailis posterior the techniques will be applicable to all deep muscles which potentially play important roles in gait such as flexor hullucis longus, extensor digitorum longus and to superficial muscles which are subjected to crosstalk from neighboring such as rectus femoris, adductor magnus and peroneus longus.
14
Chapter 2
Background
Electromyography is the recording of electrical activity in the muscle regarded as ‘a valuable technique for studying human movement, evaluating mechanisms involving neuromuscular physiology, and diagnosing neuromuscular disorders’(Kamen & Gabriel, 2010; Robertson, Caldwel, Hamill, Kamen, & Whittlesey, 2013). This involves recording, processing, and displaying electromyographic signals. Electromyographic signal/electromyogram (EMG) is the name given to the total signal detected by a sensor. ‘The EMG signal is the algebraic summation of motor unit action potential trains from all active motor units within the pick-up area of the electrodes’ (International Society of Electrophysiological Kinesiology. Ad Hoc Committee, 1980). The EMG signal is generated wherever a muscle is activated, regardless of whether this is voluntary or involuntary (Robertson et al., 2013).
EMG is attractive in movement studies because it provides a window into physiological processes which cause a muscle to generate force and produce movement and behaviour. At this time, it remains one of our only direct windows into the neural codes that produce muscular contraction, force, and movement. EMG has been used for over 20 years now as an evaluation tool for medical research, rehabilitation, ergonomics and sport science.
2.1 Motor unit action potential
2.1.1Generation of muscle fibre action potential
15
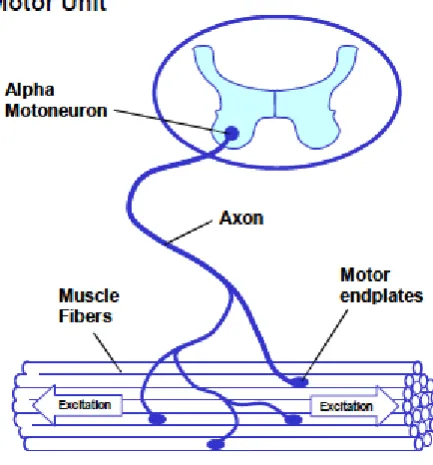
[image:34.595.195.412.247.480.2]along its axons. When this reaches a synaptic end bulb, it triggers a sequence of electrochemical events to release the neurotransmitter –acetylcholine (Ach). This chemical crosses the synaptic cleft, binding to the receptors situated in the motor end plate of the muscle which consists of Ach receptors. The activation of the Ach receptors causes an influx of sodium ions and efflux of potassium ions resulting in a depolarisation of the postsynaptic membrane and leading to an action potential.
Figure 2.1 Motor unit (Konrad, 2006)
16
Figure 2.2 The action potential (Konrad, 2006)
17
Figure 2.3 Depolarisation/repolarisation within excitable membrane (Konrad, 2006)
2.1.2 Propagation
The action potential arises at the motor end plate and, as well as triggering electromechanical couplings, propagates towards both sides of the fibres along the sarcoplasmic reticulum and transverse tubule for the deeper portion of the fibres. This allows the simultaneous activation and contraction of every part of the muscle fibres (Tortora & Derrickson, 2008). The longer axon of the motor neurons of certain muscle fibers may cause a slightly delayed activation in those fibers (Robertson et al., 2013).
2.1.3 Motor unit action potential
18
increases the strength of the contraction. Furthermore, the frequency of the activation, firing rate or motor unit discharge is controlled by the nervous system. The higher frequency produces a higher muscular force (Robertson et al., 2013).
Motor unit activation initiates muscular force. A force time response to an action potential is a twitch. It is relatively common for a motor unit to receive a number of action potentials, resulting in overlapping twitches (Enoka, 2008). The summation of these twitches at peak level results in a force plateau profile - a tetanus. The tetanus is unfused or incomplete when the activation rate is insufficiently high, resulting in oscillating forces around the average level. Moreover, doublets and synchronisation are the processes that can alter the muscular force. The doublets are two short bursts of motor unit activation before firing at a regular rate to generate a greater force than the usual two twitches (Clamann & Schelhorn, 1988). This strategy is used when considerable effort is required to initiate limb movement. Synchronisation is a process whereby more than one motor unit fires simultaneously. The EMG signal is the electrical summation of all of the active motor units in the detecting volume. The signal consists of both negative and positive components. The amplitude of the recorded EMG may reflect the intensity of the muscular contraction to some extent but the relationship between the amplitude of the recorded EMG and the muscular force is frequently non-linear (Solomonow, Baratta, Shoji, & D'ambrosia, 1990).
2.2 EMG acquisition
19
arrangement (single differential), two electrodes are placed on the muscles and a third neutral is grounded. The electrical difference between the two electrodes is amplified. The common signal from these electrodes is probably attenuated-common mode rejection. The recommended minimum common mode rejection ratio is 100 decibels (Robertson, 2004). The gained EMG output should be in the range of the analogue-digital converter.
2.2.1 Sensors
There are two main types of electrodes: surface or skin electrodes, and inserted (wire and needles) electrodes (Basmajian & De Luca, 1985). Surface sensors are widely used because they are non-invasive, cause minimal discomfort, and are reasonably reproducible (Jacobson, Gabel, & Brand, 1995a)(Figure2.4). Surface sensors record the EMG signals generated by a number of individual motor units within a large volume under the detection surface and therefore are prone to artefacts caused by the movement of the muscle’s innervation zone towards the detection volume during a dynamic contraction (Bogey, Perry, Bontrager, & Gronley, 2000; Rainoldi, Melchiorri, & Caruso, 2004).
a. b.
20
The surface sensor consists of the metal conducting surface connecting to the amplifier. The surface sensors can detect EMG signals generated from a number of individual motor units within the pick-up area of the detection surface. They are available in active and passive forms (Figure 1.4). The passive form consists of a detection surface which detects the current on the skin through its skin-electrical interface. The active form increases the input impedance, so it less sensitive to the impedance of the electrode and skin interface.
The passive form consists of a detection surface which detects the current on the skin through its skin-electrical interface. The removal of hair and the dead surface layer of the skin through light skin abrasion can lower the electric impedance (Tam & Webster, 1977).This can be done by using abrasive gel and cleaning with an alcohol wipe. Continuous pressure on sensors over the skin provided by adhesive strips or collars is also recommended (Basmajian & De Luca, 1985).
The application of a saline gel or paste on the electrode-skin interface also improves the detection of the electrical signal. At the metal-electrolyte junction, the chemical equilibrium may be altered by a number of factors; for example, changes in temperature, changes in electrolytes concentration of the paste or gel, relative movement of metal and the skin, and the flowing current. As a result, the polarization potential is altered. The utilisation of chloride with the metal sensor provides a reversible chloride exchange. This arrangement can diminish the polarisation potential which is associated with the sensors(Basmajian & De Luca, 1985).
21
types: resistively coupled or capacitively coupled to the skin (Basmajian & De Luca, 1985). The latter is not applicable to EMG application because of its poor reliability. When resistance is achieved in the order of 1012 ohm, an adequately large input impedance is achieved. The application of an active sensor is relatively convenient.
The disadvantages of both types of surface sensors include the susceptibility to crosstalk from adjacent muscles, and the inability to detect specific deep muscles. The surface sensor can effectively record the signal within a 10-20 mm distance from the surface layer (Barkhaus & Nandedkar, 1994; Fuglevand, Winter, Patla, & Stashuk, 1992).
Furthermore, the surface electrodes can be designed as an array depending on the specific research purpose, such as a longitudinal array. The array can consist of a grid of nine or more electrode surfaces to investigate the architectural features of the muscles (Thusneyapan & Zahalak, 1989).
22
Figure 2.5 Paired-hook wire sensor
Fine-wire sensors are implanted in the muscle of interest and only record from a small volume of muscle and therefore suffer less from crosstalk. This technique also enables the investigation of deep tissue (Bogey et al., 2000) and may be minimally affected by the movement of the muscle beneath the skin during a dynamic activity such as gait. However the signal from a small volume may not represent the activity of the entire muscle (Bogey et al., 2000).
Needle sensors of various designs incorporate unipolar or bipolar sensors into the hypodermic needle which remains in place for measurements. Modern manufacturing allows for very small inter sensor distances and hence very specific signal detection. They can be painful when walking and are highly sensitive to movement. The use of the needle sensor in gait analysis has not been found in this body of work.
2.2.2 Electrode placement
23
(Barr, Miller, & Chapin, 2010; Den Otter et al., 2004; Hof, Elzinga, Grimmius, & Halbertsma, 2002; Huber, Nueesch, Goepfert, Cattin, & Von Tscharner, 2011; Murley, Buldt, Trump, & Wickham, 2009; Nene, Byrne, & Hermens, 2004; Prosser, Stanley, Norman, Park, & Damiano, 2011) follow the SENIAM guidelines.
24
2.2.3 EMG signal processing and analysis
The standard guideline for reporting EMG data suggests that a frequency between 5Hz-500Hz contains most of the surface EMG power spectrum (Hermens & Merletti, 1999), so the data acquisition should cover the signals within that range.
The amplitude and frequency of the EMG signals are the common characteristics of interest. Muscle activation (force generation) is a result of a number of active motor units and the frequency of activations. A higher activation will thus result in an EMG signal with a higher amplitude (number of motor units) and more frequency components (frequency of activation). Conventional EMG analysis, through the signal processing described below, combines these two factors in determining the magnitude of the linear envelope.
a) Amplitude characteristics
25
b) Frequency characteristics
The frequencies in EMG signal can be described by turning points and zero crossing. This method counts the number of peaks per unit of time and the number of times that the signal crosses the zero level. The latter is correlated with the other frequency variables such as spectral analysis (Inbar, Allin, Paiss, & Kranz, 1986). The mean and median frequency or spectral analysis techniques are frequently used. A positive skewness with an approximated mean and median of 120 Hz and 100 Hz, respectively, is frequently found in surface recorded EMG (Robertson et al., 2013). Changes to these characteristics can be used to indicate the changes in the conduction characteristics of the muscle fibres.
Other common techniques include onset-offset analysis. The onset-offset technique determines the start and end points of muscle activation (Sutherland, 1984, 2001). Thus the EMG signal should not be filtered or processed, which may diminish the high frequencies content. Moreover, numerous techniques have been developed to analyse the EMG signal for specific purposes: recurrence quantification analysis (Filligoi & Felici, 1999), neural network classification(Liu, Herzog, & Savelberg, 1999), wavelet analysis (Karlsson, Yu, & Akay, 1999) as examples. However, in this work, only the time varying amplitude will be considered to be consistent with the other gait data such as kinematics and kinetics.
2.2.4 Normalisation
26
27
Chapter 3
Systematic review: Normative EMG profiles of lower
limb muscles during gait
Electromyography (EMG) is an essential tool in gait analysis for patients with motor disorders to indicate patterns of muscle activation (Kleissen et al., 1998).It is regarded as the direct method to identify the pattern of muscle activity resulting from neural stimulation and generating muscle contraction and force (Perry, 1992). Patients with motor disorders such as cerebral palsy and stroke frequently present with complex walking patterns and understanding the mechanisms of impairment, through the use of EMG to gain a window into neuromuscular control, can make an important contribution to identifying the best treatment.
28
Whilst it was assumed that robust normative reference data for EMG during healthy walking already exists, a preliminary scoping literature search found much less data than had been anticipated within the peer-reviewed literature and a lack of consensus on what constitutes normal EMG activity. Several studies provide a normative profile of EMG of individual lower limb muscles across the gait cycle but most have used small samples limiting confidence in between-subject variability. A smaller number describe between-session variability. Further there is considerable heterogeneity in data collection and analysis techniques across studies often without adequate justification for selection of methodologies e.g. (Kadaba et al., 1989; Lyons et al., 1983; Sutherland, 1984, 2001; Wootten et al., 1990; Yang & Winter, 1985). Whilst in the past it has been assumed that variation between different laboratories is inevitable there has been recent emphasis on standardizing clinical gait analysis provision to facilitate comparisons of data between different centres (Pinzone, Schwartz, Thomason, & Baker, 2014).
29
compounded by variability in how healthy participants are defined and the small sample sizes used in many studies.
The purpose of this chapter is thus to systematically review studies in the peer-reviewed literature which have reported normative lower limb EMG profiles during a gait cycle to 1) examine the level of the variability across studies, 2) synthesise EMG profiles from across studies to determine a normative EMG profile for muscles for which consensus exists and 3) identify muscles for which no such consensus exists and where further investigation is required.
3.1
Research questions
i) Does the level of between-subject variability between studies decrease according to the quality of reporting/quality?
ii) Is there a consensus on EMG profiles of lower limb muscle during gait and what is the between-subjects variability of them?
iii) What are required from further investigations?
3.2 Search method
30
3.3 Selection criteria
The aim was to identify studies that provide time varying series measurements of EMG from lower limb muscles, across the gait cycle, during straight walking at self-selected speed in groups of healthy individuals. To achieve this, studies were included if they fulfilled the following criteria:
3.3.1 Participants
Studies were included if they were on healthy adult humans. Where a single group of participants was described as healthy adults (mean age was between 18 and 60), the study was included. In order to fulfil the aims of synthesizing a normative database of healthy EMG profiles during walking, studies on athletes or persons with either medical conditions or abnormal walking patterns were excluded.
3.3.2 Study design
According to the aims of the review, the available normative EMG profiles should be synthesized from best possible studies during walking to minimize the influence of the heterogeneity of collection, analysis and reporting method, which might be expected to differ from studies which aimed to detect differences between conditions. Therefore only studies specifically designed to determine normative EMG patterns collected from the lower limb muscles during walking in straight line without perturbation/obstruction over ground or on a treadmill were included. Biomechanical modelling or computational modelling studies reporting modelled or estimated EMG data were excluded.
31
experimental manipulation of muscle activation or reflexes were also excluded as were those with a primary purpose of investigating nerve conduction or any similar use of EMG.
3.3.3 Outcome measure
Studies which reported time varying series of EMG amplitude, across the gait cycle, from any of the lower limb muscles, of which muscles crossing hip joint are regarded as upper limit of proximal muscles, were included.
3.4 Quality of measurement and study
32
and attached supplementary materials. This checklist was combined with a list of key study characteristics (Table 3.2) to form a single customised data extraction tool.
Table 3.1 Reporting quality scores
Note: Pre-SENIAM –the papers published before SENIAM and Post-SENIAM –the papers published after SENIAM
Questions Scores (%) Pre-SENIAM Post SENIAM Total
General reporting quality (n=10) (n=14) (n=24)
1 Were the participants ‘characteristics adequately described?
59 75 68
2 Did they define ‘healthy/normal’ subject? 70 86 79
EMG reporting quality
3 Were the sensors clearly described? 86 87 87
4 Was the location of the sensor adequately described? 10 71 46
5 Was the signal test for crosstalk carried out? 30 36 33
6 Was the detection mode and amplification adequately
described?
30 53 43
7 Was the filtering of the raw EMG specified? 47 57 53
8 Was method of analogue rectification described? 70 79 75
9 Was computer sampling adequately described? 55 50 52
10 Was EMG processing adequately described? 88 89 89
11 Was the walking speed stated? 50 100 79
12 Was elimination of gait initiation, turning, and gait termination considered?
70 71 71
Result reporting quality and validity
13 Were the graph clearly presented? 100 100 100
14 Was the sample sized justified? 0 14 8
15 Were the EMG result supported by the other
literature?
100 100 100
33
Table 3.2 Key study characteristics
Studies Year Acquisition
guideline Quality scores
Sample size Age range Sensors types
Normalisation Conditions Walking speed (m/s) Surface Fine-wire
Lyons 1983 Not mentioned 79% 11 25-34 - Maximal voluntary isometric contraction Floor 1
Yang 1985 Not mentioned 51% 11 18-33 - None Floor 1
Ericson 1986 Not mentioned 61% 10 20-32 - Maximal voluntary isometric contraction Floor 1
Arsenault 1986 Not mentioned 53% 8 16-33 - Maximal voluntary isometric contraction Floor 106 steps/min
Winter 1987 Not mentioned 61% 19 20-35 - Mean amplitude during gait cycle Floor 106 steps/min
Ounpuu 1989 Zipp 50% 10 18-33 - Mean isometric contraction Floor SSW
Pierotti 1991 Perotto and Delagi 61% 15 21-29 - Peak amplitude during a gait cycle Floor SSW
Ciccotti 1994 Not mentioned 42% 22 25-32 - Maximal voluntary isometric contraction Floor 2
Davis 1995 Not mentioned 66% 9 29-55 - Maximal voluntary isometric contraction Floor SSW
Olree 1995 Not mentioned 49% 10 21-40 - Peak amplitude during a gait cycle Floor SSW
Hof 2002 SENIAM 79% 20 19-25 - None Floor 1
Nene 2004 SENIAM 81% 5 22-33 Peak amplitude during a gait cycle at the
fastest speed
Floor 1
Clancy 2004 Not mentioned 58% 15 20-40 - No Treadmill 1
den otter 2004 SENIAM 70% 9 17-27 - Peak amplitude during a gait cycle at the
fastest speed
Treadmill 1
Warren 2004 Not mentioned 67% 19 20-38 - None Treadmill 1
Nymark 2005 Perotto and Delagi 74% 18 23-58 - Mean amplitude during a gait cycle Both 1
Chleboun 2007 Not mentioned 76% 9 20-26 - Peak amplitude during a gait cycle Treadmill 1
Murley 2009 SENIAM, Leis and Trapani 2000, Chapman et al 2006
78% 15 12-45 Maximal voluntary isometric contraction Floor 1
Barr 2010 SENIAM 86% 20 18-37 Maximal voluntary isometric contraction Floor 1
Bovi 2011 Not mentioned 43% 20 22-72 - Peak RMS value during the gait cycle Floor 1
Prosser 2011 SENIAM 75% 10 20-29 - None Both 1
Semciw 2013 Semciw et al 2012 76% 15 20-25 - Maximal voluntary isometric contraction Floor 1
Murley 2014 SENIAM 82% 30 18-30 Maximal voluntary isometric contraction Floor 1
Semciw 2014 Semciw et al 2012 72% 15 20-25 - Maximal voluntary isometric contraction Floor 1
Total 19 9
34
3.5 Identification of included studies and data extraction.
Titles and abstracts were assessed by a single reviewer (PO) and those that were obviously irrelevant excluded. Two reviewers (PO, KH) independently examined all remaining papers and selected those fulfilling the inclusion criteria. Any disagreements were identified and consensus agreed through discussion.
The same two reviewers also extracted information required for the review using the customized data extraction tool. Again, any disagreements were identified and consensus agreed through discussion.
3.6 Data analysis
EMG data in each included study were digitized by using the open source freeware WebPlotDigitizer (Version 2.5, 2012; http://arohatgi.info/WebPlotDigitizer). The digitised data were then interpolated with spline fills to 100 time intervals across the gait cycle using Matlab (Version 2009a, The MathWorks Inc., Natick, Massachusetts). A study published by Hof et al. (2002) contains both graphical data and an appendix containing the raw data values. This digitization process was thus tested by calculating the RMS difference over the gait cycle between data digitized from the graphs and the raw values. The result, 0.85% of peak amplitude, gave confidence in the use of this method of digitisation. Following digitization all time varying amplitudes were scaled as a percentage of their peak value (across the gait cycle). Combined mean with combined SD were calculated as described below.
35
identified studies were over-plotted on the same graph after normalization to their maximal amplitudes regardless of data acquisition, original normalization, walking on floor and treadmill, and data processing to enable comparison of EMG profiles between studies and quantify on their agreement.
In order to synthesize the normative EMG profiles for lower limb muscles, the muscles were grouped into 3 different categories based on their availability of reported standard deviation and number of included studies to allow examination of the variability. The categories are (1) those reported by multiple studies with between-subject variability, (2) those reported by a single study with subject variability and (3) those reported without between-subject variability.
All time varying amplitudes were normalised by their peak value. The grand mean, which was the mean amplitude of all normalised EMG signals, and grand standard deviation (SD) were calculated considering the number of participants included when they are available. The graph of grand mean amplitude with ±2SD grey areas for each sub-group for all studied muscles were plotted, in a similar format to standard kinematic and kinetic graphs in clinical gait assessment.
The grand mean, M, and standard deviation, SD, are given by
𝑀 =∑ 𝑛𝑖 𝑖𝑚𝑖
𝑁
𝑆𝐷 = √∑ ((𝑛𝑖 − 1)𝑠𝑖
2+ 𝑛
𝑖(𝑀 − 𝑚𝑖)2)
𝑖
𝑁 − 1
where ni is the number of observations in each sample with mean mi, standard deviation si
and
𝑁 = ∑ 𝑛𝑖
36
The SD was calculated from sifrom only the included studies which report SD whereas the mean was calculated from all studies. The graphs of grand mean amplitude with ±2SD grey areas were plotted for each muscle with lines of combined means from both sensors, similar to kinematic and kinetic graphs in clinical gait analysis. For each muscle, the averaged quality score and the averaged timing of peak with corresponding SD were calculated from that of all papers which reported data for that muscle. The contribution of each study to the combine mean was weighted according to the study’s sample size (also expressed as a percentage).
To examine the variability of EMG profiles, the averaged SD across the gait cycle was calculated. Then in order to determine whether the level of between-subject variability between studies decrease according to the quality of reporting/quality, only studies which had over 50% of quality score were included to synthesized the grand EMG profiles. This should allow identification of the highest quality data which can be used to derive/identify normative EMG profile from a consensus of the literature and identify the muscles which require further investigation (either a paucity of data or poor quality data).
3.7 Results
37
Figure 3.1 Diagram of paper identification
3.7.1 Study characteristics
38
details on EMG acquisition described in studies published after 1999 was more complete. Studies recruited an average of 14 participants (range 5-30 participants) with an averaged (±SD) age of 28 (±6) years and range of 15-72 years, weight of 70 (±6) kg and height of 176 (±5) cm. Approximately 80% (n=19, involving 273 participants) of identified papers employed surface sensors on the superficial muscles. The muscles most commonly investigated (in over 100 participants and at least 9 studies) are vastus lateralis, rectus femoris, medial gastrocnemius, soleus, tibialis anterior using surface sensors. There were only a relatively small number (n=9, involving 142 participants) of studies that used fine- wire sensors to investigate superficial and deep lower limb muscles. The muscles which were investigated by fine-wire sensors only were tibialis posterior, popliteus, tensor fascia latae, upper and lower compartments of gluteus maximus, anterior and posterior compartments of gluteus medius and glueteus minimus.
Some form of magnitude normalisation was employed in 19 studies in this review (Table 3.2). The denominators included maximal voluntary isometric contraction (MVC) (10 studies), mean amplitude during an isometric contraction (1 study), mean amplitude during a gait cycle(2 studies), peak amplitude (6 studies) during a gait cycle. 4 included studies reported speeds as cadence and “self-selected speed” without giving the actual speed. For those studies reporting speed, the average was 1.1 m/s but ranges from 0.83 m/s-1.50 m/s. Only 5 studies examined walking on a treadmill as opposed to over ground.
3.7.2 EMG profiles and variability
Due to the availability of reported between-subject variability of EMG profiles from different studies, the grand EMG profiles were allocated to one of three groups:
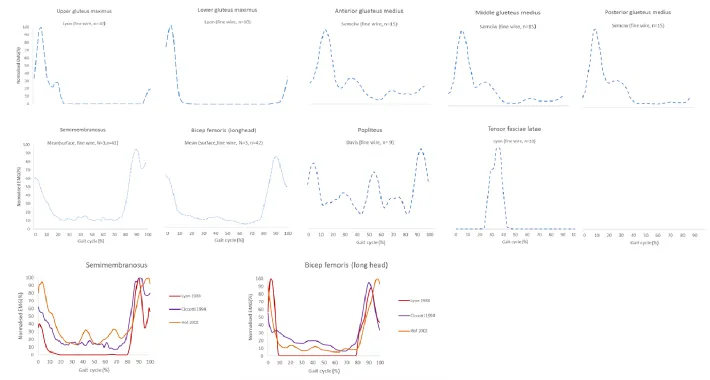
39
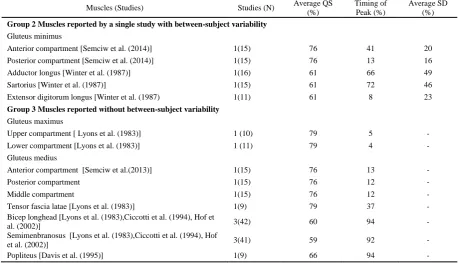
(2) those reported by a single study with between-subject variability (n=5) and (3) those reported without between-subject variability (n= 9) (Table 3.5)
Group 1: Muscles reported by multiple studies with between-subject variability
Table 3.3 and 3.4 describe the variability in the pooled data from across all included studies of the 16 muscles from Group 1 and shows how this is affected if studies with lower quality scores (quality score<50%) are excluded. This decreases the variability (SD) substantially in some clinically important muscles (by between a quarter and a fifth for gluteus medius, lateral hamstrings, soleus and tibialis anterior) with little effect on most muscles and just three (adductor magnus, lateral gastrocnemius and peroneus longus) showing slight increases (1-2%). Excluding the lower quality studies affected the timing of peak activity but generally by a small amount (1-5%). In two muscles (vastus medialis and bicep femoris), the SD of Arsenault et al. (1986) was large because of the method of normalization used, so this study was removed from the grand mean to prevent misinterpretation as between-subject variability.
40
Table 3.3 Analysis table for reported muscle Group 1
Muscles (studies) With all included studies Without studies with QS < 50%
Studies (N) Average QS (%) Timing of Peak (%) Average SD(%) Studies (N) Average QS (%) Timing of Peak (%) Average SD(%) Gluteus maximus
[Ericson et al. (1986),Winter et al. (1987),Olree et al. (1995),Hof et al. (2002),Bovi et al. (2011)]
5(65) 56 5(2) 35 3(35) 65 6(1) 28
Gluteus medius
[Lyons et al. (1983),Ericson et al. (1986),Winter et al. (1987),Olree et al. (1995), Hof et al. (2002)]
5(56) 56 8(2) 25 4(46) 65 8(2) 22
Adductor magnus
[Lyons et al. (1983),Winter et al. (1987),Olree et al. (1995), Hof et al. (2002)]
4(40) 66 27(33) 40 3(30) 72 29(38) 41
Medial hamstring
[Ericson et al. (1986), Winter et al. (1987), Ounpuu et al. (1989), Nymark et al. (2005)]
4(39) 67 94(2) 28 - - - -
Lateral hamstring
[Olree et al. (1995), Winter et al. (1987), Yang et al. (1984)]
3(48) 54 98(7) 26 2(28) 57 3(0) 25
Semitendinosus
[Pierotti et al. (1991), Hof et al. (2002),Den et al. (2004), Prosser et al. (2011)]
3(39) 76 91(2) 25 - - - -
Bicep femoris
[ Bovi et al. (2011), Den et al. (2004), Ericson et al. (1986)]
3 (39) 54 99(5) 21 2(19) 65 3(9) -
Vastus lateralis
[Yang et al. (1985),Ericson et al. (1986), Winter et al. (1987), Ounpuu et al. (1989), Ciccotti et al. (1994), Hof et al. (2002), Nene et al. (2004),Nymark et al. (2005),Chleboun et al. (2007),Barr et al. (2010)]
10(127) 65 6(4) 21 9(105) 66 6(3) 21
Vastus medialis
[Ericson et al. (1986), Ciccotti et al. (1994), Hof et al. (2002), Den et al. (2004), Bovi et al. (2011)]
5(70) 53 3(3) 39 3(28) 70 6(0) -
Rectus femoris
[Yang et al. (1985),Arsenault et al. (1986), Ericson et al. (1986), Winter et al. (1987), Ounpuu et al. (1989), Pierotti et al. (1991),Ciccotti et al. (1994), Olree et al. (1995), Hof et al. (2002), Den et al. (2004),Nene et al. (2004),Nymark et al. (2005), Barr et al. (2010),Bovi et al. (2011), Prosser et al. (2011)]
15(183) 62 13(18) 35 12(131 )
69 16(20) 34
Lataral gastrocnemius
[]Clancy et al. (2004),Ericson et al. (1986), Olree et al. (1995), Hof et al. (2002),Winter et al. (1987)]
5(54) 61 43(2) 24 4(44) 61 44(2) 26
Medial gastrocnemius
[Ericson et al. (1986),Winter et al. (1987), Ciccotti et al. (1994),Hof et al. (2002), Den et al. (2004),Warren et al. (2004),Nymark et al. (2005),Murley et al. (2009),Bovi et al. (2011), Murley et al, (2014)]
10(171) 66 42(3) 25 8(129) 73 42(3) 25
Soleus
[Yang et al. (1985),Arsenault et al. (1986), Ericson et al. (1986), Winter et al. (1987), Ounpuu et al. (1989), Ciccotti et al. (1994), Hof et al. (2002), Den et al. (2004), Bovi et al. (2011)]
9(119) 54 37(8) 21 7(77) 58 46(3) 16
Tibialis anterior
[Yang et al. (1985),Arsenault et al. (1986), Ericson et al. (1986), Winter et al. (1987), Ciccotti et al. (1994), Olree et al. (1995), Hof et al. (2002), Den et al. (2004) Warren et al. (2004), Nymark et al. (2005), Chleboun et al. (2007), Murley et al. (2009), Bovi et al. (2011)),Murley et al, (2014)]
14(201) 64 100(9) 27 11(149 )
69 100(10) 24
Tibialis posterior
[ Murley et al. (2009),Murley et al, (2014)]
2(42) 81 8(3) 30 - - - -
Peroneus longus
[Winter et al. (1987), Hof et al. (2002), Den et al. (2004), Murley et al. (2009), Bovi et al. (2011), Murley et al, (2014)]