International Journal of Emerging Technology and Advanced Engineering
Website: www.ijetae.com (ISSN 2250-2459,ISO 9001:2008 Certified Journal, Volume 5, Issue 5, May 2015)
186
Comparative Analysis of Different MPPT Algorithms for
Photovoltaic Application
Akhilesh Kumar Gupta
1, Prabhat Kumar
2Department of Electrical Engineering, Arya College of Engineering and Information Technology, Jaipur, Rajasthan, India
Abstract— Photo voltaic based distributed generation system has seen a wide spread interest in research community because of growing energy needs. For efficient distributed generation system, a PV cell is connected with a DC-DC converter and DC-AC inverter. Maximum power point tracking (MPPT) algorithm is used to extract maximum power from the PV cell. There are different MPPT algorithms such as perturb and observe algorithm and incremental conductance algorithm. This paper provides a comparative analysis of different MPPT algorithm.
Keywords—MPPT, PV cell, DC-DC Converter I. INTRODUCTION
The rising energy need of human being has forced the mankind to look for alternate energy sources. Therefore, there is a significant research is going on in renewable energy sources. Renewable energy sources such as PV, fuel cell and wind energy has been widely studied. Grid integration of renewable energy sources and development of standalone application for renewable energy sources has been widely studied areas in electrical engineering.
There are significant research works towards sustainable energy. A comparative study of different MPPTs used in photovoltaic power system is reviewed in [1-3]. Development of different control algorithms for photovoltaic power system is discussed in [4-8]. Analog MPPT technique for distributed PV application has been discussed in [4]. Single stage grid connected inverter for PV application with a single current sensor has been discussed in [5]. Adaptive auto tuned MPPT for PV application with FPGA based real time application has been discussed in [6]. Partial shading of PV array using colony of flashing fireflies has been discussed in [8].
Not only in photovoltaic systems have other renewable energy system such as fuel cell found widespread application in generation of green energy. During rapid load changes there is a significant change in output energy therefore; research has been carried out to study the changes in voltage during rapid change in load profile [9]. Control and grid interfacing of solid oxide fuel cell has been discussed in [10]. FPGA based real time implementation of DC-DC converter connected to solid oxide fuel cell has been discussed in [11].
This paper provides a detailed comparison of two of the most widely used MPPT algorithms i.e P&O MPPT and incremental conductance MPPT. Extensive simulation of PV cell and MPPT algorithm has been discussed. MPPT with DC-DC boost converter is analyzed in this paper.
This paper consists of seven sections. Section II comprises of discussion about PV system for distributed generation system. Section III provides mathematical model of different PV cells. Section IV presents different MPPT algorithm. Section VI provides modeling of boost converter with PV cell. Section VI comprises of simulation results and Section VII concludes the paper.
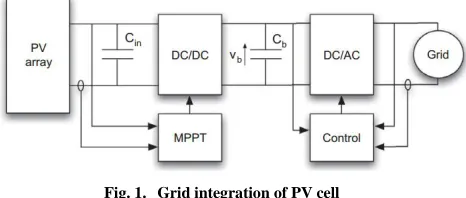
[image:1.612.333.566.513.612.2]II. PVSYSTEM FOR DISTRIBUTED GENERATION Fig. 1 shows the grid integration of PV array. PV array provides a low voltage unregulated DC voltage which has to be converted in to utility AC voltage. DC-DC converter is used for regulating unregulated voltage of PV array and is used to step up the voltage to a certain level. Maximum power point technique (MPPT) is used to extract maximum power from the PV array. There are several well-known MPPT algorithms. DC-AC inverter is used to invert the voltage and feed it to the utility grid. Feedback control of converter and inverter is used for proper grid integration.
Fig. 1. Grid integration of PV cell
International Journal of Emerging Technology and Advanced Engineering
Website: www.ijetae.com (ISSN 2250-2459,ISO 9001:2008 Certified Journal, Volume 5, Issue 5, May 2015)
187 Fig. 2. Equivalent circuit diagram of PV cell
The current of the PV cell can be represented as,
L D sh
I
I
I
I
(1)Here IL is the current generated by the light, ID is diode current and Ish is the shunt current.
Diode current ID can be expressed using Shockley equation such as
1
d qV nkT
D o
I
I
e
(2)The shunt current is defined as sh s
sh
V
IR
I
R
(3)Substituting the values in eq(1),
1
d qV
s nkT
L o
sh
V
IR
I
I
I
e
R
(4)IV. MAXIMUM POWER POINT TRACKING
MPPT is a method that compensates for changing voltage and current characteristic of solar panel and maximum utilization of solar energy from panel. Maximum power point tracking, or MPPT, is the automatic adjustment of the load of a photovoltaic system to achieve the maximum possible power output. PV cells have a complex relationship between current, voltage, and output power, which produces a non-linear output. This output is expressed as the current-voltage characteristic of the PV cell. Constant fluctuations in external variables such as temperature, irradiance, and shading cause constant shifts of the I-V curve upwards and downwards. A change in temperature will have an inversely proportional effect on output voltage, and a change in irradiance will have a proportional affect on output current.
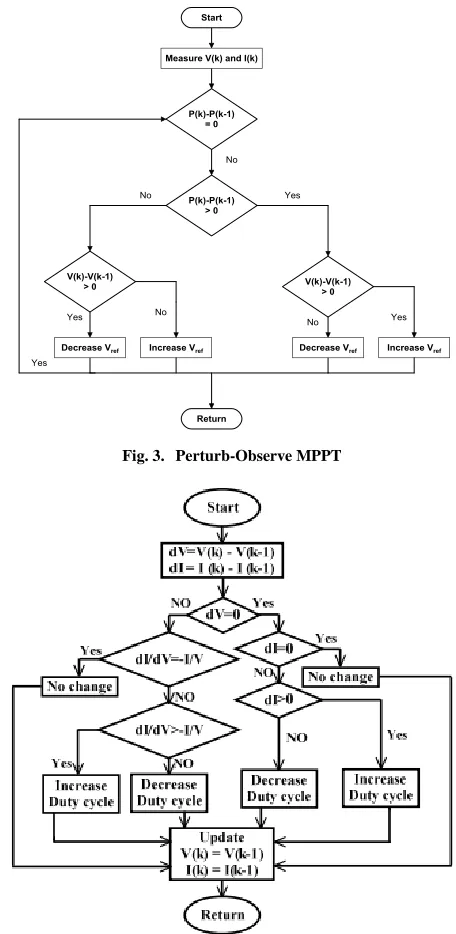
[image:2.612.65.560.131.645.2]Figure 3 shows the block diagram representation of pertrub and observe MPPT and figure 4 shows the block diagram of incremental conducatance MPPT. Figure 5 shows MPPT with reference voltage control.
Fig. 3. Perturb-Observe MPPT
[image:2.612.328.556.171.638.2]International Journal of Emerging Technology and Advanced Engineering
Website: www.ijetae.com (ISSN 2250-2459,ISO 9001:2008 Certified Journal, Volume 5, Issue 5, May 2015)
[image:3.612.322.544.289.506.2]188 Fig. 5. Block diagram of MPPT with reference voltage control
V. DC-DCBOOST CONVERTER
[image:3.612.61.285.295.401.2]DC-DC boost converter regulates and steps up the unregulated voltage of PV cell. Figure 6 shows boost converter with PV cell.
Fig. 6. Boost Converter with PV cell
In this paper, state space avergae model of boost converter is used to model the boost converter. In state space average model, the dynamics of the converter changes with the instantaneous change in status of the switch i.e S = ON or S = OFF. The state space representation of system when S = ON is represented by
1 1 1 1 1
1 1 1 1 1
x
A x
B u
y
C x
D u
(5)Here the state variables are L
c
I
x
V
When S = ON, the state space representation of boost converter is represented as
1
0
0
1
0
A
RC
11
0
B
L
10
1
1
0
C
When S = OFF, the state space representation of boost converter is represented as 2 2 2 2 2
2 2 2 2 2
x
A x
B u
y
C x
D u
(6)2
1
0
1
1
L
A
C
RC
21
0
B
L
20
1
1
0
C
The state space representation of boost converter is shown by combining the two stages. It can be represented as
x
Ax
Bu
y
Cx
Du
1 2 1 2 1 2 1 21
1
1
1
A
A d
d A
B
B d
d B
C
C d
d C
D
D d
d D
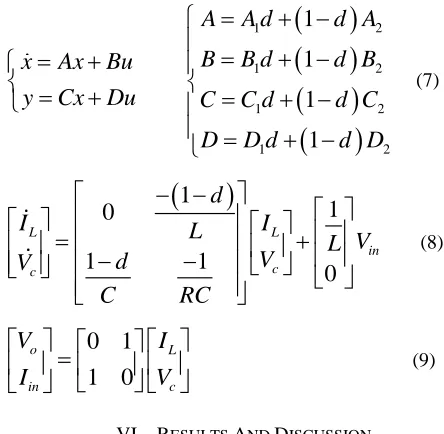
(7)
1
1
0
1
1
0
L L in c cd
I
L
I
V
L
V
d
V
C
RC
(8)0
1
1
0
o L c inV
I
V
I
(9)VI. RESULTS AND DISCUSSION
This section shows the simulation results obtained from MATLAB-Simulink.
A. PV Cell characteristics
International Journal of Emerging Technology and Advanced Engineering
Website: www.ijetae.com (ISSN 2250-2459,ISO 9001:2008 Certified Journal, Volume 5, Issue 5, May 2015)
189
0 5 10 15 20 25 30 35 40 45 50
0 2 4 6 8 10 12 14 16 18 20
Voltage in volt
C
u
rr
e
n
t
in
a
m
p
100 W/m2 80 W/m2
[image:4.612.63.285.130.308.2]60 W/m2 40 W/m2 20 W/m2
Fig. 7. Voltage and current characterisitcs of PV cell
The power and voltage of PV cell i.e P-V characteristics of PV cell with varying irradiance level is shown in Figure 8. Power and current of PV cell i.e P-I characterisitics of PV cell with varying irradiance level is shown in Figure 9.
0 5 10 15 20 25 30 35 40 45 50
0 50 100 150 200 250 300 350 400
Voltage in volt
P
o
w
e
r
in
w
a
tt
100 W/m2 80 W/m2
[image:4.612.330.554.133.308.2]60 W/m2 40 W/m2 20 W/m2
Fig. 8. Voltage and Power characterisitcs of PV cell
0 2 4 6 8 10 12 14 16
0 50 100 150 200 250 300 350 400
Current in amp
P
o
w
e
r
in
w
a
tt
Fig. 9. Power and current characterisitcs of PV cell
B. MPPT
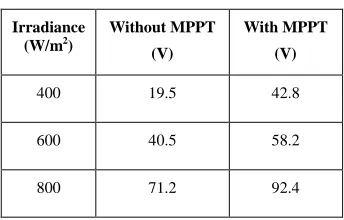
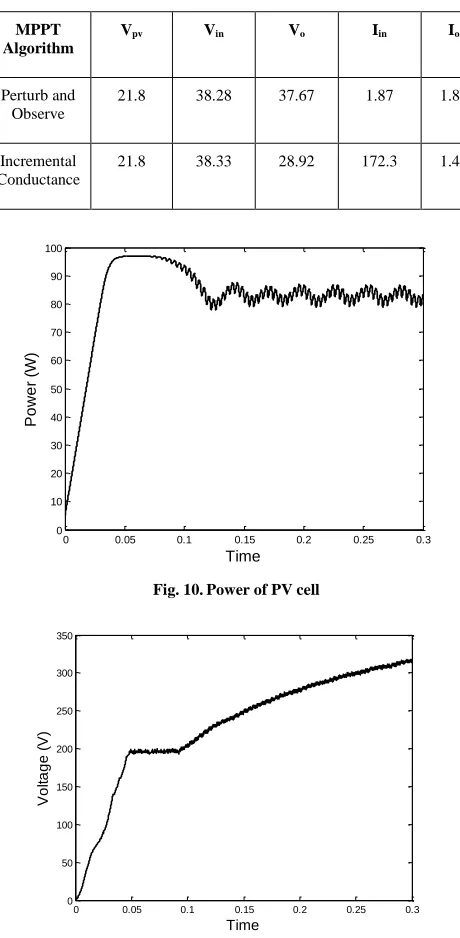
MPPT plays a vital role in PV cell as it calculates the point where maximum power from the PV cell is obtained. Table I provides a comparative analysis of output voltage of PV cell with and without MPPT technique. Table II provides a comparative analysis of two MPPT techniques i.e P&O method and incremental conductance method. Figure 10 and Figure 11 shows the voltage of MPPT and boost converter repsectively. The boost converter steps up the voltage output of PV-MPPT which is evident from the graph.
TABLE I:
PV cell with and without MPPT
Irradiance (W/m2)
Without MPPT
(V)
With MPPT
(V)
400 19.5 42.8
600 40.5 58.2
[image:4.612.58.280.393.567.2] [image:4.612.358.530.486.596.2]International Journal of Emerging Technology and Advanced Engineering
Website: www.ijetae.com (ISSN 2250-2459,ISO 9001:2008 Certified Journal, Volume 5, Issue 5, May 2015)
190 TABLE II:
Comparision of different MPPT techniques
MPPT Algorithm
Vpv Vin Vo Iin Io
Perturb and Observe
21.8 38.28 37.67 1.87 1.87
Incremental Conductance
21.8 38.33 28.92 172.3 1.48
0 0.05 0.1 0.15 0.2 0.25 0.3
0 10 20 30 40 50 60 70 80 90 100
Time
P
o
w
e
r
[image:5.612.50.280.139.608.2](W)
Fig. 10.Power of PV cell
0 0.05 0.1 0.15 0.2 0.25 0.3
0 50 100 150 200 250 300 350
Time
V
o
lt
a
g
e
(
V
)
Fig. 11.Output voltage of boost converter
VII. CONCLUSION
This paper provides a detailed discussion about two of the most widely used MPPT techniques of PV cell i.e P&O method and incremental conductance method.
The MPPT controller is accompanied by DC-DC boost converter which steps up the unregulated voltage to a certain voltage. Extensive simulation results are obtained and discussed.
REFERENCES
[1] Bidyadhar Subudhi, Raseswari Pradhan, “A comparative study on maximum power point tracking techniques for photovolatic power systems,” IEEE Transactions on Sustainable Energy, vol. 4, no. 1, 2013, pp. 89-98.
[2] Boualem Bendib, Hocine Belmili, Fateh Krim, “A survey of the most used MPPT methods: Conventional and advanced algorithms applied for photovolatic systems,” Renewable and Sustianable Energy Reviews, vol. 45, May 2015, pp. 637-648.
[3] Hegazy Rezk, Ali M. Eltamaly, “A comparative comparision of different MPPT techniques for photovoltaic systems,” Solar Energy, vol. 112, Feb 2015, pp. 1-15.
[4] Giovanni Petrone, Giovanni Spagnuolo, and Massimo Vitelli, “An Analog Technique for Distributed MPPT PV Applications,” IEEE Transactions on Industial Electronics, Vol. 59, No. 12, Dec 2012, pp. 4713-4722.
[5] Hiren Patel and Vivek Agarwal, “MPPT Scheme for a PV-Fed Single-Phase Single-Stage Grid-Connected Inverter Operating in CCM With Only One Current Sensor,” IEEE Transactions on Energy Conversion, vol. 24, no. 1, Mar 2009, pp. 256-263.
[6] Raseswari Pradhan, Bidyadhar Subudhi, “Design and real-time implementation of a new auto-tuned adaptive MPPT control for a photovoltaic system,” International Journal of Electric Power and Energy Systems, vol. 64, Jan 2015, pp. 792-803.
[7] Venkata Ratnam Kolluru, Kamalakanta Mahapatra and Bidyadhar Subudhi, “Development and Implementation of Control Algorithms For a Photovoltaic System,” in Proc. IEEE Students Conf. Engineering and Systems, 2013, pp. 1-5.
[8] Kinattingal Sundareswaran, Sankar Peddapati, and Sankaran Palani, “MPPT of PV Systems Under Partial Shaded Conditions Through a Colony of Flashing Fireflies,” IEEE Transactions on Energy Conversion, vol. 29, no. 2, June 2014, pp. 463-471.
[9] Subhransu Padhee, Umesh Chandra Pati, Kamalakanta Mahapatra, “Investigation on transient response of fuel cell power conditioning unit during rapid load changes,” in Proc. IEEE Conf. Computational Intelligence and Communication Technology, 2015, pp. 482-487. [10] Kanhu Charan Bhuyan, Rajesh Kumar Patjoshi, Subhransu Padhee,
Kamalakanta Mahapatra, “Solid oxide fuel cell with DC-DC converter system: Control and grid interfacing,” WSEAS Transactions on Systems and Control, 9, 2014, pp. 247-254. [11] Kanhu Charan Bhuyan, Sumit Sao and Kamalakanta Mahapatra, “An
FPGA based controller for a SOFC DC-DC power system,” Advances in Power Electronics, 2013.
[12] Kanhu Charan Bhuyan, Subhransu Padhee, Rajesh Kumar Patjoshi,