International Journal of Emerging Technology and Advanced Engineering
Website: www.ijetae.com (ISSN 2250-2459, ISO 9001:2008 Certified Journal, Volume 7, Issue 6, June 2017)
100
Performance Analysis of Cloud Computing Environment using
PI
3
Performance Model
Vivek Thapar
1, Dr. O. P. Gupta
21Ph.D. Research Scholar, I.K.G. Punjab Technical University, Kapurthala, Punjab, India.
2Associate Professor and Head, School of Electrical Engg. & Information Technology, PAU, Ludhiana, Punjab, India.
Abstract-- Software as a service (SaaS) cloud service is gaining popularity to deliver services to clients by using mobile application (App). Mobile Apps are created for the different operating environment of smart-phones like Android based or i-phone based etc. and are stored in a play store. The client or user downloads the App from the play store and starts interacting with the resources of cloud service provider (CSP) by using the mobile App. The App execution engine needs to be placed at a particular datacenter location of the CSP for improving the performance of the SaaS cloud environment. The placement of App execution engine at an optimal datacenter location plays a very important role in deciding the overall performance of the cloud. In this article, we would analyze the performance of SaaS cloud environment using PI3 performance model. The PI3 performance model classifies the SaaS cloud environment into four types: Prodigal, Ideal, Impoverished, and Inefficient. This model is used to test the performance of SaaS cloud environment by changing the placement of App execution engine at various datacenters locations of the CSP. It uses two performance metrics cost and response time to decide the placement of cloud performance in the cloud grid of PI3 model. The results obtained are then analyzed to find the optimal solution.
Keywords-- Cloud performance analysis, SaaS, PI3 performance model, CloudAnalyst.
I. INTRODUCTION
Cloud computing is a revolutionary technology in the field of computing. This technology is enshrined in the idea of John McCarthy that computing might be used one day as a public utility. The idea of computing as a public utility propounded in 1961 seems to be a reality in today’s world. People are using smart-phones and electronic gadgets to access the computing power of giant cloud service providers like Google, Facebook, and WhatsApp etc. The easy access to internet technology at very competitive prices has fuelled the engine of cloud computing. The phenomenal growth of Internet users and advancement in mobile technology has laid the solid foundation for the growth and success of cloud technology. The number of internet users has grown manifold from 16 million in December 1995 to 3,731 million in March 2017 [1].
Novel techniques and tools are required to handle a large amount of data and the computing needs of ever increasing users on the internet. Cloud computing emerges as a solution to this problem. Cloud services are offered to clients in three flavors: IaaS (Infrastructure as a Service), PaaS (Platform as a Service), and SaaS (Software as a Service). In IaaS service model, infrastructure in the form of virtual resources is offered to clients on a subscription basis. The client can procure the resources as per requirement and can dynamically increase or decrease the resources as per requirement. The IaaS CSPs offer various subscription plans to clients. The clients can opt for the most suitable plan as per requirement and can scale up and down the plan as the need arises. CSPs like Microsoft Azure, Amazon EC2, and IBM Smart Cloud offer IaaS service to clients. Under PaaS service model, application development framework in the form of software tools and resources is offered to clients on a rental basis to develop applications. The clients can develop the applications compatible for cloud computing using the resources and can upload the application at the CSPs platform. Google cloud platform is a major giant CSP offering PaaS service to clients. In SaaS service model, software or application is offered to the client on a subscription basis. The client downloads the mobile App on electronic gadget or smart-phone and uses the application of the CSP to interact with the resources of CSP. SaaS service model of the cloud has gained momentum in the previous time due to its ever increasing usage to deliver service to clients. Facebook, WhatsApp, and Twitter are some of the major SaaS service providers.
International Journal of Emerging Technology and Advanced Engineering
Website: www.ijetae.com (ISSN 2250-2459, ISO 9001:2008 Certified Journal, Volume 7, Issue 6, June 2017)
101
In this context, a SaaS performance model PI3 (Prodigal, Ideal, Impoverished, and Inefficient)[2] is proposedfor the placement of App execution engine at a specific datacenter of the CSP. The performance model classifies the performance of SaaS cloud in four categories: Prodigal, Ideal, Impoverished, and Inefficient. In this research article, we would use PI3 to analyze the performance of the SaaS cloud. We would place the cloud performance in the cloud grid of the PI3 model. The rest of the paper is organized as follows: In section II, literature is reviewed in the context of cloud performance and cloud performance modeling. In section III, the PI3 performance model is discussed. In section IV, performance analysis of SaaS cloud is done using the PI3 performance model. In section V, results are analyzed and discussed. Finally, in section VI conclusion and future scope are listed.
II. LITERATURE REVIEW
In this section, we would explore the literature in the context of performance modeling and simulation of cloud computing environment. A lot of research has been done on performance analysis of cloud computing environment which is discussed below.
In [3] authors have analyzed the performance of scientific computing workload on four commercial cloud computing service providers. First, they found the presence of scientific computing workloads of Many-Task Computing (MTC) users. They empirically evaluate the performance of scientific workload on Amazon EC2. The results indicate that the current cloud service providers need a phenomenal improvement to serve the needs of the scientific community. They also indicate which improvements CSPs need to address first to serve scientific researchers.
In [4] authors have proposed a performance analysis model for Big Data applications and integrate it with software quality concepts. They employ statistical techniques to establish a relationship between extracted performance measures from Big Data applications, cloud computing platforms, and software engineering quality concepts.
In [5] authors have discussed various simulation and modeling tools for distributed systems. They explore that cloud applications have different requirements in terms of memory, storage, bandwidth, and computation. Simulation tools can be used to test the cloud application requirements before actual deployment of the cloud application in the real cloud environment. They also found some new requirements that current simulation tools should possess to address the issue of cloud applications performance evaluation and analysis.
In [6] authors have proposed a tool for SaaS application testing. The proposed tool tests the performance and scalability of SaaS application. The proposed tool Cloud-based Testing as a Service (CTaaaS) evaluates the performance of SaaS application before actual deployment in the real cloud environment. They also explained the design and implementation aspects of the tool.
In [7] authors have explored that in the multitenant cloud environment, tenants have different Quality of Service (QoS) requirements. These QoS requirements need to be satisfied keeping in view the cost and response time of the application. A novel QoS-driven approach is proposed for helping developers of SaaS application and the proposed approach is tested using an example SaaS synthetically generated dataset based on real world web service.
In [8] authors have discussed the issues and challenges in the performance evaluation of cloud computing environment. They provide an overall perspective on cloud evaluation and highlight it with the help of simulation. They discuss major factors in cloud performance evaluation and analyze the performance of the cloud environment using simulation tools by considering all these factors.
In [9] authors have proposed a generic cloud performance model for IaaS, PaaS, SaaS, and hybrid clouds. They also propose new performance metrics. They conduct benchmark experiments on IaaS cloud by scaling-up and scaling-down the workload. They perform their experimentation on Amazon EC2 cloud platform. They found that automatic scaling is easy to implement but it leads to over-provisioning of resources.
In [10] authors have proposed a novel methodology for evaluating the trust and reputation of cloud providers. They have collected the comments of the clients and classify the real comments of the people from unreal and incorrect comments. They name real comments of the opinion leaders as recommendations and unreal comments as troll entities. Based on the data collected on recommendations of the opinion leaders, they calculate the trust and reputation factor of cloud service providers on five parameters reliability, availability, data integrity, identity, and capability. They also propose a methodology for the identification of opinion leaders from troll entities by using three topological metrics, input-degree, output-degree and reputation measures.
International Journal of Emerging Technology and Advanced Engineering
Website: www.ijetae.com (ISSN 2250-2459, ISO 9001:2008 Certified Journal, Volume 7, Issue 6, June 2017)
102
The proposed model can be used by cloud service providers to dimension the cloud resources in order to fulfill the service level agreements with the clients.
In [12] authors have evaluated the performance of High- Performance Computing (HPC) applications on Amazon EC2 cluster computer platform. They have analyzed the main performance bottlenecks of HPC applications on Amazon EC2 platform.
In [13] authors have proposed a new formal graphic model and metrics to evaluate SaaS performance and analyze the system scalability aspect. The proposed model and metrics are employed to evaluate the performance of SaaS application and the results produced are discussed
Most of the work in performance analysis of cloud computing environment has been focused on testing scientific computing application workloads on real cloud environments, SaaS application testing before actual deployment of SaaS application in real cloud environment, performance analysis of cloud datacenters, the ranking of IaaS service providers, and testing big data applications on the cloud environment. To the best of our knowledge, performance analysis of SaaS cloud environment is less explored and hence needs attention. SaaS cloud environment is a large and complex environment. This article would focus on performance analysis of SaaS cloud using PI3 performance model, simulation tools, and modeling techniques.
III. PI3PERFORMANCE MODEL[2]
The PI3 performance model [2] for SaaS cloud is also called cloud grid. It classifies the performance of SaaS cloud into four categories namely Prodigal, Ideal, Impoverished, and Inefficient. Figure 1.below shows the PI3 performance model of SaaS cloud. The model is crafted using two important performance metrics, response time and cost. The response time is also called round-trip time. It is the time elapsed between sending the request by the user and receiving the reply back by the user. Response time is measured in milliseconds (ms). Low response time is desirable for cloud performance. On the other hand, the cost performance metric evaluates the cost of providing services to the clients. The cost is evaluated on the basis of the usage of virtual machines to provide services to the users.
The ideal cloud grid encompasses the ideal cloud environment. In this ideal grid response time and cost varies from 0 to 5 units i.e. the grid corresponding to (0,0) and (5,5) is the ideal grid. The ideal cloud environment is characterized by low response time and low cost. The clients get excellent response time at a low cost. The cloud performance would be ideal if it falls in the grid corresponding to the ideal grid. The prodigal cloud grid
from (0,5) to (5,10) encompass the prodigal cloud environment. Under this category, though the response time is low, the cost of providing cloud services is high. Due to the high cost of providing services to clients, this cloud needs optimization in terms of cost. High cost can be due to the availability of more resources as compared to the number of users in the cloud environment. The
impoverished cloud grid from (5,5) to (10,5) defines the impoverished cloud environment. This type of cloud environment is characterized by low cost and high response time. i.e. the clients would get low performance. This type of cloud environment needs optimization in terms of response time. Low performance can be due to the non availability of cloud resources in proportion to the number of users in the cloud environment. It can be improved by adding more resources to the cloud environment and using appropriate resource scheduling algorithms to allocate resources to the clients. The area corresponding to (5,5) to (10,10) defines the inefficient cloud grid. The inefficient cloud environment is characterized by high response time and high cost i.e. users will get the low performance by paying more. The efficiency of such a cloud environment is low and can be improved by using appropriate resource scheduling algorithms and optimization of resources. The performance model also defines a middle environment.
International Journal of Emerging Technology and Advanced Engineering
Website: www.ijetae.com (ISSN 2250-2459, ISO 9001:2008 Certified Journal, Volume 7, Issue 6, June 2017)
[image:4.612.64.541.150.437.2]103
Figure 1: PI3 (π3) (Cloud Grid) Performance Model of SaaS Cloud Environment [2]
IV. PERFORMANCE ANALYSIS OF CLOUD ENVIRONMENT
USING PI3PERFORMANCE MODEL
In this section, we would analyze the performance of SaaS application placed on the datacenter of Amazon EC2 cloud. In [14], authors have proposed an effective framework for finding similar cases of dengue from audio and text data using domain thesaurus and case-based reasoning. An application can be used to collect users personal and health information. The information provided by the users is then used to find similar patients suffering from dengue by matching it with the database consisting of two million case bases of dengue.
International Journal of Emerging Technology and Advanced Engineering
Website: www.ijetae.com (ISSN 2250-2459, ISO 9001:2008 Certified Journal, Volume 7, Issue 6, June 2017)
[image:5.612.94.520.157.431.2] [image:5.612.97.517.159.428.2]104
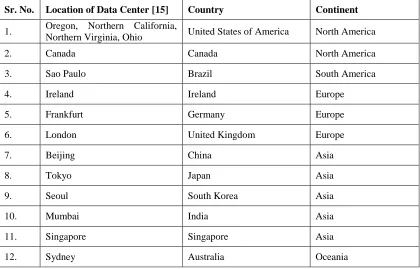
Table 1:Location of Data Centers of Amazon EC2
Sr. No. Location of Data Center [15] Country Continent
1. Oregon, Northern California,
Northern Virginia, Ohio United States of America North America 2. Canada Canada North America 3. Sao Paulo Brazil South America 4. Ireland Ireland Europe 5. Frankfurt Germany Europe 6. London United Kingdom Europe
7. Beijing China Asia
8. Tokyo Japan Asia
9. Seoul South Korea Asia
10. Mumbai India Asia
11. Singapore Singapore Asia 12. Sydney Australia Oceania
The internet latency is the delay added by the internet to user requests. Internet latency is a dynamic entity and it keeps on varying with the passage of time.
[image:5.612.44.570.497.678.2]Table 2 [16] provides the Internet latency data pertaining to different continents of the world.
Table 2:
Internet Latency Matrix (in milliseconds)[16]
Region Id / Region
0 1 2 3 4 5
North America South America Europe Asia Africa Oceania
0 North America 25 100 150 250 250 100
1 South America 100 25 250 500 350 200
2 Europe 150 250 25 150 150 200
3 Asia 250 500 150 25 500 500
4 Africa 250 350 150 500 25 500
International Journal of Emerging Technology and Advanced Engineering
Website: www.ijetae.com (ISSN 2250-2459, ISO 9001:2008 Certified Journal, Volume 7, Issue 6, June 2017)
105
Internet bandwidth refers to the speed at which the data is transferred from sender to receiver and vice versa. The bandwidth is measured in Mbps (Megabits per second).
[image:6.612.45.570.193.344.2]The Following bandwidth matrix [16] enlists the bandwidth between the various regions of the world.
Table 3:
Internet Bandwidth Matrix (in Mbps) [16]
Region Id / Region
0 1 2 3 4 5
North America South America Europe Asia Africa Oceania
0 North America 2000 1000 1000 1000 1000 1000
1 South America 1000 800 1000 1000 1000 1000
2 Europe 1000 1000 2500 1000 1000 1000
3 Asia 1000 1000 1000 1500 1000 1000
4 Africa 1000 1000 1000 1000 500 1000
5 Oceania 1000 1000 1000 1000 1000 2000
The cost of placement of the application plays as important criteria in deciding the overall performance of the cloud. For the purpose of simulation, we take actual cost of Amazon EC2 m4.xlarge machine[17].
[image:6.612.43.571.427.731.2]Table [4] provides the cost at various datacenter locations of Amazon of m4.xlarge instance.
Table 4:
Amazon EC2 pricing of m4.xlarge [17]
Sr.
No. Datacenter Location Country Continent Virtual Machine Cost (per Hour)
1. US East (Northern Virginia) United States of America North America m4.xlarge $ 0.200 per Hour 2. US East (Ohio) United States of America North America m4.xlarge $ 0.200 per Hour 3. US West (Northern
International Journal of Emerging Technology and Advanced Engineering
Website: www.ijetae.com (ISSN 2250-2459, ISO 9001:2008 Certified Journal, Volume 7, Issue 6, June 2017)
106
As shown in the table above, Amazon has a different pricing plan for the same virtual machine at different datacenter locations. This is due to demand and supply factor.
[image:7.612.110.501.233.741.2]The datacenter locations where the demand of virtual resources is high, prices of virtual resources at those locations are higher as compared to other datacenter locations where the demand for virtual resources is normal or low. The other parameters [16][18] required to set up the simulation is given in table 5 below:
Table 5:
Configuration parameters of CloudAnalyst Simulation Tool [16][18]
Parameter Value Assigned
Cost per memory $ 0.050 Cost per storage $ 0.100 Cost per 1GB of data transfer (from/to Internet) $ 0.050
Data Center – Number of Virtual Machines 100
VM Image Size 10000
VM Memory 8 GB
VM Storage 20 GB
VM Bandwidth 1000 Data Center – Architecture X86 Data Center – OS Linux Data Center – VMM Xen
Data Center – Number of Physical Machines 40
Data Center – Memory per Machine 10 GB Data Center – Storage per machine 50 GB Data Center – Available BW per Machine 1000000 Data Center – Number of processors per machine 4
International Journal of Emerging Technology and Advanced Engineering
Website: www.ijetae.com (ISSN 2250-2459, ISO 9001:2008 Certified Journal, Volume 7, Issue 6, June 2017)
107
V. RESULTS AND DISCUSSION
CloudAnalyst simulation tool is used to set up the simulation. CloudAnalyst is a CloudSim based visual modeler. This tool enables the testing of SaaS application before actual deployment of the application in the real cloud environment. It is a GUI based tool, and it enables the researcher to set up simulation experiments without going into underlying details of programming. The results obtained after simulation are listed in Table 6 and are discussed below.
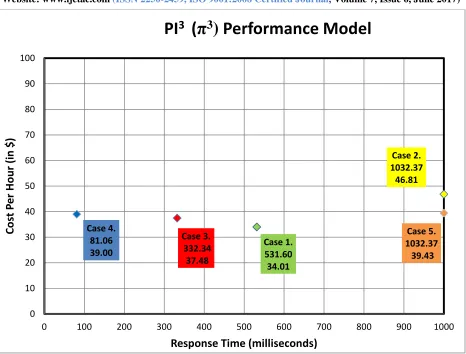
Case 1:In case 1. Datacenter is placed in North America. Dengue disease is common in Asia –Pacific, therefore a single userbase is taken in Asia-Pacific. A combination of closest datacenter service broker policy and throttled VM load balancing algorithm is used to set up the simulation. Simulation is carried out for a period of one hour. The response time obtained is 531.60ms and cost is $34.01. The results lie in the impoverished grid of PI3 performance model as shown in figure 2. indicating that placing the application in datacenter in North America is not an excellent solution in the current scenario.
Case 2: In case 2, datacenter is placed in South America. Userbase is taken in Asia Pacific. The same set of service broker policy and VM load balancing policy was used as used in case 1. The response time obtained in this case is 1032.37ms and the cost is $46.81. Both response time and cost are high as compared to case 1. It falls in the impoverished grid of PI3 performance model as shown in figure 2 and hence placing datacenter in South America is not a good solution in the current scenario.
Case 3:In case 3, datacenter is placed in Europe. Userbase is again taken in Asia Pacific.
Closest datacenter service broker policy and throttled VM load balancing algorithm is used to set up the simulation. The response time in this case, is 332.34ms and the cost is $37.48. In this case, the response time of the application is low as compared to case 1 and case 2. Though cost is high as compared to case 1, but it is low as compared to case 2. The performance of the cloud falls in the ideal grid of PI3 performance model as shown in figure 2 and hence it can be considered as one of the solutions to place the datacenter in Europe region in the current scenario.
Case 4: In case 4, datacenter is placed in the Asia continent. Userbase is again taken in Asia Pacific region. The same set of algorithms is used as was used in the previous cases to set up the simulation. Simulation is carried out for a period of one hour. The response time obtained is 81.06ms and cost is $39. There is a drastic improvement in the response time of the cloud when the datacenter is placed in the Asia Pacific region as compared to the previous cases. Though cost is slightly higher as compared to case 1 and case 3 respectively, response time obtained is excellent. The performance of the cloud falls in the ideal grid of the cloud environment as shown in figure 2and it is the best solution to place the datacenter in the Asia region in the current situation.
International Journal of Emerging Technology and Advanced Engineering
Website: www.ijetae.com (ISSN 2250-2459, ISO 9001:2008 Certified Journal, Volume 7, Issue 6, June 2017)
[image:9.612.87.524.157.357.2]108
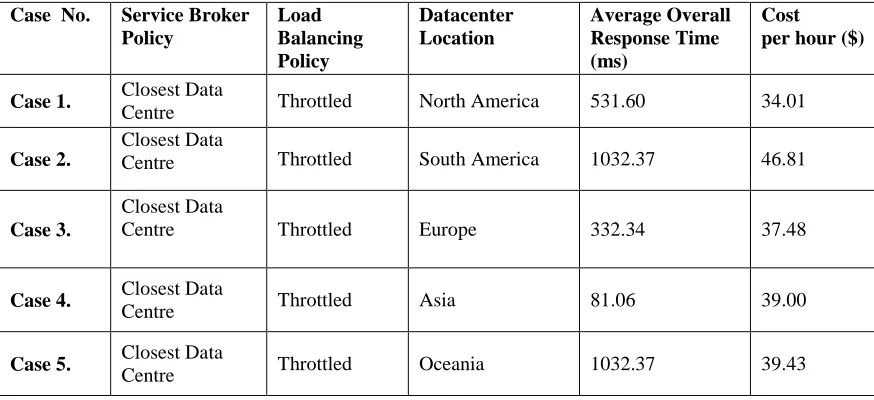
Table 6: Simulation ResultsCase No. Service Broker Policy
Load Balancing Policy
Datacenter Location
Average Overall Response Time (ms)
Cost per hour ($)
Case 1. Closest Data
Centre Throttled North America 531.60 34.01
Case 2.
Closest Data
Centre Throttled South America 1032.37 46.81
Case 3.
Closest Data
Centre Throttled Europe 332.34 37.48
Case 4. Closest Data
Centre Throttled Asia 81.06 39.00
Case 5. Closest Data
Centre Throttled Oceania 1032.37 39.43 From the above discussion, it is clear that case 4 is the
optimal solution to place the application at datacenter located in the Asia region. The application should be placed on Amazon EC2 cloud at Asia region for optimal performance in terms of response time.
International Journal of Emerging Technology and Advanced Engineering
Website: www.ijetae.com (ISSN 2250-2459, ISO 9001:2008 Certified Journal, Volume 7, Issue 6, June 2017)
[image:10.612.75.541.124.478.2]109
Figure 2: PI3 (π3) (Cloud Grid) Performance Model Result Chart
VI. CONCLUSION AND FUTURE SCOPE
Cloud technology is a revolutionary technology. It enables the small organizations to leverage the benefits of high end IT infrastructure without investing heavily in IT infrastructure. The small organizations can migrate to the cloud and pay as per their usage. SaaS applications are becoming popular these days to deliver services to the clients. These applications are placed on the infrastructure of the CSP and made available to the clients. The clients download the applications and interact with the resources of the CSP.
In this article, we analyze the performance of dengue application. This application is used to collect information from the clients and guide them regarding their future course of action to tackle the disease. The application needs to be placed at one of the datacenter locations of the Amazon EC2 cloud.
Before the actual deployment of the application on the cloud, we analyze the performance of the application using simulation tool and PI3 performance model. The results indicate that the application needs to be placed at datacenter located in the Asia region for optimal performance in terms of response time.
In the future, we would assess the performance of some other applications to be placed at various locations of different CSPs.
REFERENCES
[1] http://www.internetworldstats.com/stats.htm on 28.04.2017. [2] V. Thapar and O.P. Gupta,” PI3 Performance Model of Software as a
Service (SaaS) Cloud Environment” in International Journal of Advanced Research in Computer Science, pp. 926-927, 2017 [3] A. Losup, S. Osterman, M.N. Yigitbasi, R. Prodan, T. Fahringer,
and D. Epema, “Performance Analysis of Cloud Computing Services for Many-Tasks Scientific Computing” in IEEE Transactions on Parallel and Distributed Systems, pp 931-945, 2011
Case 1. 531.60 34.01
Case 2. 1032.37 46.81
Case 3. 332.34 37.48 Case 4.
81.06 39.00
Case 5. 1032.37 39.43
0 10 20 30 40 50 60 70 80 90 100
0 100 200 300 400 500 600 700 800 900 1000
Co
st
P
e
r
Hou
r
(in
$)
Response Time (milliseconds)
International Journal of Emerging Technology and Advanced Engineering
Website: www.ijetae.com (ISSN 2250-2459, ISO 9001:2008 Certified Journal, Volume 7, Issue 6, June 2017)
110
[4] L.E.B. Villalpanda, A. April, and A. Abran, “Performance AnalysisModel for Big Data Applications in Cloud Computing”, in Journal of Cloud Computing, Systems and Applications, 2014.
[5] K. Goga, O. Terzo, P. Rulu, and F. Xhafa, “ Simulation, Modeling, and Performance Evaluation Tools for Cloud Applications” in IEEE Eight International Conference on Complex, Intelligent, and Software Intensive Systems (CISIS), 2014
[6] J. Gao, K. Manjula, P. Roopa. E. Sumalatha, X. Bai, W.T. Tsai, and T. Uehera, “A Cloud-Cased TaaS Infrastructure with tools for SaaS Validation, Performance and Scalability Evaluation” in Proceedings of the 4th IEEE International Conference on Cloud Computing Technology and Science , CloudCom , pp 464-471, 2012.
[7] Q. He, J. Han, Y. Yang, J. Grundy and H. Jin, “QoS-Driven Service Selection for Multi-Tenant SaaS” in Proceedings of 5th IEEE Conference on Cloud Computing, 2012
[8] N. Khanghahi, and R. Ravanmehr, “ Cloud Computing Performance Evaluation: Issues and Challenges” in International Journal on Cloud Computing: Services and Architecture, pp 29-41, 2013
[9] K. Hwang, X. Bai, Y. Shi, M. Li, W.G. Chen, and Y. Wu, “ Cloud Performance Modeling with Benchmark Evaluation of Elastic Scaling Strategies” in IEEE transactions on Parallel and Distributed Systems, 2014
[10] M. Chiregi and N. J. Navimipour “A new method for Trust and Reputation Evaluation in the Cloud Environments using the Recommendations of Opinion Leaders' Entities and Removing the Effect of Troll Entities” in Computers in Human Behavior, pp 280-292, 2016.
[11] H. Khazaei, J. Misic, and V.B. Misic, “ Performance Analysis of Cloud Computing Centers” in International Conference on Heterogeneous Networking for Quality, Reliability, Security and Robustness in Heterogeneous Networks. QShine , pp 251-264, 2010. [12] R.R. Exposito, G.L. Taboada, S. Ramos, J. Touririo, and R. Doallo, “Performance Analysis of HPC Applications in the Cloud”, in Future Generation Computer Systems, pp 218-229, 2013
[13] J. Gao, P. Pattabhiraman, X. Bai, and W.T. Tsai, “SaaS performance and Scalability Evaluation in Clouds” in IEEE 6th International
Symposium on Service Oriented System Engineering, SOSE, 2011. [14] R. Sandhu, J. Kaur, and V. Thapar, “ An Effective Framework for
finding Similar Cases of Dengue from Audio and Text Data using Domain Thesaurus and Case Base Reasoning”, in Enterprise Information Systems, 2017.
[15] https://aws.amazon.com/about-aws/global-infrastructure/ on 11.05.2017
[16] B. Wickremasinghe. R.N. Calheiros, and R. Buyya, "CloudAnalyst: A CloudSim Based Visual Modeller for Analysing Cloud Computing Environments and Applications", in the proceedings of 24th IEEE International Conference on Advanced Information Networking and Applications, pp 446-452, 2010.
[17] https://aws.amazon.com/ec2/pricing/on-demand/ on 11.05.2017. [18] V. Thapar, and O.P. Gupta “Creating and Configuring Cloud
![Figure 1: PI3 (π3) (Cloud Grid) Performance Model of SaaS Cloud Environment [2]](https://thumb-us.123doks.com/thumbv2/123dok_us/8685841.875881/4.612.64.541.150.437/figure-cloud-grid-performance-model-saas-cloud-environment.webp)
![Table 4: Amazon EC2 pricing of m4.xlarge [17]](https://thumb-us.123doks.com/thumbv2/123dok_us/8685841.875881/6.612.43.571.427.731/table-amazon-ec-pricing-m-xlarge.webp)
![Table 5: Configuration parameters of CloudAnalyst Simulation Tool [16][18]](https://thumb-us.123doks.com/thumbv2/123dok_us/8685841.875881/7.612.110.501.233.741/table-configuration-parameters-cloudanalyst-simulation-tool.webp)