Munich Personal RePEc Archive
The dynamics of exploitation in
ensembles of source and sink
Friedrich, T.
Humboldt - Universitaet zu Berlin
27 January 2012
Online at https://mpra.ub.uni-muenchen.de/42387/
The dynamics of exploitation in ensembles of source
and sink
Abstract
The ensemble is a new entity on a higher level of complexity composed of source and sink. When substrate is transferred from source to sink within the transfer space or the ensemble space non-linearity is observed. Saturating production functions of source and sink in combination with linear cost functions generate superadditivity and subadditivity in the productivity of the ensemble.
In a reaction chain the source produces a product that will be used by the sink to produce a different product. The combined and interdependent productivity of the ensemble forms a surface similar to the Cobb-Douglas surface. Source and sink form a harmonic, synergistic ensemble.
When source and sink use the same substrate there will be competition. Both parties may have different saturating production functions, different linear cost functions and different amounts of substrates in their compartment. In an active ensemble substrate is transferred following the concentration gradient in harmony or through brute force or information (education) and superadditivity or subadditivity will appear. The surface within the transfer space or the ensemble space in the active ensemble is in some regions above or below the surface of the inactive ensemble.
When substrate is repeatedly transferred from source to sink the actual productivity of the ensemble moves along the surface to a stable point or one party is lost and the ensemble is destroyed. This movement is the dynamic aspect of the ensemble. The benefit to cost ratio of source, sink and ensemble can be interpreted as three-dimensional, non-linear coordinates of the ensemble appearing within the transfer space.
Introduction
Biologic life and economy are characterized by consumption and production (metabolism). Both systems are open. Energy, substrates and products are taken from sources and transformed to products in sinks. Every bill has to be paid somehow by somebody (law of conservation of mass and energy). In biochemistry, the lowest level of complexity in life, there is only reaction kinetics. Substrates will flow from high concentration to low concentration or from low affinity to high affinity. At this level neither selfishness nor altruism is observable as a self - “the distinct individuality or identity of a person or thing” - as such does not jet exist. An enzyme will neither give nor take nor not give nor not take beyond the limits of reaction kinetics.
Organisms from single cells to societies of multicellular organism are ensembles of entities of a lower level. Cells are composed of many different types of molecules from water and ions to macromolecules like DNA and protein. Enzymes are a very important type of protein. They produce and consume substrates in a complex and branched reaction chain. The final product of single celled life is offspring produced by cellular division. The “parent” will be a complete part of the offspring. Multicellular organisms are composed of single cells. All phenomena of multicellular life can be completely explained from the lower level. No new laws of nature appear. Besides offspring a “body” is produced. At the end of life the body is recycled but certain components will be stable for many years. All this could be called a stable investment product. Starting at a certain body size the more investment is made into such long lasting products, the smaller the offspring number will be (Brown J.H., Marquet P.A. and Taper M.L.). This puzzles biologists as low fertility should not be a good propagation strategy on the first glance. In societies the multicellular organism is part of an even more complex entity. Again no new law of nature appears. All observed phenomena can be explainable by the behaviour of lower levels. Next to offspring the products of societies range from lime skeletons the size of mountains to cities and songs. Who pays these products and why are they reasonable?
General considerations:
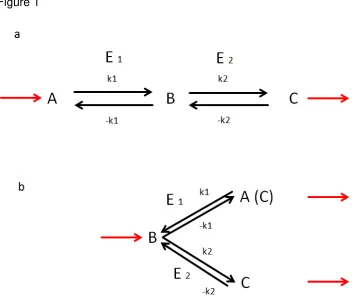
[image:4.595.72.436.229.529.2]Imagine two producing entities in close contact with a non-limiting connection between them. Both are united using either the same substrate or the substrate to the second entity is the product of the first entity.
Figure 1
Figure 1: In figure 1a we observe a reaction chain. Entity (enzyme) E1 is using a
substrate A to produce a product B. B then is used as a substrate by entity (enzyme) E2
to produce product C. The constants k1 and k2 and -k1 and -k2 are the forward and
backward reaction constants. Both entities act in harmony. They produce different quantities and different qualities and depend on each other in both directions – they act synergistically. The removal of B will increase the reaction velocity of E1 while a large
concentration of B will increase the reaction velocity of E2 for product C.
In figure 1b we observe a branched reaction and B is the branch point. E1 and E2 are
now competitors and their fate is inversely correlated. The more quantity of C will be produced by E2 from B the less B is available for E1 to produce a different quality (A) or
I will mainly concentrate on the case where both use the same substrate in different compartments with the possibility of transfer between the compartments. Only if affinity to the substrate, substrate concentration, product, product affinity, product concentration and production activity and reaction conditions are identical in both entities no mass transfer will occur between them. If at least one of the properties will be different a transfer from higher to lower concentration or from lower affinity to higher affinity will occur.
The identity of the conditions is only achievable on the lowest level of complexity – in enzymes. Sequence and structural identical enzymes in a well-mixed vessel satisfy this condition. As soon as we go to more and more complex entities (composed of entities of the lower levels of complexity) it becomes more and more difficult to meet the properties of complete equality of internal and external conditions. Inequality will lead to the phenomenon of super- and subadditivity.
Ensemble:
Productivity:
Many definitions exist but they all consider productivity as a rate. A rate is “a quantity measured against another quantity or measure”. Usually the measure is time. The result of productivity is a product. This product could be called a benefit (b, “an advantage or profit gained from something”). The
unit of productivity is amount per time (in enzymes: µmol/minute). This benefit comes at a cost (c, “an amount that has to be paid or spent to buy or obtain something”). In the characterized ensemble the benefit of one party comes at a cost to the same and the other party. Although the mass transfer will be always from source to sink, the cost will not necessarily accumulate on the side of the source and the benefit will not always arise in the sink as I will prove later. This will be important to understand the structure of harmony and conflict within ensembles. Productivity follows a saturating behaviour to the amount on all levels of complexity (figure 1). This has a simple physical reason, the Langmuir adsorption isotherm. Cost is usually considered of linear dependence to the amount.
Stability:
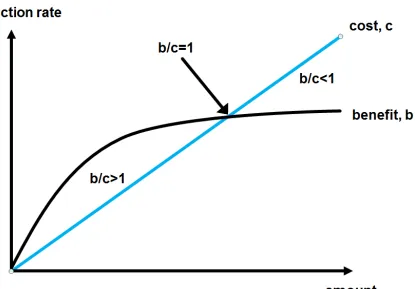
Stability (“The state or quality of being stable, especially: Resistance to change, deterioration, or displacement; constancy of character or purpose and reliability”) is measured over a wide range of time scales and is a prerequisite for observability within and beyond the considered timescale. Living systems are open. The stability is to be understood as steady state equilibrium. The benefit/cost ratio (b/c) is a very important measure for the stability and success of a system. Benefit/cost ratios of 1 indicate stability. Benefit/cost ratios smaller 1 indicate a decline and benefit/cost ratios larger 1 indicate growth. A living system from cells to societies will be stable if the benefit/cost ratio is 1 (figure 2).
parameters will not change. After the observed time period a total amount of product has been produced at a certain rate from another amount of substrate. In the real world this will happen at the expense of energy.
A single party will grow from b/c>1 or shrink from b/c<1 to b/c=1. An ensemble may possess a stable point but this may lead to instability in source and sink as I will show later. The benefit/cost ratio within the source may be: b/c>1; b/c=1 and b/c<1. The benefit/cost ratio within the sink may be: b/c>1; b/c=1 and b/c<1. However, only ensembles with surplus will reasonably produce offspring.
[image:7.595.111.526.349.638.2]
Figure 2
In organisms the productivity of enzymes will be of genetically fixed size. Therefore, to achieve the optimal benefit/cost ratio b/c=1 only the change of cost on a short timescale is an option. This may be different in other productive entities where a change of productivity is a fast and easy option.
To change the cost a party can give or take. To keep the cost a party will not give or will not take. The option to a source is to give and give not. The option to a sink is to take or take not. At b/c>1 a source will not give the valuable substrate. At a ratio of b/c<1 the source will give to reduce costing substrate. The sink will take at b/c>1 but will not take at a ratio of b/c<1. Both parties will neither take nor give at b/c=1. This leads to table 1.
Table 1
source sink behaviour of the single party b/c ≥ 1 b/c >1 The source will not give.
The sink will take.
conflict
b/c < 1 b/c >1 The source will give. The sink will take.
harmony
b/c < 1 b/c ≤ 1 The source will give. The sink will not take.
conflict
b/c ≥ 1 b/c ≤ 1 The source will not give. The sink will not take.
no conflict
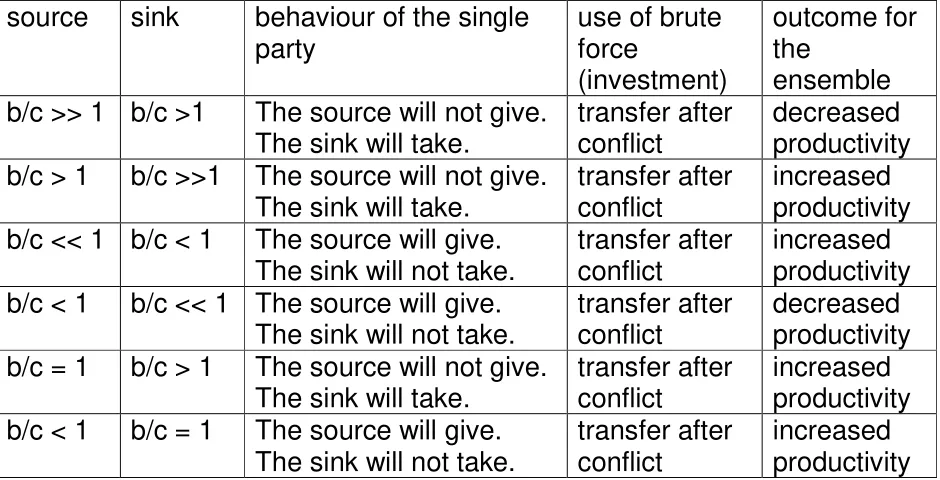
The picture becomes more complicate if we look at the consequences for the ensemble in the case of conflict. Here I assume for simplicity identical functions in source and sink and a small transfer.
Table 2
source sink behaviour of the single party
use of brute force
(investment)
outcome for the
ensemble b/c >> 1 b/c >1 The source will not give.
The sink will take.
transfer after conflict
decreased productivity b/c > 1 b/c >>1 The source will not give.
The sink will take.
transfer after conflict
increased productivity b/c << 1 b/c < 1 The source will give.
The sink will not take.
transfer after conflict
increased productivity b/c < 1 b/c << 1 The source will give.
The sink will not take.
transfer after conflict
decreased productivity b/c = 1 b/c > 1 The source will not give.
The sink will take.
transfer after conflict
increased productivity b/c < 1 b/c = 1 The source will give.
The sink will not take.
transfer after conflict
increased productivity
Figure 3
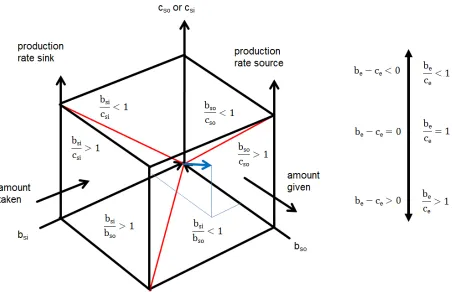
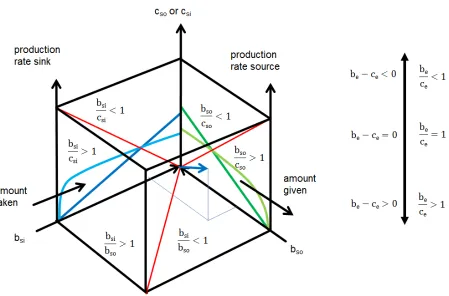
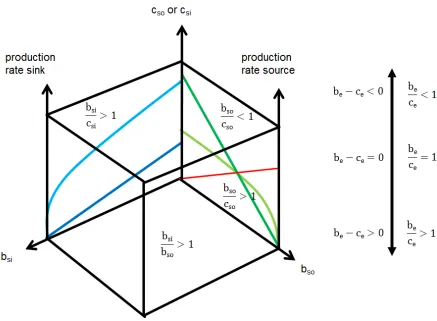
Figure 3: The transfer space has the coordinates cost (c, cost of source cso or cost of
sink csi), benefit to the source (bso) and benefit to the sink (bsi) and benefit of the
ensemble (be). The ensemble manifests within the space. The benefit/cost (be/ce) ratio or the net profit (be-ce) of the ensemble will increase when the cost to both sides will
decrease. The benefit/cost ratios to source (bso/cso) and sink (bsi/csi) are indicated on the
side of the space. The ground of the space shows the benefit-sink/benefit-source ratio (bsi/bso) and separates productive (bsi/bso>1) from consumptive (bsi/bso<1) transfers. We
observe the intensity of super- or subadditivity or strict equivalence. The cost is not considered on this side of the cube! The red lines on the side of the cube are benefit/cost ratios equal to one. On the ground the benefit-sink to benefit-source ratio (bsi/bso) equal to one is marked as a red line. An ensemble vector (blue) points at the
coordinate y: bso; x: bsi; z: be or cost. A transfer from source (amount given) to sink
The transfer space (figure 3) has been looked at in the past only from the outside. The ensemble however appears on the inside. The surfaces of the transfer space are two dimensional projections from the three dimensional inside. There are several ways to look at two parties. The parties forming the ensemble may or may not transfer substrates from source to sink. In case they do not transfer substrates the ensemble is inactive and the productivity of the ensemble is the sum of the single parties. When substrate is transferred the sum of the productivity of both parties may be smaller or larger (“The whole is more than the sum of its parts”. Aristotele; Metaphysica) than in the inactive case as I will proof.
There are two ways to display the ensemble within the transfer space.
1. The benefit of source minus the cost of source (bso-cso) and the
benefit of sink minus the cost of sink (bsi-csi) can be compared to the
total benefit minus the total cost of the ensemble (be-ce) with substrate
transfer or without transfer.
2. The benefit of source divided by the cost of source (bso/cso) and the
benefit of sink divided by the cost of sink (bsi/csi) can be compared to
the total benefit divided by the total cost of the ensemble (be/ce) with
substrate transfer or without transfer.
In case one (the economists view of an ensemble) the origin of the ensemble space is zero (be-ce=0; bso-cso=0; bsi-csi=0) and lies within the
transfer space. In case two (the biologists view of an ensemble) the origin of the ensemble space is 1 (be/ce=1; bso/cso=1; bsi/csi=1) and lies also within
the transfer space. In comparison to the orientation of the transfer space the ensemble spaces (b-c and b/c) have an orientation with the smallest values (b/c) or the negative values (b-c) on top. To avoid confusion pictures of the ensemble spaces will be presented top down depicting higher productivity upwards (8a and 8b).
To judge the outcome for the ensemble (benefit/cost ratio of the ensemble, be/ce or net profit of the ensemble be-ce) will be difficult as the transfer space
and the ensemble spaces are non-linear. The cost functions may be different in source and sink. The substrate concentration in both parties may be different. The production functions may differ in many ways. The maximal productivity, the steepness of the initial increase and even the shape (sigmoidal behaviour, monotonous saturating) may be different. Therefore, a general mathematic understanding should be used to model the whole ensemble of source and sink. The benefit of the ensemble (be) is
a result of the productivity of the ensemble. The productivity of the ensemble is a saturating function. Therefore, the benefit of the ensemble (be) will be the sum of the productivity and benefit of the single components
(benefit of source, bso; benefit of sink, bsi).
= +
The cost to the ensemble is the sum of the cost to source (cso) and sink
(csi).
= +
The benefit to cost ratio of the ensemble is: =
The net profit of the ensemble is: − = − + −
The benefit is the result of productivity and reaction rate or reaction velocity.
Productivity within ensembles of enzymes:
Enzymes are basic to life and a good model for saturating productivity. The Michaelis-Menten kinetics is a simple model of productive behaviour in enzymes.
The reaction velocity V or productivity P is part of the maximal reaction velocity Vmax or maximal productivity Pmax.
The source has a reaction velocity (productivity) Vso with the substrate
concentration [S]so and the sink has a reaction velocity Vsi with a substrate
concentration [S]si. For simplicity equal volumes in all considerations are
assumed. The Michaelis constant Km is the substrate concentration at which the reaction rate is at half-maximal. It is an inverse measure of the enzyme's affinity for the substrate. According to Michaelis-Menten the reaction velocity in the source is:
= + ∗ !"
The reaction velocity in the sink is:
= + ∗ !"
If all reaction parameters are identical no transfer between the parties takes place. The ensemble (Ve) of both parties has the productivity.
Ve inact = Vso + Vsi
The ensemble is not active (Ve inact). There may be other reasons for
inactivity.
A single transfer in harmony:
In the active ensemble (Ve act) transfer of substrate [∆S] will be observable.
Both parties become really source and sink. In the case of harmony (table 1) between the two parties the following equation is used:
! * = + − ∆− ∆ ∗ !" +
+ ∆
A single transfer in conflict:
In conflict the source will not give because b/c≥1 or the sink will not take because b/c≤1. Brute force or education will be used to change the assessment of the b/c ratio of the other party. The reassessment will mobilize additional substrate (∆ ´; take and give). ∆ ´ is a function of force and counterforce. Force and counterforce are the result of two different production functions. For example:
∆ ´ = . 01/ / ∗ !" −01 / / ∗ !" ) sink takes using force or
∆ ´ = .(01 / / ∗ !" −01/ / ∗ !" ) source gives using force
Both sides invest additional substrate (Iso, investment of the source; Isi,
investment of the sink) to avoid to give or to take and to be able to give or to take. The cost of the investment of the ensemble cIe = cIso+cIsi. If ∆ ´ equals zero there will be no substrate transfer. It is either the same substrate S used in a different process with a different cost and benefit function or a different substrate in the same or different process.
! * = + − ∆ ´− ∆ ´ ∗ !" +
+ ∆ ´
+ + ∆ ´ ∗ !"
source and sink. The investment by the not saturated sink has the effect that the source is changed from not giving to giving. The counter force used by the source is aimed to move the sink from taking to not taking. A saturated source will use force to move the sink from not taking to taking. The counter force by the sink is used to change the behaviour of the source from giving to not giving. A different interpretation is that the whole transfer space is deformed. The use of education and counter-information has the same purpose. The size of the investment in comparison to the size of possible superadditivity after the transfer will be discussed in more detail later (wise exploitation).
Besides “harmony”, “no conflict” and “conflict” there are three outcomes for the ensemble:
1. consumptive transfer: bsi < bso (table 2, decreased productivity,
subadditive)
2. productive transfer: bsi > bso (table 2, increased productivity,
superadditive)
3. productive wise transfer: bsi – cIsi > bso or bso – cIso > bsi
Wise refers here to the fact that the investment (cI) in brute force or education is overcompensated in the ensemble by the gain in productivity after the transfer from source to sink.
The transfer space (figure 4) represents on the surface of the cube source and sink (the benefit cost ratios), and within the transfer space the ensemble. Harmony, conflict and no conflict depend on the shape of the production function, size of the cost (actual saturation with substrate) and size of the transferred amount of substrate. The cost c in my simple assumption is the actual substrate concentration [S] of source or sink. To obtain this substrate (present degree of saturation) expenses had to be made now represented by the substrate. The substrate S is the benefit of a prior step.
Figure 4
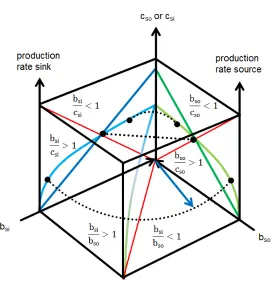
Symmetric ensembles: If the ensemble is symmetric in all aspects nothing will happen. A transfer of substrate will start when the substrate concentration or affinity is different in source (e.g. high, b/c<1) and sink (e.g. low, b/c>1) or different substrates are used - a first asymmetry.
[image:17.595.74.346.311.593.2]There are two types of harmonic ensembles. In the first type (figure 5a) the source will produce a product that is consumed by the sink to form a second product. Such behaviour is usually observed in (enzymatic) reaction chains (see reaction chain, figure 1 a).
Figure 5a
Figure 5a: This symmetric ensemble illustrates the similarity between the Cobb-Douglas production function and the ensemble surface of the transfer space. The dotted lines indicate the concave, linear and convex ensemble surface. In the concave area more of an earning substrate is better. In the convex area less of a costing substrate is better. This ensemble is harmonic and synergistic. The source produces a product consumed by the sink. No super- or subadditivity is observable. The ensemble will be reasonably active everywhere. Though its vector (blue) points on the side bsi/bso<1 the ensemble is
The symmetric ensemble of figure 5b will use the same substrate in source and sink (see branched reaction, figure 1b). Here we observe conflict, no conflict and harmony. Harmony here differs from harmony in ensemble of 5a. Harmony in the ensemble 5b occurs when the saturated source with a bso/cso ratio smaller than one will get rid of the costing substrate to a not
saturated sink where the same substrate will be earning (bsi/csi>1).
Substrate may be transferred freely from source to sink in the harmonic case or by means of brute force and education.
The use of the same substrate will lead to superadditivity when the recipient can produce more from the substrate than the sender loses as not realized productivity. In the case of subadditivity the recipient will produce even less from the substrate than the sender lost as productivity.
In a homogenized ensemble the cost cso and csi are the substrate
concentration before mixing [S]so and [S]si, however the productivity will
Figure 5b:
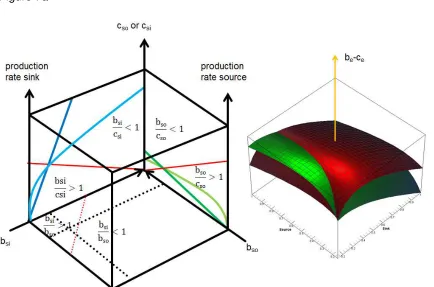
Figure 5b: In this symmetric ensemble source and sink use the same substrate. We observe superadditivity (harmony, symbiosis) in the left corner and subadditivity in the front and back of the space. The rational ensemble is not active in the irrational region (antibiosis). This is an additional aspect of asymmetry. A vector (blue) characterizes a specific ensemble and points to the surface of the productive side. On the right side the surface of the active (green) and inactive (red) ensemble is calculated. Vmax for both is 5µmol/min, Km is 0.25mmol and the linear cost is 3.5 times amount substrate (cso, csi).
0.15mmol substrate is transferred from source to sink. Concentrations below 0.15mmol are not shown. X and y are substrate concentrations and z is be-ce (either active or
inactive).
In a symmetric ensemble with asymmetric distribution of substrate the productivity will be better when substrate is transferred from a saturated source to an unsaturated sink. In the other areas the ensemble has a better productivity when the ensemble is inactive and no substrate is transferred!
Figure 5c
Figure 5c. The ensemble surface within the transfer space of a specific symmetric ensemble (red inactive, green active, figure 5b) is shown on top. The superadditive (green surface above red surface), subadditive and irrational area (green surface below red surface) are clearly visible. Vmax for both is 5µmol/min, Km is 0.25mmol and the linear cost is 3.5 times amount substrate (cso, csi). 0.15mmol substrate is transferred
from source to sink. Concentrations below 0.15mmol are not shown. On the bottom of the picture the characteristic lines of strict symbiosis (green) and strict antibiosis (red) are shown as a top down projection. Left schematic right a calculation with the values above but normalized for the cost on all axis (b-c). Interestingly a part of the symbiotic characteristic curve left of strict equivalence (blue line) is below the productivity of two single parties!
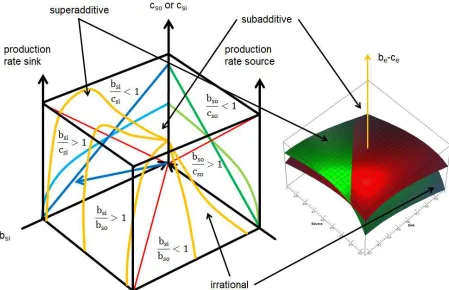
Asymmetric ensembles: Ensembles may be completely asymmetric with respect to the production function, the cost function, affinity and the actual saturation and substrate concentration. In figure 6 the sink may start everywhere in the observed region. The source may start at a point bso/cso<1. We observe harmony. The transfer will decrease the saturation of
the source and will increase the saturation in the sink. The cost function is so flat in the sink that bsi/csi=1 is not visible. The sink will not stop to take as
[image:21.595.86.523.334.655.2]taking will always pay in this section of the space. Is stability in reach when transfers will be repeated?
Figure 6
Figure 6: This asymmetric ensemble is productive, superadditive and harmonic at bso/cso<1. And the ensemble is productive and superadditive but with conflicts at
bso/cso≥1 (on cost of the source). Continuing transfer of substrate from source to sink will
This productive and harmonic asymmetric ensemble (figure 6) is stable in case the source is able to stop giving at bso/cso=1. The productivity is on
cost of the source but in bso/cso<1 it is reasonable to give. If the source is
neither able to stop giving nor able to regenerate at a loss identical velocity from anywhere else the source will become exhausted and the ensemble will break down. Harmony is lost when brute force is used. The ensemble could be also stable at other points. Investments in brute force and counter force or education and counter-information will change the points of possible stability. At those points the investments will compensate each other. Under those conditions the source may start to suffer because bso/cso<1 (also the sink may suffer if forced to stand the condition of bsi/csi<1
in other examples).
The ensemble surface in figure 6 will no longer be symmetrically like in figure 5a. The surface will have a more concave shoulder on the side bsi/bso>1. In symbiosis both parties share the gain of superadditivity. In the
neighbourhood of symbiosis we still observe a productive ensemble but the productivity is no longer owned by both, source and sink. The productivity in figure 6 would be owned and controlled by the sink. We observe a type of wise exploitation (bso/cso>1). The use of brute force is paid by
superadditivity in the sink and possibly suffering in the source. In figure 6 the sink could take the whole source in one bite. The sink is lost immediately and would have to be replaced by a new sink in the next round. In such a case we observe a predator-prey system.
An asymmetric ensemble of a reaction chain will have a distorted surface without super or subadditivity. Different quantities of different quality are consumed on one side and produced on the other side.
production functions and cost functions in source and sink having bso/cso=1
and bsi/csi=1 in the same point at the red line shown in figure 7a. From these
[image:23.595.70.504.243.530.2]different pairs active surfaces can be calculated. These surfaces will form a subspace within the transfer space. These subspaces are e.g. symbiosis, antibiosis, wise exploitation type I and wise exploitation type II.
Figure 7a
Figure 7a. Left: On the ground of this space we find three dotted lines. The black lines mark the position of bso/cso=1 and bsi/csi=1. The space is asymmetric. Left of the position
of the dotted red line the bsi/bso ratio has become so big that the cost (investment I) of
brute force or education (Iso, Isi) will be paid completely by superadditivity including a
reward (threshold superadditivity). Right: The superadditive (green surface above red surface), subadditive and irrational area (green surface below red surface) are clearly visible. Vmax for source is 5µmol/min, Km is 0.25mmol and the linear cost is 3.5 times amount substrate. Vmax for sink is 15µmol/min, Km is 0.1mmol and the linear cost is 7 times amount substrate. 0.15mmol substrate is transferred from source to sink. Therefore, substrate concentrations below 0.15mmol are not shown. Here it can be seen that the active asymmetric ensemble is superadditive in a region where the active symmetric ensemble would be subadditive because the source is already suffering (bso
Equal distribution (mixing) of substrate will not result in optimal productivity in asymmetric ensembles. Substrate should be distributed according to the biggest productivity. If b/c=1 is no part of this solution all three sides (source sink and ensemble) may suffer. If we look from the top down on the transfer space in figure 7a we lose the cost and benefit ensemble dimension but we get a better look at the surface of the asymmetric ensemble (figure 7b). At the surface of the ensemble of source and sink three characteristic curves (characteristic lines of equality) will appear. This is similar to figure 5c.
In strict symbiosis both parties have complementary saturation so that the transfer of substrate will result in a b/c ratio of 1 for both or b-c=0.
b-c
− ∆
+ − ∆ ∗ !" ) − = − = 0 ( 34 )
5 + + ∆+ ∆ ∗ !" 6 − = − = 0 ( 78)
or: ( − ) − ( − ) = 0
b/c
− ∆
+ − ∆ ∗ !" = = 1 ( 34 )
+ ∆
+ + ∆ ∗ !" = = 1 ( 78)
or: ( / )/( / ) = 1
In strict antibiosis the source will start at bso-cso=0 or bso/cso=1 and will
irrationally give. The sink will start at bsi-csi=0 or bsi/csi=1 and will irrationally
b-c
5>?<= + ; <= − ∆; ∗ @?AB; <= − ∆; <=6 − C<= = D<= − C<=
5>?<E + ; <E + ∆; ∗ @?AB <E6 − C<E = D<E − C<E; <E + ∆;
or ( − ) − ( − ) = 0 No party is able to exhaust the other party faster.
b/c
(>?<= + ; <= − ∆; ∗ @?AB <=)/C<= =; <= − ∆; D<=C<=
(>?<E + ; <E + ∆; ∗ @?AB <E)/C<E =; <E + ∆; D<EC<E
The irrational ensemble in strict antibiosis: ( / )) ∗ ( / ) = 7 *. The quotient ( / )/( / ) is a direct, dimensionless measure for the strength of antibiosis.
In strict equivalence the loss in productivity of the source is completely and exactly replaced by the gain in productivity of the sink.
│ + ∗ !" − + − ∆− ∆ ∗ !" │ = ∆
│ + ∗ !" − + + ∆+ ∆ ∗ !" │ = ∆
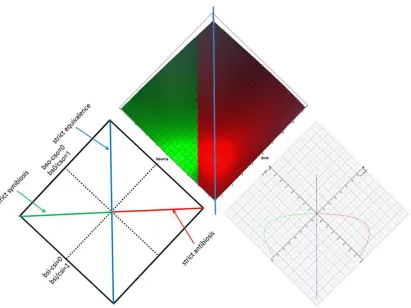
Figure 7b
Figure 7b. A bird`s-eye view asymmetric transfer space´s ground of figure 7a: The lines are projections from the inner volume. The green line is strict symbiosis. Whatever the source gives to reach bso/cso=1 is completely taken by the sink reaching bsi/csi=1. In the
white area source or sink give or take only what is necessary to reach b/c=1 (qualified symbiosis) - only one side will reach b/c=1. The orange area I and blue area II are productive wise exploitation of source (I) and sink (II). The source is exploited by the sink (I) or the sink by the source (II) because the exploited party can´t stop to give or to take. The area x is consumptive exploitation of the source. The area y is consumptive exploitation of the sink. Both behaviours are still rational as the investment for the exploiter is paid back (threshold 2). However, the productivity of the ensemble suffers. The areas v and w are unusual: although the investment of one side to exploit the other side is not paid the ensemble is still productive. Both parties lose while the ensemble gains. The blue line of strict equivalence (∆bsi-∆bso)=0 is separating productive and
sink. The red line is strict antibiosis. The rational ensemble is not active in most of the area of antibiosis but can be active in z. (The source gives an eye to make the sink lose an eye – literally.) The strong asymmetry shifts a part of the antibiosis to the left side of the orange dotted line 2 (threshold superadditivity 2). In z both parties harm each other rationally. In case the threshold superadditivity would be larger (orange dotted line 1) the region u marks a doomed symbiotic ensemble. The productivity of this ensemble is too small to be reasonable. Although there is harmony they will do alone better. Wise exploitation (I or II) is still an option in this example, too. An integrated ensemble is no longer an option (v,w)
The curvature of the surface of figure 7a is very asymmetric and concave in direction of bsi/csi=bso/cso. The differently coloured areas are separated in
the third dimension (ensemble). Symbiosis is sandwiched sideways between wise exploitation I and II.
The regions v and w are cause of discussion and confusion. In this areas the investment of the source (v) or the sink (w) are not paid back. The investment is “not wise”. However this region is on the earning side of the line of strict equivalence. Here a win is produced but it is neither owned by the source nor by the sink. The gain is owned by the ensemble. We observe an integrated ensemble. However, the border to pure consumption is easily crossed.
The region y and x are often confused with (productive) wise exploitation type I and II. In x and y the investment of one side is overcompensated but on cost of the productivity of the ensemble (consumptive exploitation). The worst regions are the blue and orange areas where the ensemble loses productivity while the investment is not paid (no letters indicated).
In figure 7b the characteristic lines for real values have been calculated (source: Vmax=5µmol/min, Km=0.25mmol, cost=3.5*substrate and sink: Vmax=15µmol/min, Km=0.1mmol, c=7*substrate or source: Vmax=15µmol/min, Km=0.1mmol c=7*substrate and sink: Vmax=5 µmol/min, Km=0.25 mmol, cost=3*substrate). We look with the eye of an economist on the net profit (b-c) of the interaction of two parties. The line of strict symbiosis and strict antibiosis are in one plane of the space.
Figure 7b
The connectivity of sources and sinks:
In the food chain every ensemble has an external source and will be a source for a different ensemble. The primary source of energy is the sun. Productive ensembles will grow, consumptive ensembles will shrink. Complex ensembles are composed of smaller ensembles. Resources within a complex ensemble may be redistributed between sub-ensembles so that an observed feature may look growing but on cost of a not observed sub-ensemble. This may finally lead to a decline of the complex ensemble in case the not observed sub-ensemble is of importance.
Discussions in economy and politics often compare ensembles with only slightly different coordinates. However the ensembles may belong to different ensemble surfaces. A linear change of the same relative size will have completely different effects. Different ensembles on the same surface are distinct, existing solutions but with different parameters in different areas.
There is no single ideal solution – that is known – but many different possibilities depending on productivity, cost and amount transferred. In some areas transfer is a solution to increase productivity – in other areas it is a mistake. Sometimes the ensemble gains although investments are not paid back and pure consumption is near. Even symbiosis may be doomed if superadditivity is not high enough to pay the costs. Finally, sometimes it is better that source and sink do their own thing and the ensemble is inactive.
Fairness: In the case of exploitation the exploited party gives an earning good or takes a costing good. This is harmful whatever the reason may be to do so.
Wise exploitation as described is of basic but primitive wisdom. The investment of brute force or education is – a reward always included – paid back. In the exploitation of non-intelligent species like in farming the wisdom may include breeding to avoid the loss of the exploited species. The investment into breeding includes a long term aspect and is wise, too.
Man will easily recognize brute force as a method of exploitation and start costly counterforce, reducing the benefit of brute force. After some time and observation man will detect education as a tool of exploitation, too. Costly counter education and counter force will be the result here.
Fairness is defined as: “The quality of treating people equally or in a way that is right or reasonable.” In case the effect of superadditivity in wise exploitation would be shared somehow, the exploited party would have some self-interest in enduring exploitation. The costing good taken or the earning good given would be transformed into something else which could be considered by the exploited party as a value. A simple way to share superadditivity would be:
Ve act − Ve inact 2
Many other possibilities to distribute the benefit of superadditivity are possible and the reason of negotiations in many fields of society. To share the benefit of superadditivity will decrease the negative effect of exploitation for the exploited party and the positive effect for the exploiting party. Inventions will increase the effectiveness and will produce more to share, increasing the stability of such an ensemble. In fair exploitation the gain of one party is shared, in symbiosis gain is produced on both sides. Fairness should not be confused with symbiosis!
The non-linear ensemble, the ensemble space: Depending on the distribution of substrates, cost functions and production functions in source and sink many different outcomes are possible. The ensemble as new entity appears within the transfer space and will be stable (be/ce=1) or
growing (be/ce>1) or shrinking (be/ce<1) on cost of source and/or sink for the
[image:31.595.72.516.288.573.2]benefit of source and/or sink (figure 8a). The ensemble is again represented by a surface curved in three dimensions.
Figure 8a
Figure 8a. The origin of the ensembles space has the coordinate be/ce=1; bso/cso=1;
bsi/csi=1. A symmetric active ensemble is compared to a symmetric inactive ensemble.
The green surface is superadditivity of the active ensemble. Below the red surface is subadditivity and irrationality. The red surface is the benefit/cost ratio of an inactive ensemble. The used values for calculation are identical to figure 5b.
A similar space will come from the coordinates b-c and will have the origin be-ce=0; bso
The coordinates of the ensemble space are for the inactive ensemble (red):
y axis: − = 01 H H ∗ !" − * or
/ = 01 H H ∗ !" / * and
x axis: − = 01H H ∗ !" − * or
/ = 01H H ∗ !" / * and
z axis:
7! * − = 01 H H ∗ !" +01H H ∗ !" − * or
7! */ = (01 H H ∗ !" +01H H ∗ !" )/ *
and for the active ensemble in harmony (green):
y axis: − = 01 H H ∗ !" − * or
/ = 01 H H ∗ !" / * and
x axis: − = H
01 H ∗ !" − * or
/ = 01H H ∗ !" / * and
z axis:
! * − = 01 H HI ∆HI ∆H ∗ !" +01H H ∆H ∆H ∗ !" − *
or
When these coordinates are used two surfaces appear in the ensemble space. The surface of the active ensemble is above the surface of the inactive ensemble when superadditivity is observed and below in the case of subadditivity and irrationality. In superadditivity the active ensemble has a better productivity than the inactive ensemble in the same region. Under irrational conditions and in subadditivity it would be better not to transfer substrate from source to sink. Here the ensemble has a higher productivity when both parties stay separated. In figure 8b an asymmetric ensemble is depicted. The asymmetric ensemble shows a dramatic increase of the ensemble productivity in the observed region.
Figure 8b
Other production kinetics: Besides saturating Michaelis-Menten kinetics there are saturating logistic (sigmoidal) shapes of the production observable. In enzymology we observe sigmoidal behaviour when enzymes are oligomers of subunits each carrying a catalytic site. In addition, the different binding sites will influence each other in a way that the binding of the first substrate will increase the binding of a second substrate and so on. This type of enzyme is called allosteric. A simplified velocity equation for allosteric enzymes is the Hill Equation. Four binding sites with very high cooperativity between them results in the following equation:
!" =
J
!K L J
1 +!K L J J
This equation can be reduced to an equation similar to the Michaelis-Menten equation. K is a constant containing the interaction factors a, b and c and the intrinsic dissociation constant Ks.
= 0 HH MM∗ !" ( = !K L J) (7 = 4)
The productivity of an active ensemble of source and sink with sigmoidal production functions will be therefore:
! * = (+ ( − ∆ )− ∆ )O O ∗ !" + (+ ( + ∆ )+ ∆ )O O ∗ !"
! * =
− ∆
+ − ∆ ∗ !" + + + ∆+ ∆ ∗ !"
+
and in conflict with monotonous saturating productivity:
! * =
− ∆ ´
+ − ∆ ´ ∗ !" + + + ∆ ´+ ∆ ´ ∗ !"
+ + P
in harmony with sigmoidal saturating productivity:
! * =
( − ∆ )O
+ ( − ∆ )O ∗ !" + ( + ∆ )
O
+ ( + ∆ )O ∗ !"
+
and in conflict with sigmoidal saturating productivity:
! * =
( − ∆ ´ )O
+ ( − ∆ ´ )O ∗ !" + ( + ∆ ´ )
O
+ ( + ∆ ´ )O ∗ !"
+ + P
The results are the coordinates (be/ce; bsi/csi; bso/cso) of the ensemble space.
Figure 9
Figure 9: The transfer space on the left side with different production functions and cost functions in source and sink. In the source there is a saturating production function (light green) and a linear cost function (dark green). The sigmoidal production function in the sink (light blue) and a linear cost function (dark blue). The side of the sink has an additional red line separating bsi/csi<1 from bsi/csi>1. On the right side the ensemble
surface (active ensemble green, inactive ensemble red) within the transfer space (z = be
- ce; x = substrate concentration source, y = substrate concentration sink is shown.
For the ensemble space we would obtain:
! * =
− ∆
+ − ∆ ∗ !" + ( + ∆ )
O
+ ( + ∆ )O ∗ !"
+
Repeated transfers and dynamics:
If the transfer [∆S] for example in wise exploitation is repeated because one side does not stop to take or give the source or the sink may sooner or later be exhausted and the ensemble will fall apart in case no stable point is in reach or one side can not stop to give or to take. The Lotka-Volterra equation is a model for an autocatalytic ensemble.
Q + RSTUV 2R
R + WUV 2XSL
W + YSKUV Z + Y
A is an endless external source for the source within the ensemble. B is an endless external sink for the ensemble internal sink. A and B are considered constant. A enters the ensemble and is transformed to X; Y leaves the ensemble being transformed to E with the help of B.
["
[* = 8TQR − 8L"X [X
[* = 8L"X − 8KYW
This system is well understood and a good model for cyclic population behaviour in predator-prey and parasite-host systems (Prigogine, I.). Let us take it as an orientation.
Case 1:
The source obtains the substrate S at a certain rate k1 from the endless
external source A.
QSTUV
[ /[* = 81 ∗+ 81 ∗ ∗ !"
The sink has also the basic source A where the substrate S is produced from at a rate k2:
QSLUV
The productivity change of the sink is:
[ /[* = 82 ∗+ 82 ∗ ∗ !"
The productivity change of the inactive ensemble would be:
dVe inact/dt = [Vso/dt + dVsi/dt
As soon as the ensemble becomes active substrate is transferred from source to sink. But this time the transfer would be repeated over and over again at a certain rate k3 (amount of substrate within a time interval). The
view of the source is SKUV − ∆ and the view of the sink is
SK
UV + ∆ . Substrate is lost or gained at a rate of k3.
[ ! */[* = 81 ∗+ 81 ∗ − 83 ∗ ∆− 83 ∗ ∆ ∗ !"
+ 82 ∗+ 82 ∗ + 83 ∗ ∆+ 83 ∗ ∆ ∗ !"
It is clear that if k1>k3 the ensemble is viable and if k1<k3 the ensemble will
end because the source becomes exhausted.
Case 2
QSTUV
From the substrate A the source will have the productivity change:
[ /[* = 81 ∗+ 81 ∗ ∗ !"
This time the sink obtains the used substrate completely from the source.
^ =
The sink has a basic given saturation BS witch will not be used if a source is present. The productivity of the sink alone is:
= Y + Y ∗ !"
The productivity of the inactive ensemble would be again:
dVe inact/dt = [Vso/dt + Vsi
The ensemble becomes active when substrate is transferred from source to sink. But this time the transfer must be repeated over and over again at a certain rate k2. The view of the source is:
SL
UV − ∆ , and the view of the sink is: SLUV ∆ . Substrate is lost or gained at a rate of k2.
[ ! */[* = 81 ∗+ 81 ∗ − 82 ∗ ∆− 82 ∗ ∆ ∗ !"
+ Y + 82 ∗ ∆+ Y + 82 ∗ ∆ ) ∗ !"
It is clear that if k1>k2 the ensemble is viable and if k1<k2 the ensemble will
end because the source becomes exhausted. Similar considerations can be made for sigmoidal or mixed behaviour including the investments of brute force and education.
The velocity v depends on the frequency of the transfer of small substrate portions from source to sink.
_ = [ ∆[*
But the velocity of development of the ensemble is also the change of ensemble productivity Ve over time.
_ = [[*
As the space is non-linear
[ ∆
[* ~[[*
In case the change of Ve does not take place in harmony, there will be force
and counterforce of source and sink. To move the vector a force is necessary. Force and counterforce could be interpreted as viscosity of the transfer space.
a = μQ[3[X
Discussion:
Live is based on the DNA/RNA/Protein complex including other groups of organic and inorganic molecules. All components of life are important but enzymes and enzyme complexes contribute basically and directly to productivity. Organisms compete for similar substrates like carbohydrates, amino acids, lipids, light, water, oxygen, carbon dioxide and many other building blocks of live. Most of the conflicts are handled with brute force within and between species. The romantic game theory suggests that the best solution for conflicts is “cooperation” because this has the highest productivity and long term stability. The transfer space and ensemble space can better explain on all levels of complexity (from enzymes to societies) the behaviour of living entities and in which way unexpected dynamics will arise. Superadditivity has been observed in experiments solely designed to investigate ideas develop in game theory ((Turner, P.E. and Chao, L.; 1999). What is generally regarded as cooperation is either wise exploitation where on side stops at b/c=1 or harmony of giving and taking in symbiosis. Source and sink may be tied together by accident; falling in all generations into the same pit or by brute force and education which makes a process of recognition for the gaining party necessary. To be source and sink may be a fixed fate but may also depend on the point of view. Especially in wise exploitation the sink may become a source for the exploited primary source like in breeding and farming. In the food chain the flow of energy shows that there is no real reciprocity. Therefore, the idea of “reciprocity” of classic game theory seems to be naïve as is the idea of “altruism”. There is only selfishness in all actions of source and sink. We no longer need to explain the development of altruism with “haystacks” in “group selection” as there is no altruism. Master and servant strategies are superior behaviours as recently demonstrated (Rogers et al.). A prerequisite for stability is the sufficient regeneration of the servant. An energy source is needed.
offspring) or used to feed and care for the already existing offspring. Depending on the effectiveness and productivity additional substrate is used where it will have the biggest impact on productivity. The mechanism to decide what has the biggest impact is “survival of the fittest”. Productivity is an important part of fitness. Fitness means in some species more offspring (quantity) and in other species higher quality offspring. The quality increase is due to low saturation and high productivity during growth in comparison to the saturated parents with low productivity and shorter residual lifetime.
The high economic productivity in modern industrial societies is accompanied by a sharp decrease in offspring (Myrskylä, M. et al). The transfer space is able to explain this also. The productivity of the source is transformed into consume and production of goods while reproduction suffers. To be rich in children is synonymous for being poor in material goods on the average from individuals to societies (conservation law of mass and energy). If the data of Myrskylä, M. et al would have not been linearized with a hitherto unknown method it would be easy to see that the system follows an indifference curve where less (of a costing good) is better. This is in contrast to usual indifference curves in economics where “more is better”. Both shapes are part of the transfer space (figure 5a).
Summary:
Literature
Brown J.H., Marquet P.A. and Taper M.L. Evolution of body size: consequences of an energetic definition of fitness; The American Naturalist; Vol. 142, No. 4, Oct., 1993:573-584
Friedrich, T. (2010): MPRA, The transfer space.
Myrskylä, M., Kohler, H.-P. and Billari, F.C.; Advances in development reverse fertility declines; Nature 460 (2002) 741-743
Prigogine, I., Self-Organization in Nonequilibrium Systems (Wiley-Interscience, New York, 1977)
Rogers, A., Dash, R. K., Ramchurn, S. D., Vytelingum, P. and Jennings, N. R.; Coordinating Team Players within a Noisy Iterated Prisoner’s Dilemma Tournament. Theoretical Computer Science (2007) 377 (1-3) pp. 243-259 Solt, F. (2011) Diversionary Nationalism: Economic Inequality and the Formation of National Pride; The Journal of Politics, 73:821-830