University of Huddersfield Repository
Freeman, Samuel David
Exploring visual representation of sound in computer music software through programming and composition
Original Citation
Freeman, Samuel David (2013) Exploring visual representation of sound in computer music software through programming and composition. Doctoral thesis, University of Huddersfield. This version is available at http://eprints.hud.ac.uk/id/eprint/23318/
The University Repository is a digital collection of the research output of the University, available on Open Access. Copyright and Moral Rights for the items on this site are retained by the individual author and/or other copyright owners. Users may access full items free of charge; copies of full text items generally can be reproduced, displayed or performed and given to third parties in any format or medium for personal research or study, educational or notforprofit purposes without prior permission or charge, provided:
• The authors, title and full bibliographic details is credited in any copy; • A hyperlink and/or URL is included for the original metadata page; and • The content is not changed in any way.
For more information, including our policy and submission procedure, please contact the Repository Team at: [email protected].
–
Exploring visual representation of sound
in computer music software through
programming and composition
Samuel David Freeman
A thesis submitted with a portfolio of works to the University of
Huddersfield in partial fulfilment of the requirements for the degree of
Doctor of Philosophy
December 2013
–
Summary Table of Contents
Abstract Abstract – Abstract
Abstract
Presented through contextualisation of the portfolio works are developments of a practice in which the acts of programming and composition are intrinsically connected. This practice-based research (conducted 2009–2013) explores visual representation of sound in computer music software.
Towards greater understanding of composing with the software medium, initial questions are taken as stimulus to explore the subject through artistic practice and critical thinking. The project begins by asking: How might the ways in which sound is visually represented influence the choices that are made while those representations are being manipulated and organised as music? Which aspects of sound are represented visually, and how are those aspects shown?
Recognising sound as a psychophysical phenomenon, the physical and psychological aspects of aesthetic interest to my work are identified. Technological factors of mediating these aspects for the interactive visual-domain of software are considered, and a techno-aesthetic understanding developed.
Through compositional studies of different approaches to the problem of looking at sound in software, on screen, a number of conceptual themes emerge in this work: the idea of software as substance, both as a malleable material (such as in live coding), and in terms of outcome artefacts; the direct mapping between audio data and screen pixels; the use of colour that maintains awareness of its discrete (as opposed to continuous) basis; the need for integrated display of parameter controls with their target data; and the tildegraph concept that began as a conceptual model of a gramophone and which is a spatio-visual sound synthesis technique related to wave terrain synthesis. The spiroid-frequency-space representation is introduced, contextualised, and combined both with those themes and a bespoke geometrical drawing system (named thisis), to create a new modular
Abstract Abstract – Abstract
Acknowledgements
This projected was supported by the Arts and Humanities Research Council (AHRC) and
supervised by Professors Clarke and Adkins (JMC and Monty) to whom I am eternally grateful, as I
am also to family, to friends, and to Huddersfield.
Copyright Statement
i. The author of this thesis (including any appendices and/or schedules to this thesis) owns any
copyright in it (the “Copyright”) and s/he has given The University of Huddersfield the right to use
such Copyright for any administrative, promotional, educational and/or teaching purposes.
ii. Copies of this thesis, either in full or in extracts, may be made only in accordance with the
regulations of the University Library. Details of these regulations may be obtained from the
Librarian. This page must form part of any such copies made.
iii. The ownership of any patents, designs, trademarks and any and all other intellectual
property rights except for the Copyright (the “Intellectual Property Rights”) and any reproductions
of copyright works, for example graphs and tables (“Reproductions”), which may be described in
this thesis, may not be owned by the author and may be owned by third parties. Such Intellectual
Property Rights and Reproductions cannot and must not be made available for use without the prior
written permission of the owner(s) of the relevant Intellectual Property Rights and/or
Overview of the Portfolio Directories Overview of the Portfolio Directories – Overview of the Portfolio Directories
Overview of the Portfolio Directories
An overview of the portfolio directories – found on the attached DVD, and also available online at
http://sdfphd.net/portfolio – is given here, showing only folder names, and only to a depth of two:
• sdfphd_portfolio_by_chapter
◦ chapter3_inSoftware_onScreen
▪ model_of_a_gramophone
▪ MoEpixels
▪ saw~onepole~noise~click~
▪ sub_synth_amp_map
▪ visyn
◦ chapter4_Spiroid
▪ BensonSymmetryEx3
▪ nRadii
▪ spiralArc300
▪ spiroidArc+timespace
◦ chapter5_CirSeq
▪ _alpha_preview_and_thisis
▪ CirSeq_Zero
◦ chapter6_sdfsys
▪ _alpha
▪ _beta
1:Introduction Introduction – 1: Introduction
1: Introduction
Sound is a fleeting and transitory phenomenon; existent as itself only in the moment. To make
sound tangible, so that we can see it, hold it, or freeze it in time, various forms of symbolic
representation have been invented. In the composition of music it is representations of sound that
are worked with, whether that be the dots and lines of common music notation, a sound-recording
medium, or computer software. Different forms of representation emphasise different aspects of
sound in the visual domain. This project began by asking:
• How might the ways in which sound is visually represented influence the choices that are
made while those representations are being manipulated and organised as music?
1.1
Motivation
The motivation for that line of questioning came, in part, from the experience of having elements of
my compositional practice examined in research by Jean-Baptiste Thiebaut on the use of sketching
by contemporary composers (Healey & Thiebaut, 2007; Jean-Baptiste Thiebaut, 2010). Thiebaut's
case study featured a series of my compositional sketches from my 2006 eight-channel work
Octorgan, and include some early development of what I now refer to as spiroid-frequency-space
representations of the frequency-domain. Observation of the spiral structure emergent from several
octaves of a scale of notes arranged in a circle, however, for me began in the compositional process
of an earlier piece, six notes of a whistle flute (2005). Pen and pencil on paper have always featured
extensively in my musicking, but it was with those two works that a consciously meditative
approach to geometrical drawing in the exploration of musical ideas took seed.
In realising musical ideas which are borne through the free association of geometrical forms
1:Introduction Motivation – 1.1 Motivation the same associative values. Ideas had to be re-thought, and thus re-shaped, in order to manifest as
sound through the technology at hand. This project thus set out to close the gap between ways of
thinking derived from intuitive spatio-visual exploration of ideas to the ways of working permitted
by existent software.
Projects such as those by Thiebaut and, to give another example, InkSplorer by Garcia et al.
(2011) seek to develop systems that enhance the paper based activities which are common in the
composition of music, particularly in the early stages of a work. Garcia et al. and Thiebaut have
each followed a model of research, which might be characterised as belonging to the field of music
technology in the sciences, in order to develop systems for general use by a target demographic.
Rather than proposing general purpose solutions, the present thesis – situated in the field of music
technology in the arts – documents and contextualises the search for, development towards, and use
of, idiosyncratic compositional responses to questions about representing aspects of sound visually
in interactive systems.
The motivation to develop a bespoke software environment in which to compose new music
began as a move away from the live laptop performance based work that – alongside computer
music pedagogy – had been my focus in the years prior to the start of this project. As a
continuation of my earlier compositional practice, this project was initially proposed to explore
methods of visual representation specifically designed as circular in appearance. During the
progression of the research, in light of new findings and changing perceptions of the work and its
context, the scope of this project has been refined, and its aims and priorities have been adapted.
1.2
Initial context
1.2.1
Representations of sound
1:Introduction Initial context – 1.2.1 Representations of sound know that there are only representations of sound – either as recordings or synthetic potential– from
which actual acoustic sound can then be produced via transducers attached to outputs of the
computer system. Sound recordings exist within the computer as audio-buffers and sound-files in
the symbolic form of time-ordered numeric values, but it is possible to think of this simply as being
'digital audio' in the same way that we may think of there being 'analogue audio' on lengths of tape
without giving much thought to the physics of magnetic fields and so on. Likewise, the
programmatic algorithms describing the synthesis or processing of digital audio in software can be
thought of as equivalent to the electronic phenomena in analogue circuitry – whether that is what
the software is modelling or not.
Although not limited to do so, software often mimics the audio tape medium, albeit in
greatly augmented ways. By accepting digital audio as an extension or continuation of the
technological ability to record and reproduce sound, we also accept the ways of thinking about, and
working with, sound that the previous technologies provided. Applicable to digital audio are thus,
for example, the techniques associated with the musique concrète and acousmatic traditions.
The invention of musique concrète was possible in the mid-twentieth century because of a
practice which took root in the mid-nineteenth century: the art of recording sound as a trace of its
vibrational motion. In contrast to music that is made by working with recorded sound, we can look
at a form of symbolic representation which has a much longer history in the theory and practice of
music: the scored notation of sound parameters. Towards the matter of musical notation, and
opening with a statement of aesthetic pertinence, Gareth Loy (2006, p. 11–12) writes:
The realm of personal musical experience lies entirely within each one of us, and we cannot share our inner experiences directly with anyone. However, many world cultures have developed systems for communicating musical experience by representing it in symbolic written and verbal forms. […] one such system [is] the Western common music notation system (CMN). Its prevalence today makes it a good entry point to a broader discussion
1:Introduction Initial context – 1.2.1 Representations of sound often called upon the concept of ‘dots on lines’ (in reference to common music notation) as a
starting point because this is a familiar form of visual representation in music. The idea that the act
of arranging dot-like symbols on horizontal lines can be described as ‘composing music’ is
generally accepted because it is well enough known that such symbolic representations can be
interpreted to produce a prescribed sequence of sounding events. The suggestion is then given that,
as CMN evolved over time, the visual form of the CMN score presented new opportunities for
composers to explore, such as by offering various possible symmetries on the page through which
to describe patterns of rhythm and pitch which might not otherwise have been prescribed. The
conclusion of this example is then that the way a system of visual representation of sound actually
looks to the eye will affect the creative thoughts that one might have about what one might do with
those representations, and thus do with the parameters of sound being represented.
Several centuries of CMN use and development have nurtured an approach to music 'which
starts from an abstract conception and notation leading to a concrete performance', and it was
'against the “excess of abstraction” of [his] period' that Pierre Schaeffer reacted with the concrète
approach to music. Schaeffer 'started from the concrete sound material, from heard sound, and then
sought to abstract musical values from it' (Chion, 1983, p. 37).
One way of describing the work undertaken in this project would be to say that it seeks to
look into the essence of those representations of sound that may commonly be thought of as being
the sounds that they represent. Representations of sound in visual form can only ever portray a
metaphorical shadow of the thing being represented; only ever can some of the characteristics of
sound be shown because sound is not itself a visual phenomenon. In choosing to employ a
particular method of representation for the purpose of organising sound as music, one delimits the
1:Introduction Initial context – 1.2.2 Computer music software
1.2.2
Computer music software
A significant characteristic of contemporary culture is the omnipresence of software systems
(Manovich, 2008).1 What possible implications this situation may have to new musics are
approached by this research, and the resultant difficulties encountered in defining an artistic 'work'
as distinct from the 'tools' used to make it are also explored. Computer music software, as referred
to in the title of this project, could be taken as to encompass any and all software which may
facilitate musicking in its many and varied forms; from digital audio workstation (DAW)
applications to digital media players and contemporary web browsers. This project investigates the
interactive processes of composition that transpire between a human composer and compositional
materials in their manifest state as visual representations in computer music software. Creation of
new software systems (programming) is an integral part of my compositional practice. Whereas
programming was, in my works prior to this project, thought of as a means to an end in the pursuit
of sound making systems, this research has set as its context the conscious engagement with the
software medium.
The original proposal also suggested that multitouch tangible interface technologies would
feature in the design of new software works. That direction of research was inspired, at the time, by
the Lemur controller from JazzMutant2 and the reacTable (Jordà et al., 2007) systems. Mobile
telecommunication devices with multitouch interfaces were also becoming more common, and the
idea of finger-touchable interfaces to software was very appealing. Six months into the project,
however, critical reflection at the launch of the Apple iPad (Apple, 2010), lead to a revaluation of
the concept as beyond the scope of this work which chooses instead for its focus to remain on
software that is presented on a standard computer screen, or visual display unit (VDU) as was the
1 Manovich's digital manuscript for the book Software Takes Command is cited; this became unavailable online as it was to be published in July 2013 by Continuum, to 'be part of the International Texts in Critical Media Aesthetics series edited by Francisco J. Ricardo' (Manovich, 2012).
1:Introduction Initial context – 1.2.2 Computer music software descriptive term used in the early days of computer software graphical interface design (Sutcliffe,
1988).
1.3
Thesis structure
The following chapter (§2: Looking at sound) describes the techno-aesthetic3 basis for this
practice-based research by examining (first) physical properties of sound, and technologies by which are
able to see them, and (second) some of the psychoacoustic aspects of sound upon which portfolio
works find context.
Chapter three (§3: In software, on screen) presents six portfolio pieces, each with their own
contextualisation; these pieces comprise a developmental trajectory with an increasingly
philosophical approach to the methods and materials being worked with. That chapter concludes
(§3.7) with a discussion of 'software as substance'.
The spiroid-frequency-space concept, that has already been mentioned (§1.1), is introduced
in chapter four (§4: Spiroid). The formalisation of the concept within this project, the wider context
of similar structures, and my first software implementations of it are described.
The CirSeq concept is then the subject of chapter five (§5: CirSeq); its inception as a
'time-space' counterpart to the spiroid-frequency-space visual representation is detailed, and the
compositional use of a software implementation of the concept is discussed.
Chapter six (§6: sdfsys) describes the work that is a culmination of the preceding works;
development of the sdfsys computer music software environment, across its alpha and beta versions
are presented. Compositional practice is then explored through new pieces that have been created
with sdfsys.
2:Looking at sound Looking at sound – 2: Looking at sound
2: Looking at sound
Sound is a psychophysical phenomenon: there is the physical reality of molecular motion
(acoustics), and there is the psychological subjectivity of the human observer (psychoacoustics). To
those who work with the medium of sound, awareness of both its physical and psychological
properties – as well as of how complex structures of sound behave in both space-time and human
perception – are vital. Beyond the depth of awareness that a practitioner may possess is the amount
to which that insight is applied in their workings with sound, be that consciously or otherwise.
In seeking to connect with sound itself through interactive visual representations, this
project exist within the context of a contemporary occurrence of the periodic tendency described by
Nicolas Collins (2012, p. 1):
The acoustical reality of sound, and its quirky interaction with our sense of hearing, periodically drives artists to return to the “year zero” in music—before the codification of melody, rhythm and harmony—and explore fundamental aspects of the physics and perception of sound.
This chapter first examines acoustic properties of sound as the stimulus of visual
manifestation and begins to identify aesthetic foundations for the project. Some psychoacoustic
aspects of sound are then introduced as developmental foundation for creative works. The themes
chosen for discussion here are of those that feature in the portfolio pieces, though the multitude of
connections between concepts and works are not all expressed at this stage; the contextualisation
provided here is built upon in later chapters.
2.1
Looking at physical aspects
2.1.1
Physical patterns
The physical phenomena of sound are prominent, for example, in works by Alvin Lucier. His
2:Looking at sound Looking at physical aspects – 2.1.1 Physical patterns tape-recording to, in effect, sonify the physical properties of the space in which the piece is
performed. In Lucier’s The Queen of the South sound is directed to give rise to visible patterns on a
surface in a way similar those ways associated with the works of Ernst Chladni (1787) and Hans
Jenny4.
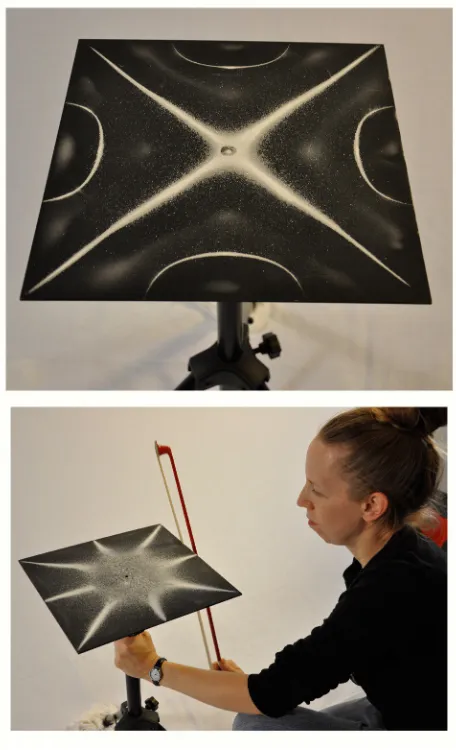
So called Chladni patterns, or figures, are shapes that are 'formed when a sand-covered
surface is made to vibrate. The sand collects in the regions of least motion' (Stevenson & Lindberg,
2011a). The surface patterns created by various modes of vibration are geometrical with numerous
symmetries, and often similar in appearance to mandala formations. When using an oscillator to
stimulate the plate with sinusoidal sound waves, higher frequencies yield more complex patterns
than do lower frequencies, with the precise frequency required to produce a particular nodal pattern
being dependant on the physical properties of the plate.
2:Looking at sound Looking at physical aspects – 2.1.1 Physical patterns
Figure 2.1: Chladni patterns
What Chladni was observing, in the late eighteenth-century, when the edge of a
sand-covered metal plate was bowed and a visual manifestation of resonant sound waves was seen to take
shape on the surface, was the same thing that Robert Hooke had seen in flour on glass a century
before that; and we can today observe the same acoustic principles at play. Contemporary artist
Jodina Meehan5 works with these principles, as illustrated in Figure 2.1 (Frank, 2010).6 The
principles themselves are timeless and unchanging: a statement that, while it may seem obvious, is
pertinent to the aesthetics of the project; they can manifest in different ways but the principles
remain the same.
5 Editor of Journal of Cymatics: The Study of Sound Made Visible (http://cymatica.com/)
2:Looking at sound Looking at physical aspects – 2.1.1 Physical patterns
With the title of Hans Jenny's 1967 book came the term Cymatics (translated from Kymatik)
to mean the study of wave phenomena. Jenny invented the tonoscope so that the human voice may
act as the stimulus to a surface on which sand is spread. Of an early performance of Lucier's The
Queen of the South, March 1972, Tom Johnson describes (1989, p. 23):
[…] four singers sit around a square metal plate, about three feet across, with sand sprinkled on it. As they sing into their microphones, the metal plate vibrates, causing the sand to shift into many different patterns.
A year later from that, Johnson writes that the piece has grown in both duration and scope to
include multiple surfaces that 'were stimulated by purely electronic sounds' (ibid, p. 42):
It may seem odd that a group of people would spend two hours watching minute particles vibrate and listening to the sounds that vibrate them, but there is an odd attraction to this symbolic activity, and most of the audience stayed until the very end. For me, the strongest association is with Navajo sand painting. But instead of a medicine man, the laws of physics are in charge of the mysterious rites. Lucier told me at the end of the evening that his own strongest association is with alchemy and that ‘The Queen of the South’ is an alchemical term.
He was attracted to the idea because of an appreciation for basic substances and for the mystery of how they interact with one another. Those with scientific backgrounds or with backgrounds in the visual arts would probably have made other associations.
The sounds were quite interesting in their own right, and it seemed like a rare opportunity to be able to watch these sounds as the many beautiful designs took form on the sheets. I felt I was getting a clue to the mysteries of the laws of the cosmos. What more can one ask of a work of art?
Cymatic patterns are visual manifestations of sound in particular conditions. Contemporary
Cymatics often employ liquid surfaces and dramatic lighting to capture photographic images of the
mesmerising shapes that transcend – from sonic to seeable – domains and stimulate imagination.7
These spatial manifestations are instantaneous representations of motion; they let us see something
of the movement present at a given moment in time, revealing to the human eye dynamic processes
of acoustic phenomena. Inspired by the sense of ever-present 'now' that these evanescent patterns
portray has come the idea of reversing the process, of controlling visual aspects in the moment and
letting sound be derived from the visual patterns being made.
2:Looking at sound Looking at physical aspects – 2.1.2 The temporal trace
2.1.2
The temporal trace
A more commonly encountered visual manifestation of the acoustic phenomenon is that which is
drawn as a trace of sound pressure variations over time. This describes the typical 'waveform'
representation of recorded sound, seen often in computer software. The concept of writing acoustic
sound as a graph of amplitude variation along an axis of time is so common place in contemporary
culture that one may overlook its impact on the way we conceive of sound as substance in the
composition of music.
While the influence of sound recording technology on music in general is the subject of
extensive research, this project is more specifically concerned with the visual aspect of recorded
sound; the roots of which are found with the phonautograph, now described as 'the first instrument
to record airborne sounds capable of being played back' (FirstSounds.ORG, n.d.). Patrick Feaster
writes (2008, p. 3):
On 26 January 1857, Édouard-Léon Scott de Martinville of Paris deposited a seven-page handwritten document with the Académie des Sciences. […] Entitled “Principes de Phonautographie,” this document is the earliest known account of the idea of using a membrane and stylus combination to inscribe
atmospheric sound waves.
It was not within the remit of the invention for the phonautograph to be able to reproduce as
sound the recordings that it made. Scott described his invention in relation to photography, which
was itself a newly emerging technology in the mid nineteenth-century, and suggested that the traces
made of sound – the phonautograms – be subject to visual inspection and study. The idea was of
'written sound' to be read by human eyes. It was only in 2008 that the FirstSounds initiative
re-synthesised sounds recorded as far back as 1860 as digital sound-files (Hennessey & Giovannoni,
2008). By doing so, they have effectively rewritten the first chapter in the history of sound
recording and playback.8
2:Looking at sound Looking at physical aspects – 2.1.2 The temporal trace Research by, and connected to, First Sounds has been ongoing during the period of this
project. In November 2012, with his book Pictures of Sound: One Thousand Years of Educed
Audio: 980–1980, Feaster applied and extended the new phonautogram reading techniques
(Dust-to-Digital, 2012):
Over the past thousand years, countless images have been created to depict sound in forms that
theoretically could be “played” just as though they were modern sound recordings. Now, for the first time in history, this compilation uses innovative digital techniques to convert historic “pictures of sound” dating back as far as the Middle Ages directly into meaningful audio. […]
In short, this isn’t just another collection of historical audio—it redefines what “historical audio” is.
On a purely aesthetic level this reanimating and rewriting of history can be taken as an
example proof of the reality-shifting potential of contemporary technologies. Of course it has
always been the case that advancements in technology have brought fresh potential for creative
expression and thus an expansion of perceived reality. Since the phonautograph, each newly
invented recording medium has introduced new ways of working with recorded representations of
sound, and so new possibilities for the composition of music.
2.1.3
Harmonic interactions
Another invention of the nineteenth-century that is related to the visualisation of sound as a physical
phenomena is the harmonograph. Although grounded in the physics of motion, the harmonograph
also connects to subjects that relate more to psychoacoustic aspects of sound, and so the discussion
here does extend toward that of §2.2 below. In the context of the preceding discussions, the
harmonograph may be thought of as a device for drawing temporal traces of Cymatic interactions,
where that term is taken in the broad sense of studying wave phenomena; the wave-like motions in
a harmonograph are provided by pendulums. The following description of the device is from
Antony Ashton's book Harmonograph: a visual guide to the mathematics of music (2003, p. 17):
2:Looking at sound Looking at physical aspects – 2.1.3 Harmonic interactions
pen.
As the pendulums swing, the pen makes a drawing that is the result of their combined motion.
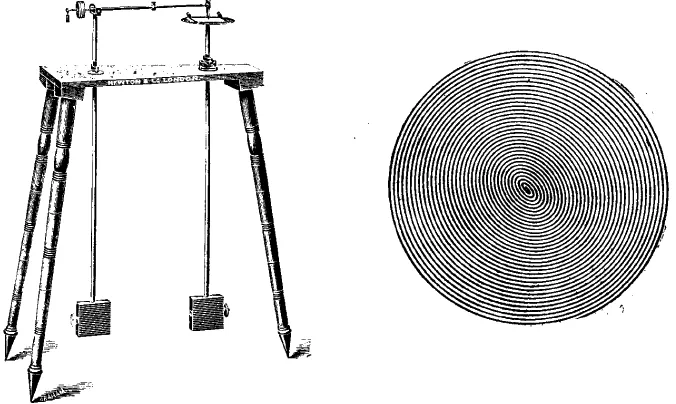
Showing a two pendulum harmonograph on the left, and a 'unison' trace drawn by a system
of this type, Figure 2.2 comprises Fig. 1 and Plate V.(B) from Harmonic Vibrations and Vibration
[image:20.595.125.463.228.430.2]Figures (Newton, 1909) which Ashton acknowledges as the basis for his 2003 book.
Figure 2.2: Fig. 1 and Plate V.(B) from 'Harmonic Vibrations and Vibration Figures' (Newton, 1909)
Because a pendulum oscillates at a single frequency it is 'a perfect way to represent a
musical tone, slowed down by a factor of about a thousand to the level of human visual perception'
(Ashton, 2003, p. 16). Changing the position of weights along the length of the pendulum shafts
will set how fast they swing.
The simplest harmonograph drawing is produced when both pendulums are the same length […]. With the pen held off the paper both pendulums are pulled back to their highest points. One is released, followed by the other when the first is at its midpoint. The pen is then lowered onto the paper to produce a circle developing into a single spiral. (Ibid., p. 20)
The spiral is formed in this situation by the decaying amplitude of the pendulum oscillations
over time, while the initial circularity can be understood mathematically by the plotting of sine and
cosine functions on the two dimensions of a cartesian plane: a reflection of the perpendicular
2:Looking at sound Looking at physical aspects – 2.1.3 Harmonic interactions shifted, by reducing the time waited before the second pendulum is released, then the circle
becomes an oval and if they are 'released together the result will be a straight diagonal line across
the paper' (ibid.). The traces become more interesting, however, when the lengths of the pendulums
are not producing 'unison' frequencies of oscillation; distinct geometric patterns are drawn by the
harmonograph when the ratio of the pendulum frequencies is corresponding to that of octave, fifth,
or fourth intervals (ratios of 1:2, 2:3, or 3:4) or to that of an overtone (such as 1:3), and so on,
whereas non-harmonic intervals yield less orderly patterns (harmonograms).
A source of pleasing variety in harmonograph drawings comes from small departures from perfect harmonies. This seems to involve a principle widespread in nature as well as in the work of many artists. There is a particular charm in the near miss.
An example from music suggests itself here. When two notes are sounded in near unison, the slight difference in their frequencies can often add richness or character to the sound. […]Eventually [a series of harmonograph drawings in which the length of one pendulum is gradually shortened] fades into a scribble that is a fair representation of discord […].
For most people this fading of visual harmony occurs at about the same point as the audible harmonies fade. (Ibid., p. 22)
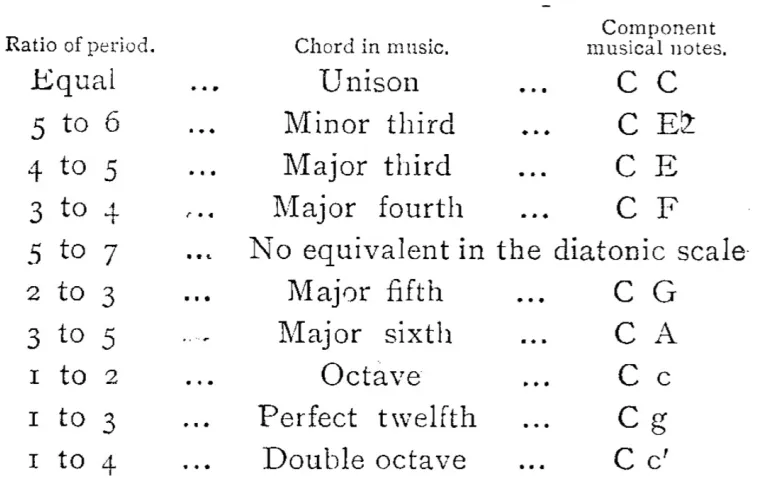
Charles E. Benham, in Newton (1909, p. 37), is careful to point out that 'the analogy of eye
and ear must not be pushed too far, and it is rather misleading to call the harmonograph figures
“music made visible,” as they have been styled sometimes'. Benham uses the ratio of 5:7 as an
example of a harmony which is 'pleasing to the eye' but has 'no musical equivalent chord' (ibid,
p.36). Whilst Benham suggests caution in connecting the principles demonstrated by the
harmonograph to aspects of music itself, I find that the premise for that caution to be flawed.
Although Benham's reasoning is rational, it seems – from a contemporary perspective – rather
overstated: not least that the given examples of interval equivalence (see Figure 2.3) neglect the fact
that equal temperament (ET) is not true to the harmonic proportions being described. The interval
of a fifth in ET (an 'equal fifth') is measured as 700 cents9 whereas – reading from the Intervals
appendix of (Benson, 2007, p. 370) – the 3:2 interval ratio, which is the Just and Pythagorean
2:Looking at sound Looking at physical aspects – 2.1.3 Harmonic interactions (perfect) fifth, is measured as 701.955 cents.
Figure 2.3: Benham's questionable table of harmonic intervals (Newton, 1909, p.36)
As with Chladni figures, the principles at play in the harmonograph are related to the
physical nature of reality. Just as the compositional exploration of Cymatic practices in Lucier's
Queen of the South is able to captivate the imagination of an audience, and suggest associations
with 'the mysteries of the laws of the cosmos',10 so too may the harmonograph system have
compositional value. In support of this notion, consider the following account from Ed Mattson.
While it is more common for musicking to be encountered as having the affect of entrainment on a
group of people – the synchronisation of human body moving to a musical pulse – Mattson
describes a similar collective behaviour based on visual engagement with the harmonograph.
Having designed and built a harmonograph, in Bourke (2008) Mattson writes:
I demonstrated the harmonograph at two of the annual shows put on by the Guild of Oregon Woodworkers but was not prepared for the response! It drew huge crowds and gasps of wonder as it did its magical thing. […] It was not just the drawing itself but the harmonious and mesmerising interaction of the parts of the machine that fascinated people as it swung away and drew the curves. The crowds were literally and unconsciously swaying in unison as they stood watching.
2:Looking at sound Looking at psychological aspects – 2.2 Looking at psychological aspects
2.2
Looking at psychological aspects
Whereas the physical motions of sounding objects may give rise to visualisation by virtue of
mechanical interaction between materials, the psychoacoustic aspects of sound, being as they are
constructed within the mind, require abstract systems of symbolic representation to bring them to
the visual domain. Once in the visual domain, any representation of auditory domain attributes
must also undergo the physiological and psychological processes of visual perception in order to be
comprehended by the human observer. Within such discussion one may venture a question toward
what extent perceptions, of either domain, are directly resultant of human physiology compared the
extent by which cultural conditioning influences interpretation of physical (light or sound) stimuli;
the subject of synaesthesia between sound and visual perceptions may also spring to mind, but it is
beyond the scope of this project to investigate these factors. It is, nonetheless, useful to include
some context with regard to a few of the differences and similarities found between perceptions in
these two sensory domains.
2.2.1
Morphophoric mediums and (in)dispensability
The following points of reference from Roger Shepard (1999) serve here as a contextualising primer
to the exploration of strategies for the representation of musical pitch and organised time in the
creation of portfolio works.
Shepard describes that both pitch and time, like visual space, are 'morphophoric mediums'
(p. 154, italics removed):
In their 1971 paper Attneave and Olson made the point that there is something fundamental about pitch, as there is about time. There are many other attributes to the organisation of sound – such as timbre, spatial location, and loudness – but the attributes of pitch and time have special importance. Attneave and Olson called pitch a morphophoric medium, meaning that it is a medium capable of bearing forms.
2:Looking at sound Looking at psychological aspects – 2.2.1 Morphophoric mediums and (in)dispensability
Time is a powerful morphophoric medium. Other dimensions used in music (such as loudness timbre and spatial location) are not morphophoric. […]
Shepard continues with examples that contrast the domains of visual and auditory perception
in terms of cognitive attributes that are either dispensable or indispensable (pp. 155–157). This
concept of the '(in)dispensability of attributes' can be illustrated by experiment, as is summarised:
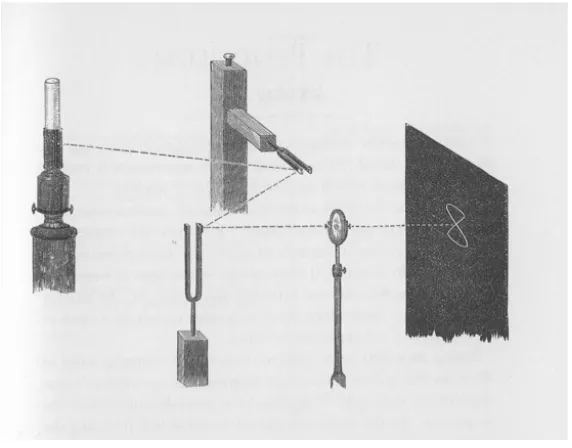
In the visual domain a pair of projectors are used to project spots of coloured light that have
two main attributes: colour and location.11 Loudspeakers, taken as the auditory counterparts to the
projectors, are used to produce simple (test tone) sound objects, such that the main attributes in the
auditory domain are pitch and location.12
First, in the visual domain, a red spot and a green spot are projected side by side, and two
discrete objects are perceptible by the human observer. If the two projectors are moved so that the
spots of light overlap – thus dispensing of the location attribute – then the human will see a single
object: a yellow spot of light. Location is indispensable in visual perception because the two spots
of light cannot be seen as separate without that attribute. For the auditory counterpart to this first
part of the experiment, middle C is sounded in the left speaker while the right speaker plays E
above middle C, and the two different tones are heard coming from the two sides. To dispense of
the location attribute, the centre speaker is used to play the same two tones together; the human is
able to correctly perceive the two pitches in the sound, and so the location attribute can be said to be
dispensable in auditory perception.
Next, the two spots of light are again projected side by side, but this time both spots will be
yellow, thus to dispense with the attribute of colour. For the auditory domain equivalent in the
experiment, the attribute of pitch is dispensed while maintaining that of location by using both left
and right speakers to each play a tone of pitch D above middle C. While the human observer
11 Different colours to those described by Shepard are used in this re-telling of the situation. The size and shape of the projected spots are to be considered equal regardless of projector angle etc.
2:Looking at sound Looking at psychological aspects – 2.2.1 Morphophoric mediums and (in)dispensability continues to see the two yellow spots as discrete objects (thus colour is dispensable), only one
sound object would be perceived as being located between the two speakers (and thus pitch is
indispensable).
One might think that pitch in audition is analogous to color in vision because both are frequency-related phenomena. However, the experiment using tones and speakers shows that the two are not analogous, because pitch is indispensable and color is dispensable. […] The indispensability of space in vision and of pitch in audition are parallel to both of those attributes being morphophoric media. So the analog to visual space is not auditory space but auditory pitch. (Ibid., §13.7)
2.2.2
Paradox and pitch perception
One finds paradox at various juncture in the unpacking of concepts within this research, and this has
been a source of both inspiration and frustration to the creative process. Continuing the theme of
contrasting visual and auditory perceptions, and moving towards the discussion of pitch- and
frequency-space representations – while also maintaining a connection to the works of Roger
Shepard – here are the words that open David Benson's section on 'musical paradoxes' in Music: A
Mathematical Offering (2007, p. 158):
One of the most famous paradoxes of musical perception was discovered by R. N. Shepard, and goes under the name of the Shepard scale. Listening to the Shepard scale, one has the impression of an ever-ascending scale where the end joins up with the beginning
Figure 2.4: Penrose stairs optical illusion
The Shepard scale illusion is a 'demonstration of pitch circularity'.13 'Pitch is the subjective
2:Looking at sound Looking at psychological aspects – 2.2.2 Paradox and pitch perception [psychoacoustic] variable corresponding most closely to the objective [physical] variable frequency'
(Loy, 2006, p. 158), and the Shepard scale auditory illusion is achieved by playing on the human
perception of octaves within the pitch attribute of sound.
While Benson uses the visual analogy of an ever-ascending staircase (Penrose stairs, see
Figure 2.414), Roger Shepard himself (in Cook, 1999, p. 158) compares the effect to the upward
spiralling of a barber pole in connection to the visualisation of pitch values on a helix; Shepard
explains the significance of a helical visualisation as a psychologically founded representation of
pitch (ibid., p. 157):
By examining the abilities of subjects to perceive and to produce pitch patterns under transformation, an appropriate representation of pitch can be found. [It has been] found that this representation corresponds to the log frequency scale, which is nice in that it preserves […] any interval under transformation, such as any arbitrary microtonal relationship. The log scale does not, however, represent the fact that certain intervals are special, such as octaves and perfect fifths. Ethnomusicological studies have found that octaves and perfect fifths seem to be culturally universal; that is, although musical systems and scales of all cultures differ in many respects, they almost always contain an octave relationship, and often the perfect fifth as well. […]
The German physicist Moritz Drobisch (1855) proposed that tones be represented on a helix. This helix, on the surface of a cylinder, places octaves immediately above and below each other.
As a three-dimensional model the Drobisch type of helix readily manifests the pitch-class
and octave-level aspects of perceived pitch in the visual domain.15 Shepard goes on to describe how
extensions to the concept, employing double helix, toroid, and helical cylinder forms, may provide
visualisation of the special relationships between both octave and fifth intervals. However, given
the two-dimensionality of both paper and screen – which are where my compositional practices
transpire – the three-, four-, and five-dimensional constructs described by Shepard seem
impracticable. Of course it is perfectly commonplace for three-dimensional objects to be
represented on flat surfaces, but, nevertheless, it was decided early on in this project that the visual
representations to be explored would all be two-dimensional constructs that may suggest, but do not
require, higher dimensions. By working only on the plane, conflicts of perception and problems
14 Public domain image, online at http://commons.wikimedia.org/wiki/File:Impossible_staircase.svg (accessed 20130310)
2:Looking at sound Looking at psychological aspects – 2.2.2 Paradox and pitch perception related to perspective and judgement of adjacency between points of a viewed object – the very
things upon which the paradoxical illusion of Penrose stairs predicate – can be avoided.
Returning to Shepard describing the auditory demonstration of circularity in pitch
perception (ibid., p. 158):
The inspiration for generating the circular Shepard tones came from the fact that Max Mathews at Bell Labs had created the first program for generating sounds using the computer. This aroused great
excitement, and the author did an experiment using a subdivision of the octave into 10 equal steps instead of the traditional 12. A note's position within the octave is called its Chroma, and the chroma circle is the base of the helix [described above]. The tones were formed by using a symmetrical structure, so that after an octave had been traversed, the ending tone was identical to the beginning tone.
It is, perhaps, worthy of note that computer music software, which was a new thing at that
time, played an important role in the creative practice of Shepard's research. A second observation
here is that many of my own works have, both prior to and since reading the above quoted, utilised
equal division of the octave in to a non-duodecimal number of steps.16 There is, however, a more
pressing motivation for the inclusion of the above quotation, and that is to question this use of the
word 'chroma':
Utilization of that word in this context is standard (see, for example, Mauch et al., 2009;
Bertin-Mahieux et al., 2010; Sumi et al., 2012), and it has been attributed to Geza Révész17 (Loy,
2006, p. 163):
Révész (1954) developed a two-component theory of tone, suggesting that there are at least two principal interlocking structures in pitch [perception] which he called tone height [and] chroma
Loy also writes that in developing the demonstration of pitch circularity, 'Shepard (1964)
wanted to test Révész’s theory' (ibid., p. 167). It seems, nevertheless, that using a colour-rooted
word to label an attribute of pitch within a spatial representation is – if not paradoxical, then at least
– contradictory to the consideration of the (in)dispensability of colour compared to pitch (as
outlined in §2.2.1). To remove the association of pitch perception to conceptions of colour, the term
16 See for example the nRadii work (§4.4.1), and in some of my 2010 web audio work: http://sdfhtml5.blogspot.co.uk/
2:Looking at sound Looking at psychological aspects – 2.2.2 Paradox and pitch perception 'pitch-class' is preferred for describing position within the octave; thus, pitch-class-circle is written
instead of 'chroma circle'; the way that this appears more cumbersome to write is, then, accepted as
a paradoxical quirk. The pitch-class-circle is addressed as an aspect of the spiroid-frequency-space
(§6).
2.3
Looking at looking at sound
This chapter has identified ways in which sound may manifest visual patterns on the surface of a
physical system. In Chladni/Jenny type Cymatics the acoustic interactions of physical matter give
rise to formations and shapes that favour resonance within the system. To the human eye the
manifestation of these shapes is perceived as an instantaneous reaction to the sound that is
happening 'now'; oscillations within this type of system are of frequencies that are perceived as
sound and so the eye may only perceive the patterns resultant of their periodicity. In the
harmonograph sub-sonic oscillations are traced over relatively long periods of time to reveal, at a
rate comprehensible to the eye, the shapes of what are, in principle, acoustic interactions.
Harmonograms and Cymatic patterns can bring only specific harmonic content to the visual
domain, providing representations of the motion that has occurred within a two- or
three-dimensional space. Although manifest over time, the passage of time is not itself represented in
these cases. In the phonautograph and related systems the passage of time is represented as one of
the visual dimensions allowing representations of arbitrary sound to be written.
Some psychological aspects of perception have also been introduced. Concepts pertaining
both to psychoacoustic and visual perception – as well as to the physical phenomena discussed
above – are engaged by this project as inspiration in the creation of, and composition with,
3:In software, on screen In software, on screen – 3: In software, on screen
3: In software, on screen
Formative works and study pieces from the early stages of the project are discussed in this chapter;
each section describes a different piece and its context, with the final section (§3.7) concluding the
contextualisation. Connections to the concepts introduced in the previous chapter are demonstrated,
just as later works will be shown to connect also with the concepts introduced, explored, and
developed in the works here described.
Having chosen to compose music through software-based systems while questioning the
possible implications of the visual aspects with such systems, particular attention has been given to
thinking about the 'and how' part of the question: what aspects of sound are being shown in
software, and how?
Visual representations of sound appear within software as part of the graphical user interface
(GUI) on screen. A computer screen is the medium by which a human may observe the virtual
worlds that are taken to exist within the computer. It is on, and within, such virtual worlds that this
project is focussed, and this includes the pursuit of creating new worlds within worlds through
computer programming (though it is rather more typical to use the term environments when
referring to these software worlds).
Most of the programming undertaken by this project has been within the environment of
MaxMSP (Cycling ’74, n.d.). My coding background includes programming with C and C++, and
although these languages were not used during this project, awareness remains of a C way of
thinking, and that that is underlying the MaxMSP environment. MaxMSP provides high-level
constructs that allow for rapid implementation of ideas in code, especially when those ideas have
3:In software, on screen In software, on screen – 3: In software, on screen slightly lower-level of access to (and control of) data, and programming styles other than that of
pure data-flow are incorporated into my works. During the project, some works have also involved
writing JavaScript for use with HTML5 (which has emerged during the period of this project)
within in the environment of a web browser. Similarly, the Adobe Flash environment has been
utilised for its widespread availability to potential audiences of interactive works (Adobe, 2009).
3.1
Pixels
For the 2009 Huddersfield Contemporary Music Festival (HCMF) I collaborated with Duncan
Chapman as part of The Music of Electricity (MoE) learning and participation programme. The
project was connected to the Raw Material exhibition18 of recent works by Tim Head. Chapman
conducted a series of workshops with A-level students and Year 6 pupils, culminating in a
performance19 during the festival. I was commissioned to produce an 'interactive sound installation'
for the project: a software-based system through which sounds recorded during the workshop
sessions could be heard online. At first hesitant to take on the work, a decisive factor in accepting
the commission came from reading texts by, and about, Tim Head which appealed to me as both a
creator and an appreciator of things:
Tim Head's work is about instability and uncertainty: of images, of perception and of the individual's relationship with the wider world. […] His work might be characterised as a search for visual equivalents for the tension between what we perceive to be the truth and what we know to be the truth. (Tufnell, 2003)
Speculation on the elusive and contrary nature of the digital medium and its unsettled relationship with the physical world and with ourselves forms the basis for recent work. […]
By operating at the primary one to one scale of the medium's smallest visual element (the pixel or inkjet dot) and by treating each element as a separate individual entity the medium's conventional picture making role is bypassed. You are no longer looking at a representation of an imported image in virtual space but are looking directly at the raw grain of the digital medium itself. The medium is no longer transparent but opaque. The slippery weightless world of the virtual is edged out into the physical world. (Head, 2008)
3:In software, on screen Pixels – 3.1 Pixels In particular, the idea of 'treating each [pixel] as a separate individual entity' is something
that had emerged in my own programming at Masters level, and which has continued since to
feature in my approach to the software medium. I eventually gave the name pixels to the MoE
interactive installation which resides online at http://www.musicofelectricity.net/pixels.
3.1.1
The sound of electricity
Participants of the workshops were introduced to the so-called twitching-speaker way of making
sound that is described in Handmade electronic music: the art of hardware hacking (Collins, 2006,
p. 20) as:
a beautiful electric instrument, evoking the spirit of nineteenth-century electrical experimentation (think twitching frogs legs and early telephones) out of nothing more than a speaker, some batteries, wire, and scrap metal.
When the positive and negative terminals of a (usually 9 volt) battery are connected to the
terminals of a speaker, the electromagnetic interaction within the circuit causes the speaker-cone to
be pushed forward (or pulled backward if the polarity is inverted). One of the connections in the
simple circuit is left unfixed so that it can be carefully closed by hand to cause the speaker to twitch
when the connection is made; a variety of buzzing noises can be achieved by finding positions in
which the electrical connection fluctuates, and further modifications to the sound of a
twitching-speaker are possible, for example by placing loose objects upon the twitching-speaker-cone. Participants
recorded and edited a variety of sounds that were made in this way.
Lo-fi electronics such as the twitching-speaker are a feature of my own performance
practice. Whereas the decision was made to focus exclusively on software-based systems in my
phd composition, I have been interested to bring concepts of that practice into the digital domain.
3.1.2
System architecture
3:In software, on screen Pixels – 3.1.2 System architecture two main parts: (1) the front end is web based and has an interactive audiovisual element created
with ActionScript3 (AS3) in Flash; and (2) at the back end of the system is a maxpat20 that generates
XML entries that are used by the Flash element of the system via drag-and-drop of folders
containing sound files. The system was constructed prior to the workshops (using a dummy set of
sounds from my own archive). Chapman wanted the workshop participants to categorise the
recorded sounds into different types, according to their own interpretation of the material; I
suggested the use of six category groups that could then be visually identified using distinct colours
on screen. Each pixel of a standard computer screen comprises red, green, and blue elements
(RGB), and all available colours are produced in each pixel on screen by setting the levels of these
elements. The six colours used in the MoE pixels are those made of either two (in equal measure),
or just one of the three base elements, as shown in the following table:
Name: red yellow green aqua blue magenta RGB mask: 1 0 0 1 1 0 0 1 0 0 1 1 0 0 1 1 0 1
Six folders are named to correspond with the six colour names, both on the local machine
where the sound-files are edited and categorised, and then on the web hosting which is accessible
via FTP connection. The original plan was to use the jit.uldl object to handle the uploading of all
the sound-files and the generated XML file to the hosting, all from within a maxpat. That aspect of
the design was dropped because of issues relating to Jitter objects causing problems within the
MaxMSP Runtime on the Windows OS (which is how the back end of the system was to run, while
its development was on the Mac OS). The workaround for this problem was to use separate FTP
software for the uploads, which meant less automation of the process but more stability.
When the MoE pixels webpage is accessed by the public audience, the sound-files are
loaded in Flash, one at a time, using information from an XML file which includes the filename and
3:In software, on screen Pixels – 3.1.2 System architecture designated colour of each sound-file. Upon successful completion of each load, a visual
representation of the sound-file is created on screen: a random number is multiplied by the
appropriate 'RGB mask' (as in the table above); the resultant colour is given to a square that is
placed at randomly selected cartesian coordinates which conform to a 20-by-20 grid upon the Flash
stage; the square itself is the size of one such grid cell. When the mouse-point passes over one of
these coloured squares, the associated sound-file is played and the location of the square is changed,
again to a randomly selected cell of the grid. The location selection algorithm is designed so that
only an 'unoccupied' cell is given as the new location for a square. After all the sound-files have
[image:33.595.55.544.344.660.2]been loaded, the webpage will look something like is seen in Figure 3.1:
Figure 3.1: MoE Pixels
It was found that in some situations the mouse-point can be moved over a square without the
3:In software, on screen Pixels – 3.1.2 System architecture wonder where I'd gone wrong in the AS3 programming, it was soon embraced as feature, rather
than a bug, and the 'mouse down' (md) and 'mouse up' (mu) functions were added to the code in
order to access the expected movement and sound. There is also another, less often encountered,
bug by which a square seems neither able to move nor play its sound; to address this the md
function was further modified to also trigger any one randomly selected sound-file from those
loaded, thus avoiding a situation in which nothing at all happens in response to the mouse input.
Adapting the code of a program, during its development, to embrace unexpected behaviours
as features of the software is a commonly employed strategy in my practice. In many forms of
creative art, it is often the 'happy accidents', as Bob Ross put it,21 that are most compelling and that
enable a work to grow beyond its original conception.
3.1.3
Audience interaction
None of the above description of the software is provided to the audience of the MoE pixels work.
When the work is accessed (see Figure 3.1), only three words appear on screen: the title (punctuated
with a colon) at the top; a hyperlink to 'reload' the webpage (thus resetting/re-randomising the Flash
element) at the side; and, at the bottom, the word 'about...' hyperlinks to general information about
the HCMF MoE project (text similar to that given at the start of §3.1). In withholding instruction
and description of the work, the aim is to engage the imagination of the audience who are invited
(by implication) to explore the screen and discover the sounds. The specific connections that I have
made between concepts, sound-files and visual representations may or may not be identified, and it
is of no consequence if they are or not. There is no 'correct' way to interact with the system and so
no one (who can see and/or hear, and is able to control a mouse-point on screen) ought to feel
excluded from participation. Talking to Duncan Chapman and Heidi Johnson (of the HCMF) about
the work, during its development, I would often use the term 'Flash toy', but the word toy is in no
3:In software, on screen Pixels – 3.1.3 Audience interaction way meant to belittle the work; the most serious and sophisticated electric instruments and
softwares can be equally referred to as such, the emphasis being that the playing of/with them is
fun.
Correspondence from one visitor to the work included a snapshot of their screen showing
'the fruits of [their] labour' while 'enjoying [the online installation]' – an outcome that must have
taken quite some time to achieve, testifying to the success the non-direction approach towards the
motivation of individual creativity when interacting with the MoE pixels – see Figure 3.2 (Baldwin,
personal communication by email, 2009):
Figure 3.2: MoE Pixels, image from Baldwin (2009)
Another use of the system that was unexpected during its development was instigated by
Chapman who suggested adaption of the system as a software instrument for laptop ensemble. A
number of non-internet-connected laptops each had a copy of the MoE pixels system (both its front
and back end parts) running locally, and A-level student workshop participants created their own
sets of organised sounds to load in and play via pixels during the Gallery performance. Under
Chapman's direction the students devised an indeterminate score for the performance which
3:In software, on screen Pixels – 3.1.3 Audience interaction One of the great appeals of creating software-based works is the way that the software
medium lends itself to re-appropriation. It is also of interest to observe that audience experience of
software-based artworks tend to involve some sort of participation beyond observation. In the
anticipated interaction with pixels, the audience are the online visitors whobecome (perhaps
unwitting) participants in an improvised musical experience; free interpretation and self-determined
duration and direction exist within the infinite but bounded possibilities of the piece. In the
described case of pixels-as-instrument, the laptop-performers (by being aware of the underlying
software architecture, and interacting also with the backend maxpat element) became a sort of
'super-user' audience to my work; the performance piece that they then created was entirely their
own and had its own audience and aesthetics.
3.1.4
Inherent paradox
While engaging, to some extent, with the aesthetics of the Raw Material exhibition, pixels is
knowingly abstracted from the true nature of the computer screen medium. Presentation of the
work offers the suggestion that each coloured square is a magnified representation of a computer
screen pixel (as suggested by the colon after the title above the Flash stage; see Figure 3.1, page
32). Under critical examination, however, the interactive behaviour of entity relocation exhibited in
the work betrays that association. A computer screen consists of many pixels which, if one brings
one's eye close enough to the screen, can be seen as individual squares that are arranged in the
manner of a grid or matrix.22 The apparent appearance of visual forms on screen is achieved by the
different colouration of many pixels across the surface; human perception is generally of the
represented form(s), rather than of the picture's elements (pixels) within the medium.
In pixels, when a coloured square is seen to disappear from under the mouse-point at the
same time as a square of that same colour appears in another location, the perception is
3:In software, on screen Pixels – 3.1.4 Inherent paradox (potentially/probably/intended to be) of a single entity that has relocated; this identification is
supported in the auditory domain by the fact that the then appeared square would go on to trigger
the very same sound as before should it be 'moused' again. These squares are, indeed, programmed
into the system as 'sprite' entities, so that from the software perspective it really is the case that the
same representation of a square is having its position on screen changed. It is thus that the
suggested association of those squares as pixels is undermined: in the physical medium of a
computer screen the pixels do not move, they only change colour.
One is led to consider that visual representation in software, on screen, is illusionary in
every instance. 'There is no spoon' comes a popular refrain from the (Wachowski & Wachowski,
1999) film The Matrix, and as noted early in this thesis (§1.2.1) there is no sound on screen: only
representations of it. Further, then, one may concede that even the representations of sound that
appear on screen are only percepts stimulated in the eye of the beholder by the matrix of pixels that
comprise the surface of a screen.
There are different approaches to GUI programming that software may take. Flash employs
a paradigm of vector based graphics in which shapes are described in code as shapes with attributes
such as size, position, and colour; the programmer need not think about the actual pixels that will be
used produce the described shapes on screen, and there are many advantages to this approach.
There is, however, an aesthetic appeal – as expressed by Head in the Raw Material exhibition – to
the direct control of individual pixels, and many of my works incorporate an approach of matrix cell
value manipulation.
3.1.5
Towards programming with matrices
One seldom thinks of the individual pixels on screen, of how each pixel is changing colour at its
fixed position, but rather one accepts as concrete the visual forms that appear upon the display.
3:In software, on screen Pixels – 3.1.5 Towards programming with matrices seen on screen. By conceptualising visual representations in software from the ground up, this
project has sought to nurture a sense of connection to that aspect of the software medium, as in the
type of connection one may expect of a composer to the sounds with which they compose. The
influence on this project of Tim Head's aesthetic can perhaps be identified in this sentiment, but the
motivation of my exploration in this area is to appreciate the nature of the screen medium as the
material basis for visual representations of sound in the software medium.
Data matrices that can correspond directly to the actual pixels on screen are a conceptual
starting point from which are programmed software systems that set matrix cell values in order to
manifest visual forms on screen. The RGB channels of the GUI domain can be thought of as
discrete layers. At a coding level, the three values that describe the colour of a pixel in an image are
often accompanied by a fourth value, known as alpha, that is used to describe transparency (or
opacity). When working with Jitter matrices in MaxMSP the arrangement of those four layers
follows the ARGB format in four planes; the 'char' data type is used because its 8-bit size is
sufficient for the numeric values that comprise the four layers of each cell in a grid matrix that is to
be displayed as an image on screen. For example, a Jitter matrix that is given the name 'm', and the
horizontal and vertical dimensions that match the classic VGA standard,23 would be declared in the
code of a maxpat as jit.matrix m 4 char 640 480. 'The planes are numbered from 0 to 3, so the
alpha channel is in plane 0, and the RGB channels are in planes 1, 2, and 3.'24 This project has been
mostly interested in working with just the RGB planes from which the GUI is manifest on screen;
Awareness of the alpha plane is necessary in programming, but it is considered ancillary to the
visual manifestation.
23 The VGA standard resolution is commonly known to be 640 (wide) by 480 pixels; see for example (Christensson, n.d.)
24 From 'What is a Matrix?' in Max 5 Help and Documentation accessed within MaxMSP, but also online at
3:In software, on screen Visyn – 3.2 Visyn
3.2
Visyn
3.2.1
Introducing visyn
Visyn began as an exercise in generating visual patterns on the computer screen; it is an ingenuous
exploration of 'visual synthesis' founded on the idea of applying techniques known from audio
synthesis and musical composition to a graphical domain. The patterns were synthesised as purely
abstract visual manifestations of the underlying processes without the role of representing any other
thing. At various times this piece has been disregarded as a dead-end, only to be re-remembered
and revisited with fresh perspectives at later stages of the project. The final decision to include this
work in the portfolio is based on the aesthetic principles of design exhibited in the piece, which with
retrospect, are identified as significant to the project as a whole. While the pixels piece (above)
brought more clear critical engagement with some of the aesthetics involved, visyn – which predates
pixels by almost a year – shows that my fondness of matrix cell data manipulation and display had
already begun to emerge in my practice.
The final version of the work is visyn_10e.maxpat (illustrated in Figure 3.3 below), and
opening that maxpat will suffice for the following discussion of this formative study. It may be
observed that, in the 'visyn' directory of the portfolio, there are a number of maxpat files that all
carry the 'visyn_' name with appended version numbers; these allow development of the work to be
traced.25 As with all of my works which are version numbered in this sort of way, only one version
should be open in Max at any given time; this is, among other possible reasons,