An Algorithm for Identifying the Change of Road
Restriction Based on K-means Clustering
Yan-ling DENG, Fu-min ZOU, Xiang XU and Rong HU
Fujian Key Laboratory for Automotive Electronics and Electric Drive, Fujian University of Technology, Fuzhou Fujian, China
Keywords: Trajectory data, Data mining, Road restriction, K-means, Clustering algorithm.
Abstract. In view of dynamic changes of the road network, the aim of this essay is to recognize the location of the road with changed restriction information. Based on the FCD (floating car data), it studies the trajectory characteristics of the vehicle at first, including when the vehicle turning left, right or around. And then, it extracts the target points by using two criteria, one is the deflection an-gle of the vehicle, the other one is the change of the relative position. In addition, also the most im-portant step, it determines the initial clustering center according to the density distribution charac-teristics of target points. Lastly, after clustered by K-means, it can identify quickly that the road al-lowed to turn or not. And if the traffic information of this road is same as the actual road, the re-striction state is unchanged, otherwise, changed. Compared with the traditional algorithms, the ac-curacy of the optimized one is higher, and it can take advantage of FCD to implement the dynamic update of change information of the urban road network.
Introduction
At present, domestic navigation electronic map industry is growing rapidly. According to the re-port, the market value of it reached 2.68 billion yuan in 2013. Because of the strengthened function of Baidu map and AMAP, people are becoming more and more independent to them. With the ad-vancements of urbanization, the urban traffic of many cities tend to be saturated. To improve the traffic efficiency of road intersections and the traffic capacity of the entire road network, traffic di-visions often implement path optimization adjustments, bringing changes to network information. However, the hysteresis of the updates of electronic maps usually mislead people and bring great inconvenience. Therefore, it’s extremely important to improve the efficiency of public transporta-tion, relief the pressure on urban traffic, and get the accurate information of network changes in time.
The development of floating car technology and the increase of floating car number provide technical support and foundation data to the acquisition of the urban road network information. The study of network changes mainly involved with these aspects as follows, the discovery of new road, one-way road restrictions, and the information recognition of the road lane number decreases caused by construction, etc. However, as one of the main object of road network information change, road restriction, the acquisition of which is lack of related research.
As the traffic of many cities in China has been saturated, many roads are forbidden to turn right, left or back, to improve the capacity of the network. There are 107 intersections not being allowed to turn around in Fuzhou [6]. But the information has failed to be passed to the public or the cover-age is not enough, causing inconvenience to the public travel. Thus it’s vitally important for the public to be aware of the restriction information about the road. As a result, how to obtain the change information about the traffic restriction become very important.
Research Status
There are many researches related to clustering in the field of data mining. To cluster data objects, a lot of classic algorithm has been emerged. Some scholars, like Ham, summed up five kinds of clus-tering algorithm including the algorithm based on classification, density, hierarchical, network, and model [7]. K-means algorithm is one of the most widely used spatial clustering methods based on classification.
Currently, the K - means clustering algorithm has been widely applied to actual scenes at home and abroad, such as using spatial data mining method to cluster house prices and analyze the distri-bution of urban house prices [8], analysis on massive data of intelligent power utilization [9], text data clustering [10], etc. In fact, K - means algorithm itself has some shortcomings. The traditional algorithms take error sum of squares as the objective function to measure the quality of the cluster-ing and select initial clustercluster-ing center randomly. However, the K value is very hard to estimate, which affects the quality of algorithm cluster directly. Therefore, to improve the quality of the clus-tering algorithm, the researchers have been made lots of optimization to the original algorithm. The choices of initial clustering center can be divided into three types generally: random sampling, dis-tance optimization and density estimation [11]. Yang [12] put forward a new K-value optimization algorithm, using distance cost function as inspection function to test the validity of the optimal number of clusters and establishing the corresponding mathematical model; Lai [13] proposes a modified K-means algorithm based on density, determining the initial clustering center by using clustering the distribution density of the object; In view of the distribution density of data objects, Zhou [14] takes vertical midpoint between nearest two points in the high density data as the initial clustering center and optimizes clustering number combining equalization function. All of these methods have been made up for the insufficient of the traditional algorithm to some extent. And this paper, based on existing algorithm, designs an algorithm that taking the high density point as the initial clustering center according to the characteristics of the density distribution of the source data, which solves the problem of algorithm itself sensitive to the parameters.
Algorithm Design and Implementation
Theoretical Analysis and Algorithm Design
The state of city road restriction whether change or not is based on the pattern recognition of the turn sections. And the data used to identify the location of this road comes from trajectory data of floating car. Generally speaking, the FCD is a series of discrete points achieved by low frequency sampling. And because of its sparsity, the information of FCD will be deficient inevitably. To ob-tain more turn information of the road hidden in the FCD, the paper provides an algorithm to iden-tity target sections. Reading the basic attributes of data, including the instantaneous velocity, direc-tion, latitude and longitude, it takes point data as a unit and extracts the target points through calcu-lating the amount of angle deflection and the change of relative distance when the vehicle turns, and to recognize the target sections by clustering method finally.
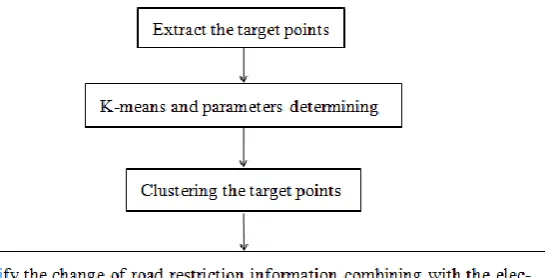
not. And the flow chart about information mining for status changes of road restriction as shown in Figure 1.
Figure 1. Information mining flow chart of road restrict status changes.
Target Points Extraction
Original Data Cleaning. Data cleaning is the process of data preprocessing including several parts, detecting and removing noise and unrelated data, dealing with missing data, deleting empty data and white noise data under the background of knowledge. In the process of data mining, data cleaning is the first step, also a crucial step.
Affected by the weather, unstable GPS signal and positioning devices itself, the quality of the trajectory data can’t be guaranteed fully. When the quality of the original data is poor, the accuracy of the algorithm must be constrained. Therefore, the paper has carried on the data cleaning before experiment from following aspects:
( i j) 0, j i 5 min
V p p t t t (1)
120
/
V
km h
(2)( , ) ( , )
(
i j)
(0,120
/ ),
i lat lon j lat lonV p
p
km h p
p
(3)Among them, Eq. 1 works to filter the speed equals to zero for a long time (more than 5 minutes). The trajectory of the floating car is restricted by urban road network, and its speed will also be lim-ited. So, the main function of Eq. 2 is deleting the data whose speed beyond 120 km/h. Meanwhile, some data shown as Eq. 3 whose speed within the normal range but the position stays same for a long time, need to be filtered as abnormal data.
In addition, because of large error resulted from GPS offset, several data that can’t be matched to the road network will be removed in the next matching process. And to guarantee the continuity of the data, taking ten records as a process unit, if the time interval is more than two minutes between two points of the same car, it is regarded as interrupt data to be deleted.
Turning-around Points Extraction. According to the fact that the running vehicle must follow the road conditions and traffic regulations, its trajectory can reflect the condition of the road net-work to some extent. Thus, extracting corresponding characteristics for the trajectory of the floating car can detect the dynamic changes of the road network. It is worth mentioning that the vehicle has obvious running regular when turn around, in other words, the radian and relative distance of vehi-cle before and after turn around all accord with regular rules.
lati-tude lati and the angle Agl p p( i, j), among them, Agl p p( i, j) is the angle formed by vector i j
p p
and the north.
1 1 1 2 1 2
1 1
1 2 1 2
( , ) ( ) ( , )( )
( , )( , )
i i i i m m m m
i i m
i a i b m m m m
Agl p p Agl p p A A A A A
t t t t
p p p p s s s s a i b
(4)
Among them, Am1,Am2 represent the parameters of the vehicle deflection angle, the interval formed represents the scope of the vehicle to turn around; sm1,sm2 is the parameter for the relative distance and pa,pb represent two points before and after the turning point pi.
The extraction of turning points is carried on from two aspects, including deflection angle of the vehicle and the changes of relative distance and relative speed when the vehicle turning around. The main steps are as follows:
1. Input data preparation: exporting data from database into text data set; 2. Sorting all data according to the terminal number of the vehicle; 3. Obtaining the data of one car and traversal processing;
4. Processing data circularly and judging whether the data meets the constraint conditions of Eq. 4 above or not;
5. Extracting the points satisfy the requirement of the formula and exporting to target points set as original text data for clustering.
Turning Points Extraction. Different from the target points of turning around, the extraction of the points turning left or right mainly relies on the matching process. The specific extraction process is as follows:
1. The same as the extraction turn-around point front, before experiment, it need to handle the data based on several requirements, and then classify the data according to vehicle’s terminal ID;
2. Taking vehicle’s terminal number as the index, it should sort the data by the field of ‘gps_date’ and deal with the data in turn;
3. Loop to extract and handle two points. Firstly, it need to match these two points to road net-work and keep a record of matched road sections as ROAD1 and ROAD2 respectively. Sec-ondly, to judge that these road sections whether be same or not, as if the same, return to step 3, otherwise, carry out the next step;
4. Access to the geographical spatial database and determine whether two sections connected or not on the topological relationship. If two sections are connected, it need to calculate the an-gle formed by two sections. Until the anan-gle conform to parameters set before, these points can be extracted as target points, otherwise, return to step 3.
As mentioned above, because the FCD is uploaded to the server with a certain time interval, about 30 seconds, floating car may occur large displacement. As a result, the target points extracted may occur some mistakes.
In view of the sparsity of the target points, the article put forward a kind of clustering algorithm based on K-means, reducing the error of turning points to a large extent and enhancing the accuracy of location identification of the target roads.
Clustering Algorithm for the Target Points
the actual network accurately.
As for how to match the floating car data to a specific path, there are some practical algorithm. Reference [16] puts forward a map matching method based on road buffer and map rasterization that having a good real-time performance and high efficiency. Reference [17] designs a kind of adaptive map matching method based on grid partitioning, which can achieve better matching effect quickly. Although it also need to match the target points to the concrete road and position, the ulti-mate goal of this research is turning road, so how to further optimize the matching algorithm is not the focus here.
According to the actual needs, on the basis of reference [17], the paper adopts the algorithm that using the grid index. At the same time, combined with the shortest path constraint conditions, it matches the target points to the road by further calculating the direction similarity of trajectory point and the road section, and to select matched sections and position for the target points. The re-sult is shown in Figure 6(b).
Target Points Clustering Algorithm. The traditional K - means algorithm is a kind of clustering method based on distance, which is put forward by McQueen [18], and the core idea can be con-cluded as follows.
The first thing is to determine the number of clusters k and choose k initial clustering centers for points set R { , p p1 2,...,pn}. And then, all points need to be categorized into one class of the cluster, at the same time, adjusting the class centroid and categories constantly. Finally, making the sum of square distance between each pointpiand nearest clustering centerCnreach the minimum ( convergence).
This algorithm is reliable and has fast convergent rate in theory, but the result is sensitive to the initial clustering center. Therefore, the paper improves the traditional algorithm focus on the initial clustering center, taking the point with high density as the cluster center, which is calculated by the density distribution of the points. Lastly, optimizing the parameters according to the evaluation in-dicators of the clustering quality and achieving the best.
The optimization for the clustering algorithm of the turning points mainly focus on the calcula-tion of the density of the data. The data set of the turning points is R { , p p1 2,...,pn}, and the den-sity of point pi isD( )pi , the specific formula is as follows:
+1 1
1
1
1
D( )
min -1
ij
n
i m
p p j
l p
(5)
Among them, n is the parameter of density, and >1; p p 1 represents the Euclidean dis-tance between two points p p, 1; lij consists of all paths connecting pi and pj; And m is the number of points in the path.
The specific steps of the algorithm as follows:
Input: data set R { , p p1 2,...,pn} and k, the number of cluster. Output: clustering results: k clusters, and convergence.
1. Select k initial clustering centers according to the density distribution characteristics, namely the formula above;
2. Calculate the distance between every sampled points pi and each cluster center, and classify them to the nearest class;
4. Calculate the deviation, if it is convergent, return all clustering center and terminate algo-rithm, otherwise, return to step 2.
The Result Validation of the Clustering Algorithm
Inspecting the result of clustering algorithm mainly relies on the vector electronic map of Fuzhou on the ArcGIS platform, which is provided by the Gold, and the coordinate system is GCS_WGS_1984. This study is to verify the clustering results by using the information of the net-work traffic rules analyzed from electronic map.
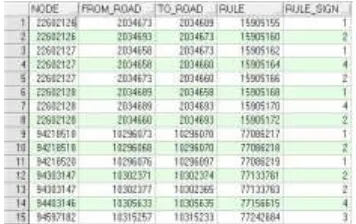
The basic structure of the road network includes point, road section and road, and this research mainly uses the basic information and traffic rules information of the road section. The basic infor-mation of the road section is shown as Figure 2 (only intercept part), including name, ID, length, width and nodes of the section, etc. The traffic rules data consists of cross nodes and start-stop sec-tions as shown in Figure 3, among them, FROM_ROAD and TO_ROAD are two secsec-tions connect-ed by the NODE, and the field of RULE_SIGN represents the flag of the traffic restrictions, 1 rep-resents forbidden to turn left, 2 reprep-resents forbidden to turn right, 3 reprep-resents no-turn and 4 means the road with no U-turn. Depending on the existing restrictions information of the network, it is need to match the target sections produced by clustering to its corresponding state of traffic strictions. If the status is consistent, it can be concluded that the status of the road section with re-striction information is not changed, otherwise, changed. And lastly, make a record and update the flag of the road section after check.
[image:6.595.350.528.373.485.2] [image:6.595.68.303.374.489.2]
Figure 2. Road basic information. Figure 3. Traffic restriction information of road.
Experiments and Analysis
Experimental Environment
The data source of the study is from GPS trajectory data of more than 100000 floating car in Fujian province. The floating car, the motor vehicle installed positioning and wireless communication de-vices, mainly are commercial vehicles. Much of the floating car involved in this study is taxi, about 25.6% of the total number of vehicles. Beside the taxi, it also includes various levels of the provin-cial bus, intercity buses, tourist buses and heavy duty truck, semi-trailer tractor, etc.
Field name Example
MDID 2482866
AREAID 0
LONGITUDE 119.354637
LATITUDE 26.032568
SPEED 20
DIRECT 4
GPS_DATE 2015/2/3 0:00:51
CAR_TYPE 41
STATUS 1
[image:7.595.201.396.86.205.2]The FCD is the real-time information of the vehicle, whose attributes as shown in table above. It is necessary to preprocess the original data before the experiment. On the one hand, preliminary fil-ter the data through several SQL conditional statements in the SQL server (shown as Figure 4), on the other hand, write the corresponding code for data cleaning, and the specific process as shown in above.
Figure 4. Data’s general information.
Clustering Experiments and Results Analysis
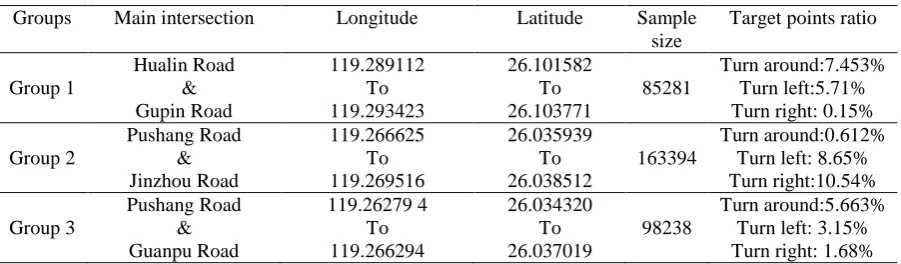
The experiment is divided into two steps, including the extraction of target points and identification of the target road section. At first, the experiment carry out an initial test for the accuracy of ex-tracting target points. Taking single intersection as detection object, it selects three intersections and extracts FCD nearly a week. Specific experimental information as shown in table 2.
Table 2. Experimental information.
Groups Main intersection Longitude Latitude Sample
size
Target points ratio
Group 1 Hualin Road & Gupin Road 119.289112 To 119.293423 26.101582 To 26.103771 85281 Turn around:7.453% Turn left:5.71% Turn right: 0.15%
Group 2 Pushang Road & Jinzhou Road 119.266625 To 119.269516 26.035939 To 26.038512 163394 Turn around:0.612% Turn left: 8.65% Turn right:10.54% Group 3 Pushang Road & Guanpu Road 119.26279 4 To 119.266294 26.034320 To 26.037019 98238 Turn around:5.663% Turn left: 3.15% Turn right: 1.68%
Known from the preliminary test experiments, the accuracy of the target point extraction is very high. Although the range of sample is different, the target points extracted have its own regularity. Generally speaking, the same intersection has three kinds of target points, and the ration of them has obvious difference. And through comparing the proportion of various target points, it can determine the direction of the road, whether allow to turn left, right or turn around. At the same time, it can provide source data for the next clustering process and be helpful to identify the target road section.
[image:7.595.164.434.288.405.2] [image:7.595.74.525.523.655.2]between 26.025169 and 26.038803, the experimental region has about 1.2 million data in total one week, and the target points nearly 20 thousands. In addition, the experiment using the comparison method to divide the data into two groups and carry on the contrast experiments for the clustering before and after improvement. The clustering effect under the two clustering methods are shown as follows.
Figure 5. Comparison of experimental result.
Learning from the experiment above, the effect of two clustering methods, the traditional algo-rithm generating initial clustering center randomly and the advanced algoalgo-rithm calculated through points density, is different. Obviously, not only clustering effect, but also the algorithm accuracy, the latter is better than the former. Additionally, when choosing the values of the parameter K, the number of cluster, it makes repeated adjustment combined with the number of intersections and road sections. And it can be concluded that the effect of clustering reaches best when the K is equal to the number of the intersections roughly.
At last, the experiment shows the clustering effect for U-turn target points of the experimental area within a day as follows. Among them, the figure 5 is the distribution figure of the original data, figure 6 is the distribution picture of the matched target points, and the figure 7 is clustering effect picture.
[image:8.595.67.521.476.598.2](a). Original data distribution (b). Data matching result (c). Clustering algorithm result Figure 6. Result shows.
Conclusion
The paper put forward an algorithm for identifying the change of road restriction based on K-means clustering. It extracted the turning points by analysis of the trajectory feature of the turning vehicle firstly; and clustering the target points using optimized K-means algorithm. Then, it made a com-parison of clustering results with restrict information of the actual network. After that, automatically recognizing the road section that the status of traffic restriction changed. Choosing the high-density points as the initial clustering center according to the density distribution of the data, it eliminates the sensitivity and random selectivity of the traditional K-means algorithm for the initial clustering center. The experiment results show that the improved algorithm has higher accuracy in recognizing target road sections.
0.00% 20.00% 40.00% 60.00% 80.00% 100.00% Turn around
Turn left Turn right
Comparison of experimental results
tion for the integrity of the vehicle trajectory and the space and time correlation of the data. The re-search in the future will rely on the overall vehicle trajectory, taking full advantage of the topology information of the road network, and to find the changed status of road traffic restriction more quickly and accurately.
Acknowledgements
The present work was supported by a grant from the Key Project of Science and Technology of Fu-jian Province (Grant No. 2014H0008, 2011I0002, 2014H2010) , Science and Technology Project (Grant No. 2014-G-83) and Cooperation project (No. 2016JX04).
References
[1] H. Xiao, Navigation electronic maps have wide prospect and the hot spot is application in the field of car and mobile [EB/OL]. [ 2015-6-17]. http://mt.sohu.com/20150617/n415205685.shtml [2] X.H. Jiang, L.L.Chao, F.M.Zou, Automatic detection algorithm for new roads based on trajec-tory of floating cars [J]. Journal of Computer Applications, 2013, 33(2):579-582.
[3] G. Guang, Methods of New Road Detection Based on FCD and Image Contrast Technolo-gy[D].Central South University, 2012.
[4] W.D. Fang, R.Hu, X.Xu, et al. A novel road network change detection algorithm based on floating car tracking data [J]. Telecommunication Systems, 2016: 1-7.
[5] X.H. Jiang, D. Zhu, L.L.Chao,, et al. Dynamic identification of one-way road state based on floating car data[J]. Journal of Computer Applications, 2013, 33(6):1759-1762.
[6] B.Li, Fu Zhou: 107 intersections is proposed to ban left and 6 to no U-turns. [EB/OL]. [2012-10-27]. http://fj.qq.com/a/20121028/000010.htm.
[7] J. Han, M. Kamber, J. Pei, Data Mining: Concepts and Techniques [M]. Morgan Kaufmann Publishers Inc., 2011.
[8] Zhang S, Xu H. Urban housing distribution research based on clustering analysis of spatial data mining [J]. Journal of Lanzhou, 2011(5):64-68.
[9] Li Z, X. Hou, Jun H U, et al. Improved K-Means Algorithm Based Analysis on Massive Data of Intelligent Power Utilization [J]. Power System Technology, 2014, 38(10):2715-2720.
[10] Wang C, Zhang J. Improved K-means algorithm based on latent Dirichlet allocation for text clustering [J]. Journal of Computer Applications, 2014.
[11] B. Feng, W. Hao, G. Chen, et al. Optimization to K-means initial cluster centers [J]. Computer Engineering & Applications, 2013.
[12] S.L.Yang, L.I. Yong-Sen, Xiao-Xuan H U, et al. Optimization Study on k Value of K-means Algorithm [J]. Systems Engineering-Theory & Practice, 2006, 26(2):97-101.
[13] Y.X. Lai, Optimization study on initial center of K-means algorithm [J]. Computer Engineer-ing & Applications, 2006.
[14] W.B. Zhou, Y.X. Shi, Optimization algorithm of K-means clustering center of selection based on density [J]. Application Research of Computers, 2012, 29(5):1726-1728.
[16] Y. Li, Q. Li, A Fast Algorithm for Huge Volume Floating Car Data Map-Matching: A Vector to Raster Map Conversion Approach [J]. Geomatics & Information Science of Wuhan University, 2014. 39(6):724-728.
[17] H.C. Tao, M.A. Lin-Bing, H.L.Wei, et al. Study on an Algorithm of Auto-Adaptive Map Matching for Floating Car Data Based on Grid Division[J]. Geography and Geo-Information Sci-ence, 2015.