Temperature dependent crystallization of amorphous Y
67Fe
33studied by kinetic small angle neutron scattering
M Al-Jawad1 and S H Kilcoyne2
1 Department of Oral Biology, Leeds Dental Institute, University of Leeds, Leeds, LS2 9LU, UK. 2 Institute for Materials Research, University of Salford, Salford, M5 4WT, UK.
Email: [email protected]
Abstract
Temperature-resolved small angle neutron scattering has been used to study the nucleation, growth kinetics and crystallite morphology in the Y-Fe system. Crystallization from amorphous Y67Fe33 to the
YFe2 Laves phase via a novel ‘YFe’ intermediate phase has been followed to completion as a function of
temperature from 180ºC to 500ºC. The SANS results agree well with published kinetic neutron diffraction data. Below 390ºC, diffraction data suggest that SANS arises solely from the contrast between crystalline Y and the Fe-rich amorphous matrix. Between 390ºC and 410ºC all temperature variables are seen to form a sharp peak. This suggests that critical scattering occurs at Tc≈400ºC. This critical scattering implies full
crystallization of Y67Fe33 occurs over a very narrow (~20ºC) temperature range.
1. Introduction
Studying the kinetics of processes such as crystallization, phase formation and grain growth in metallic systems leads to a deeper understanding of these fundamental physical phenomena, and allows the possibility of tailoring the microstructures of materials for their particular applications. Time-resolved neutron scattering is a
particularly powerful technique with which to measure any kinetic process where the neutron scattering lengths of the starting and final materials are sufficiently different to be distinguished. Rare earth-transition metal (RE-TM) alloys are frequently studied because of the interesting magnetic properties they often exhibit [1-2], and their potential technological applications (high-density permanent magnets, magnetic storage media, and giant magnetoresistive materials). The large number of crystallographic phases, observed in RE-TM systems provide the opportunity to vary magnetic exchange, anisotropy, coercivity, and conduction electron density making them ideal candidates to test theories of magnetic properties of intermetallics, such as the fundamentals of spin fluctuation, moment formation, and magnetic order.
The crystallization processes in rare earth-transition metal binary systems and the associated equilibrium phase diagrams are thought to be well established for most compounds. Phase diagrams are generally constructed using a quenching technique, where samples are heated to the desired temperature and then cooled rapidly. It is
assumed that the crystallographic state existing at elevated temperature is ‘frozen’ into the system. However, this approach has limitations, as was demonstrated by Kilcoyne et al in 2001 with the discovery of a new ‘YFe’
with elemental Y. This phase only exists over a narrow temperature range (approximately 60ºC). By 450ºC, no Bragg peaks arising from the intermediate ‘YFe’ phase are observed. Lastly, at 450ºC the YFe2 Laves phase forms. This phase coexists with pure Y until completion of the reaction at 490ºC.
Observation of the intermediate phase indicated that this was a previously unreported phase which clearly required further investigation. Kilcoyne et al managed to stabilize the phase at room temperature by rapidly
cooling ribbons from 375ºC. Diffraction patterns were collected regularly during cooling, to confirm that the phases present at elevated temperature were unaltered at room temperature [3]. The crystallographic parameters of the ‘YFe’ intermediate phase were determined using pattern matching analysis with the FullProf program [4] and are given in Table 1.
[image:2.612.206.401.290.384.2]In this paper we present the results of a small angle neutron scattering (SANS) study of nucleation and grain growth during crystallization in the Y-Fe system as a function of temperature. The results are linked to the diffraction data obtained on the D2B diffractometer at ILL, Grenoble and presented in [3].
Table 1 Refinement parameters from D2B refinement and pattern matching (taken from [3]).
Phase 1 Y Phase 2 ‘YFe’ Space Group P63/mmc P63/mmc
a 3.628(3)Å 12.90(1)Å c 5.739(5)Å 1.171(1)Å
c/a 1.58 0.91
γ 120º 120º
R(Bragg) 2.76 1.60
2. Experimental Procedure
Polycrystalline Y67Fe33 ingots were produced using an argon arc furnace. High purity elements (99.9% purity Y, and 99.99% purity Fe) were melted together in an argon atmosphere from which any gaseous impurities were removed by first melting a titanium “getter”. To ensure homogeneity, ingots were melted and turned several times and their masses were limited to 10g. The ingots were then cut into small pieces (0.7 to 1.0g) in
preparation for melt spinning. Once melted in a quartz tube, a burst of Ar gas forced the molten sample onto the rapidly rotating copper wheel, cooling it at a rate of ~106 Ks-1. Several grams of amorphous ribbon, ~20
µm thick
and several cm long, were produced using this method.
Approximately 2g of melt spun Y67Fe33 ribbons were mounted in a flat, circular vanadium cell. The sample cell had a radius of 10mm and a thickness of 2mm. The cell was mounted in a standard vanadium-element vacuum furnace on the SANS instrument D22 at the Institute Laue Langevin, France. The set up used allowed a Q range
of 0.0018Å-1 to 0.015Å-1 to be explored. The ribbons were first heated to 150ºC for one hour to establish thermal equilibrium, and then heated from 180ºC to 500ºC (i.e. the temperature range in which all three stages of
crystallization can be observed) at 1ºC min-1 whilst SANS patterns were collected every minute. In order to compensate the measured intensity to account for the efficiency of the detector and for the detector surface being planar rather than spherical, a standard sample must be measured. In our experiment where relative cross-sections, rather than absolute values are required Perspex, which has a uniform cross-section in the Q range of interest, is a suitable standard.
3. Results and Discussion
Figure 1 shows the variation of I(Q) with Q for several temperatures between 180ºC and 500ºC plotted on an x-y
380ºC, I(Q) increases in the high Q region, whereas at very low Q, (Q<0.004Å-1) it remains unchanged. Between
380ºC and 400ºC I(Q) increases in both the low Q (Q<0.006Å-1) and high Q regions. Above 400ºC, I(Q)
[image:3.612.178.420.229.405.2]continues to increase at low Q but starts decreasing at high Q.
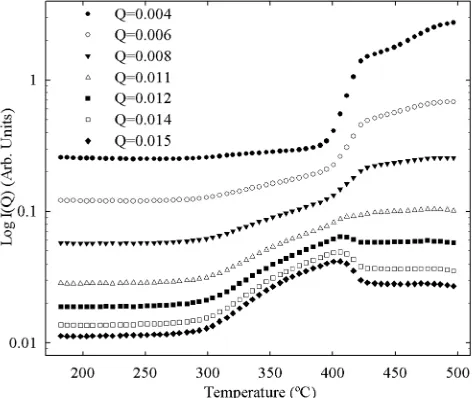
Figure 2 shows the variation of I(Q) with temperature at several Q values. This plot also illustrates the marked
difference in the behaviour of I(Q) at low Q and at high Q as a function of temperature. At high Q, I(Q) starts to
increase at around 300ºC and continues to increase until ~410ºC where it peaks. It then decreases between 410ºC and 430ºC. From 430ºC to 500ºC I(Q) stays approximately constant in the high Q region. At low Q, I(Q) stays
constant until ~390ºC. From 390ºC to 420ºC it increases sharply, and from 420ºC to 500ºC it continues to increase but at a lower rate. At intermediate Q, 0.006Å-1<Q<0.01Å-1, the temperature dependence of I(Q) shows
behaviour from both the high Q and low Q regimes.
[image:3.612.82.546.404.639.2]Figure 1 log I(Q) vs log Q at various temperatures during heating at 1ºC min-1 of amorphous Y67Fe33. Errors lie within the data points. The y-axis has been logarithmically scaled to fit all the curves on the same axes.
[image:3.612.180.416.441.640.2]Assuming a monodispersed system of particle sizes, Guinier plots of log I(Q) versus Q2 for spherical particles
were used to estimate the mean particle size [5]. The Guinier approximation is only valid in a limited low Q
range up to QRG~1.2 where RG is the radius of gyration of the spherical particles. In this work, Guinier plots do
not give the expected straight line suggesting that a range of particle sizes exists in the Y-Fe system. This is not unexpected since from kinetic neutron diffraction experiments it is known that the crystallization of amorphous Y67Fe33 follows a complex multi-stage, multi-phase process. One or more crystalline phases or an amorphous phase coexist at any given temperature and these different phases will have different correlation lengths. Linearity is seen however, in plots of 1/I(Q) versus Q2 and 1/I(Q)1/2 versus Q2 which suggests that a Lorentzian
or Lorentzian squared distribution would be a more appropriate model for the data. Although strictly only valid in the Guinier region, the generalized Lorentzian function given in Equation 1 appears to provide a good description of the data for the entire Q range.
(
)
2
2 2
( )
( ) z
z
A I Q
Q
κ
κ
= +
(1)
where A is the scattering amplitude, which is related to the number of particles and the contrast in scattering
length density in the material. The range parameter 1/κ, is the average length-scale of fluctuations in scattering
length density, and gives the particle size or the distance between particles. z is the power of the Lorentzian term.
A power of Lorentzian expression, is observed when scattering arises from a Maxwellian distribution of geometrically similar particles [6]. Equation 1 was used by Boardman et al to fit similar structural SANS data
collected on D11 (ILL, Grenoble) during the crystallization of amorphous Bi2Sr2CaCu2Ox [7].
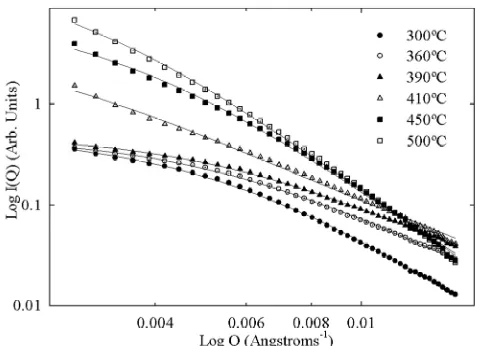
Equation 1 fits the SANS data collected during the crystallization of amorphous Y67Fe33 extremely well across the whole Q range and temperature range. The fits to the data collected at several temperatures between 300ºC
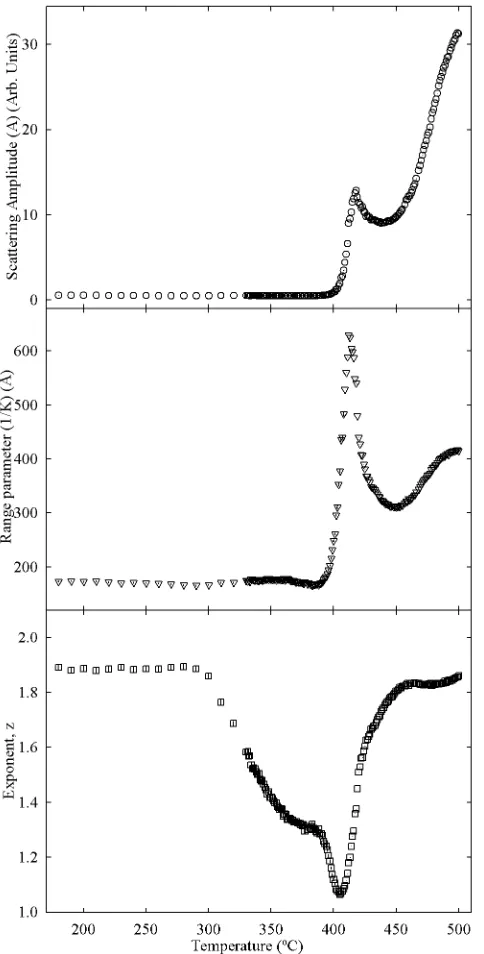
[image:4.612.178.417.414.587.2](the start of Y-crystallization) and 500ºC, are shown in Figure 3, while Figure 4 shows the temperature dependence of the fit parameters A, 1/κ, and z.
Figure 3 SANS data fitted to the general Lorentzian function given in (1).
In can be seen in Figure 4 that for T<300ºC the scattering is effectively squared Lorentzian in form (z~1.9),
indicating that a broad distribution of structural inhomogeneities exist in the melt-spun ribbons [8]. The range parameter suggests that these inhomogeneities are ~170Å in size. At 300ºC, the power of the Lorentzian term, z,
starts decreasing non-linearly reaching ~1.3 at 390ºC, and then drops rapidly between 390ºC and 410ºC almost reaching unity at 410ºC. A and 1/κ do not alter between 300ºC and 390ºC. Between 390ºC and 410ºC however,
1/κ reaches a peak of 700Å at 410oC, which is still within the resolution of D22 for our experimental setup.
Between 410ºC and 450ºC z begins to increase and returns to its initial value of ≈1.9 by 450ºC. Over the same
temperature range, A decreases to a local minimum and 1/κ drops rapidly reaching a minimum of 300Å at
450ºC. Above 450ºC, z remains approximately constant at 1.9 while A and 1/κ both start to increase again, with
[image:5.612.180.422.165.642.2]1/κ reaching a value of 410Å when the experiment was terminated at 500ºC.
A comparison of temperature dependent SANS data with temperature dependent neutron diffraction data (from Kilcoyne et al[3]) during crystallization of amorphous Y67Fe33 is given below. Features are seen in both the diffraction data and SANS data at 300ºC, between 390ºC and 450ºC, and above 450ºC.
At 300ºC
From the diffraction data, it is known that the sample remains amorphous until 300ºC when Y grains start to precipitate out. Using the Scherrer equation on the FWHM of Bragg peaks arising from the Y phase, Kilcoyne et al found that Y grains first appear at 300ºC and are 170Å in size. The same value of 170Å is found for the range
parameter, 1/κ, at the start of heating on D22, which suggests that the Y67Fe33 sample used on D22 was not completely amorphous and that Y grains were already present in the ribbons. Unfortunately it was not possible to check the amorphicity of ribbons by diffraction before starting the experiment, however previous studies of Y67Fe33 have shown that small quantities of crystalline Y can be present in melt spun ribbons [9]. The value of the power of a Lorentzian parameter, z, was found to be ~1.9 at 300ºC. Dierker et al [8] stated that Lorentzian
squared scattering (z=2) can arise from a crystalline phase existing in an amorphous matrix with sharp interfaces
between them, agreeing with the argument that nanocrystalline Y grains are present in the amorphous matrix of the melt spun Y67Fe33 ribbons.
Between 390ºC and 450ºC
All three variables in the SANS fits (A, 1/κ and z) peak between 390ºC and 410ºC. This suggests that critical
scattering occurs in this temperature range and suggests that there is a critical point that defines the transition between one state and another [10]. Ornstein and Zernike demonstrated that during critical scattering, the scattering distribution is Lorentzian in shape [11, 12]. In addition, Birgeneau et al [13] showed that the Fourier
transform of the correlation function C(Q) could be written as:
(
2 2)
( ) p C Q Q κ κ ∝ + (2)where p is the critical exponent and 1/κ is the correlation length (or range parameter). For the case of z=1,
Equations 1 and 2 are equivalent with a critical exponent of p=2.
Generally, there are two possible causes for the critical scattering seen in structural SANS data. The first is that a percolation threshold has been reached at a critical temperature, Tc. The second is that critical scattering is
occurring near Tc in a continuous, higher order phase transition. The neutron diffraction data collected by
Kilcoyne et al [3] show that at ~390ºC there is a large drop in the background signal as the whole sample
crystallizes. It is clear from this that the Y67Fe33 sample fully crystallizes extremely rapidly at ~390ºC whilst at the same temperature the new ‘YFe’ phase appears. This points to the critical scattering seen in the SANS data being caused by the sudden crystallization of the whole sample – i.e. a percolation threshold. The rapid increase in 1/κ as the temperature approaches Tc therefore suggests that there is an increase in the average grain size as
the crystallites grow and impinge on one another prior to the effectively infinite crystalline cluster being formed at the percolation threshold. A value of Tc≈400ºC can be extracted for the critical temperature of the full
crystallization of amorphous Y67Fe33.
Above 450ºC
From diffraction data, 450ºC is the temperature at which the new ‘YFe’ phase transforms into YFe2. Also above 450ºC is when the Y grains grow most rapidly. SANS above Tcat T>450ºC can therefore be explained by the
phase transformation from the new ‘YFe’ phase to YFe2 as the atoms reorder and the Y and YFe2 grains grow.
4. Conclusions
agreement with the neutron diffraction study by Kilcoyne et al. At low temperatures, diffraction data suggest that
SANS arises solely from the contrast between crystalline Y and the Fe-rich amorphous matrix. At T~400ºC critical scattering is observed corresponding to the full crystallization of the sample. Above 410ºC, trends in A,
1/κ and z can be followed as a function of temperature, but having a complex multi-phase system makes it is
difficult to isolate the individual range parameters, 1/κ, for each crystallographic phase (Y, ‘YFe’ or YFe2).
Until now the lowest reported Fe concentration in a Y-Fe compound was ~67%, (YFe2) but, through the formation of this phase, this has now been reduced to 50%. It is hoped that it will be possible to isolate this phase, and through understanding how the magnetic properties relate to the crystallographic properties and growth morphologies we will be able to tailor micro- and nano-structured materials with interesting technological applications.
Acknowledgments
The authors would like to thank Dr Ross Stewart at the Institute Laue Langevin for his assistance during the small angle neutron scattering experiment and for help with data processing and normalization. In addition we thank Professor Bob Cywinski for his guidance and useful discussions.
References
[1] Wallace WE 1973 Rare Earth Intermetallics (New York: Academic Press)
[2] Franse J J M and de Boer F R 1995 J. Mag. Mag. Mat.140 789-92
[3] Kilcoyne S H, Manuel P and Ritter C 2001 J. Phys.: Condens. Matter13 5241-50
[4] Rodriguez-Carvajal J 1990 FULLPROF: A Program for Rietveld Refinement and Pattern Matching Analysis
Abstracts of the Satellite Meeting on Powder Diffraction of the XV Congress of the IUCr, p. 127, Toulouse, France.
[5] Guinier A 1963 X-ray diffraction in crystals, imperfect crystals and amorphous bodies (W H Freeman and
Co., London)
[6] Guinier A and Fournet G 1955 Small Angle Scattering of X-rays (John Wiley, New York)
[7] Boardman C J, Kilcoyne S H and Cywinski R 1991 Physica C185 633-4
[8] Dierker S B and Wiltzius P 1991 Phys. Rev. Let.66 1185-8
[9] Al-Jawad M 2004 PhD Thesis – Time-resolved neutron studies of metallic phase formation (University of
Leeds)
[10] Gerold V and Kostorz G 1978 J. Appl. Cryst.11 376-404
[11] Ornstein L S and Zernike F 1914 Proc. Amst. Akad. Sci.17 793-806
Zernicke F 1916 Proc. Amst. Akad. Sci.18 1520-7
Ornstein L S and Zernike F 1917 Proc. Amst. Akad. Sci.19 1312-5
[12] Ornstein L S and Zernike F 1918 Phys. Z.19 134-7
Ornstein L S and Zernike F 1926 Phys. Z.27 761-3
![Table 1 Refinement parameters from D2B refinement and pattern matching (taken from [3])](https://thumb-us.123doks.com/thumbv2/123dok_us/371270.1038064/2.612.206.401.290.384/table-refinement-parameters-d-refinement-pattern-matching-taken.webp)